
Experimental Study on the Influence of Permeability Coefficient of
Granite Residual Soil
Hua Hu
1,2,3
and Zhirong Lin
1,2,3
1
School of Architecture and Civil Engineering, Xiamen University, Xiamen, China
2
Tan Kah Kee College, Xiamen University, Zhangzhou, China
3
Shenzhen Research Instiute, Xiamen University, Shenzhen, China
Keywords: Granite Residual Soil, Permeability Coefficient, Seepage Test.
Abstract: In order to study the influence of void ratio, seepage flow, confining pressure and principal stress difference
on the permeability coefficient of granite residual soil samples, four groups of seepage tests of 16 samples
were designed. The test results show that with the increase of initial void ratio, the permeability coefficient
increases gradually, and the final increase trend of permeability coefficient slows down; with the increase of
confining pressure, the permeability coefficient decreases gradually, and the decrease trend of permeability
coefficient slows down; with the increase of main stress, the permeability coefficient decreases gradually, and
the decrease trend of permeability coefficient slows down; with the increase of seepage flow rate The
permeability coefficient increases gradually, and the increasing trend of permeability coefficient becomes
larger.
1 INTRODUCTION
Granite residual soil is mainly distributed in the
southeast region with abundant rainfall in China,
where there are many granites. The granite in contact
with rain and air has changed its mineral composition
after weathering for a certain period of time, and the
internal structure of the soil has cracks. Under the
influence of the surrounding environment, the granite
has formed residual soil over time. Underground
geotechnical engineering is growing more and more
significant as the economy grows. The study of the
mechanical properties of granite residual soil is
inextricably linked to projects like subways, tunnels,
foundation pits, slope protection, and so forth.
Residual soil is easy to soften and disintegrate when
encountering water. Water will alter the internal
skeleton structure of the particles as it infiltrates, and
the penetration may have an impact or drag effect on
the soil particles. The more fine particles the
percolation force can carry away the larger the
percolation pores will be and the direction of the
percolation force is fixed to induce a rearrangement
of the particles. Additionally, more orderly pore
channels can also make the infiltration more smooth
and enhance the permeability characteristics of soil.
Seepage characteristics are of great significance for
many working conditions such as rainfall, water level
change and foundation pit drainage in practical
projects.
Liao Hongjian(Liao et al., 2005) et al. considered
the research of slope stability caused by the speed of
water level decline and the permeability
characteristics of soil, and combined with the
simulation calculation of seepage field in actual
working conditions, obtained the influence law of
water level decline and soil permeability coefficient
on the stability coefficient.Lu Yulin(Lu, 2018) et al.
consider the influence of coupled seismic and seepage
fields on the change of slope stability, combining the
common limit equilibrium theory with both
earthquake and percolation conditions to study and
refine the calculation method of stability coefficients.
Yan Fangfang(Yan et al,. 2019) et al. considered the
effect of different rainfall duration on the variation of
the water level line of the seepage field and the slope
instability slip surface. The simulation results showed
that the longer the rainfall duration the higher the
water level line the larger the slope slip surface, and
the rainfall had a greater effect on the surface layer of
the soil. Shi Zhenming(Shi et al,. 2016) et al.
considered the changing law of slope stability during
rainfall infiltration on multi-layered soil slopes,
improved the seepage field model, calculated the
strength parameters in the seepage process of
Hu, H. and Lin, Z.
Experimental Study on the Influence of Permeability Coefficient of Granite Residual Soil.
DOI: 10.5220/0011953000003536
In Proceedings of the 3rd International Symposium on Water, Ecology and Environment (ISWEE 2022), pages 169-174
ISBN: 978-989-758-639-2; ISSN: 2975-9439
Copyright
c
2023 by SCITEPRESS – Science and Technology Publications, Lda. Under CC license (CC BY-NC-ND 4.0)
169

different soil layers and carried out numerical
simulations, and the results showed that the stability
coefficient of soil decreases as the depth of rainfall
infiltration increases. Liu Caihua(Liu et al, 2005) et
al. considered the influence of slope water level rise
on slope stability change, and the simulation results
showed that the slope stability coefficient first
decreased and then increased due to the effect of pore
water pressure during the water level rise, which was
also related to the attenuation of shallow strength
parameters. Liu Caihua(Liu et al, 2005) et al.
considered the impact of groundwater changes on
slope stability changes during the sudden drop of
reservoir water level, and analyzed a large number of
practical cases. The results showed that there was a
certain delay time for groundwater to drop after the
sudden drop of reservoir water level, which had an
impact on slope instability.Ma Mengxiang(Ma et al,
2018) et al. considered the effect of the rate of change
of water level rise and fall on the change of reservoir
slope stability, and the simulation study results
showed that the rate of change of water level has a
greater effect on slope stability, and the effect of
water level rise and fall on stability is different.
However, there are few research results on the
influence of various internal and external factors on
the permeability coefficient of residual soil.
Therefore, this paper mainly studies the influence of
pore ratio, seepage flow, confining pressure, principal
stress difference and other factors on the permeability
coefficient of granite residual soil samples under
constant waterhead.
2 EXPERIMENTAL
PROGRAMME
To investigate the effects of pore ratio, seepage flow
, confining pressure and main stress difference on the
penetration coefficient of granite residual soil
specimens, four sets of seepage tests with a total of 16
specimens were designed, in which specimens 1-4
were tested to study the effects of initial pore ratio on
the penetration coefficient, specimens 2-8 were tested
to study the effects of seepage flow rate on the
penetration coefficient, specimens 9-12 were tested to
study the effects of confining pressure on the
penetration coefficient, and specimens 13-16 were
tested to study the effects of different main stress
differences on the penetration coefficient.
Table 1
displays the test conditions for each group of tests.
Table 1.
number
Initial void
ratio
confining
pressure
(kPa)
Seepage
flow
(ml/min)
Principal
stress
difference
(kPa)
1 1.0 70 0.02 0
2 1.1 70 0.02 0
3 1.2 70 0.02 0
4 1.3 70 0.02 0
5 1.0 70 0.02 0
6 1.0 70 0.04 0
7 1.0 70 0.06 0
8 1.0 70 0.08 0
9 1.0 70 0.02 0
10 1.0 120 0.02 0
11 1.0 170 0.02 0
12 1.0 220 0.02 0
13 1.0 70 0.02 0
14 1.0 70 0.02 20
15 1.0 70 0.02 40
16 1.0 70 0.02 60
3 EXPERIMENTAL EQUIPMENT
AND TESTING
3.1 Experimental Equipment
The instrumentation used in this test is the SLB-1 type
stress-strain controlled triaxial shear permeability
tester, which can be used to conduct seepage shear
tests under constant water head and constant flow
conditions, respectively. The test equipment is shown
in Figure 1. The parameters that can be adjusted or
displayed for each function of the instrument are: the
controllable range of specimen axial pressure is 0-
20kN (±1%), the controllable range of strain in shear
test is 0.002-4mm/min (±10%), the controllable range
of stress in shear test is 0kN-20kN(±1%), the
controllable range setting value of specimen
circumferential pressure is 0.01-1.95MPa, the set
value of counterpressure in percolation test can be
controlled in the range of 0.01-0.99MPa(±0.5%FS),
the volume flow rate in constant flow percolation test
can be controlled in the range of 0.02-30ml/min, the
volume deformation ignores positive and negative
and the maximum deformation is 480ml.
ISWEE 2022 - International Symposium on Water, Ecology and Environment
170
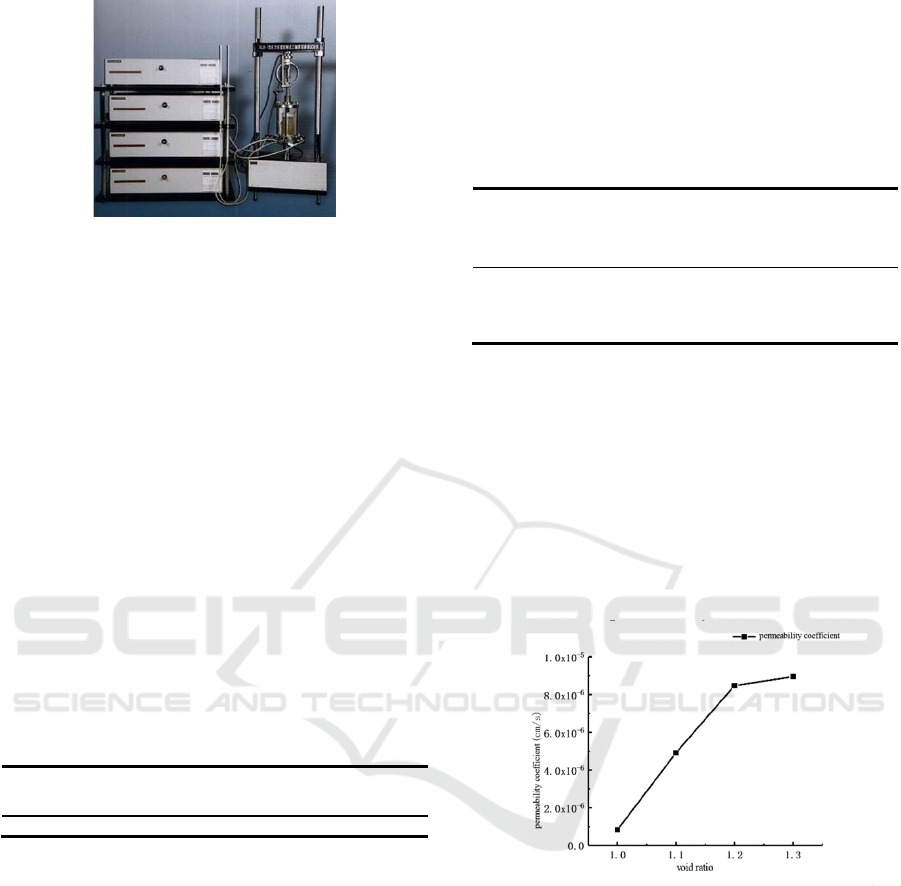
Figure 1: The stress-strain control shear penetrant triaxial
test apparatus
3.2 Experimental Testing
The test soil samples were taken from a granite
residual soil slope, firstly, all the soils were dried and
crushed, and then the soil was sieved with a
maximum particle size of 2mm sifter. The main
physical properties are shown in Table 2. The
specimen models used for the test were all
Φ39.1×80mm models. In order to prepare soil
samples with a specific initial pore ratio, the dry
density of the soil can be calculated based on the
required pore ratio, and then the mass of the required
soil can be calculated based on the already prepared
soil samples with a certain moisture content. The
specimen is saturated by means of vacuum pumping
and later solidified, and the solidification end
condition is set to be zero pore water pressure.
Table 2: Main physical property indexes of granite residual
soil.
Restricted
particle size
(mm)
Median
size
(mm)
proportion
Liquid
limit
(%)
Plastic
limit
(%)
I
p
Plasticity
index
0.006 0.0008 2.7065 46.5 23.1 23.4
The seepage test adopts the constant waterhead
seepage method. In the test, open the back pressure
valve and set the back pressure at the upper and lower
ends, and the numerical difference is the constant
head value. Set the back pressure at the upper end to
0 and the lower end to 50kPa. The constant waterhead
value is 50kPa.
4 EXPERIMENTAL RESULTS
AND ANALYSIS
4.1 Influence of Seepage Flow on
Permeability Coefficient
Triaxial seepage shear tests were conducted under
different initial pore ratio conditions according to the
experimental scheme. The permeation coefficients
obtained from the seepage tests are shown in Table 3.
The variation of the penetration coefficient with the
initial pore ratio is shown in Fig. 2.
Table 3: Effect of initial void ratio on permeability coeffi-
cient.
number
Initi-
al
void
ratio
confining
pressure
(kPa)
Seepage
flow
(ml/m-
in)
Principal
stress
differen-
ce
(kPa)
Permeabil-
ity
coefficient
(cm/s)
HLL1 1.0 70 0.02 0 8.34E-07
HLL2 1.1 70 0.02 0 4.91E-06
HLL3 1.2 70 0.02 0 8.48E-06
HLL4 1.3 70 0.02 0 8.95E-06
According to the trend shown in the data in Fig.
2 and table 3, it can be seen that when the confining
pressure, flow rate and main stress are the same and
the initial pore ratio is within the range of 1.0-1.3 in
the test, the permeability coefficient increases with
the growth of the initial pore ratio, but the increasing
trend gradually slows down. The initial pore ratio
from 1.0 to 1.3 corresponds to an increase in the
permeability coefficient from 8.34E-07cm/s to
8.95E-06cm/s. The order of magnitude increases by
one level, thus showing the importance of the initial
pore ratio on the permeability coefficient.
Figure 2: Relationship between initial void ratio and per-
meability coefficient.
The larger the pore ratio, the better the
connectivity of the percolating pores and thus the
larger the contact surface of the percolating water
with the particles around the pores. With the gradual
increase of percolation force, the directional
percolation force promotes the orderly arrangement
of particles. The more orderly pore channels also lead
to smoother infiltration. The initial pore ratio in the
test increased from 1.0 to 1.3, and the corresponding
permeability coefficient increased from 8.34E-
07cm/s to 8.95E-06cm/s, but the increasing trend was
gradually slowing down.
Experimental Study on the Influence of Permeability Coefficient of Granite Residual Soil
171
4.2 Influence of Initial Pore Ratio on
Permeability Coefficient
Triaxial seepage shear tests of remodeled soils were
conducted according to the test protocol at different
flow, the obtained permeability coefficients are
shown in Table 4, and the variation of permeability
coefficients with flow is shown in Fig. 3.
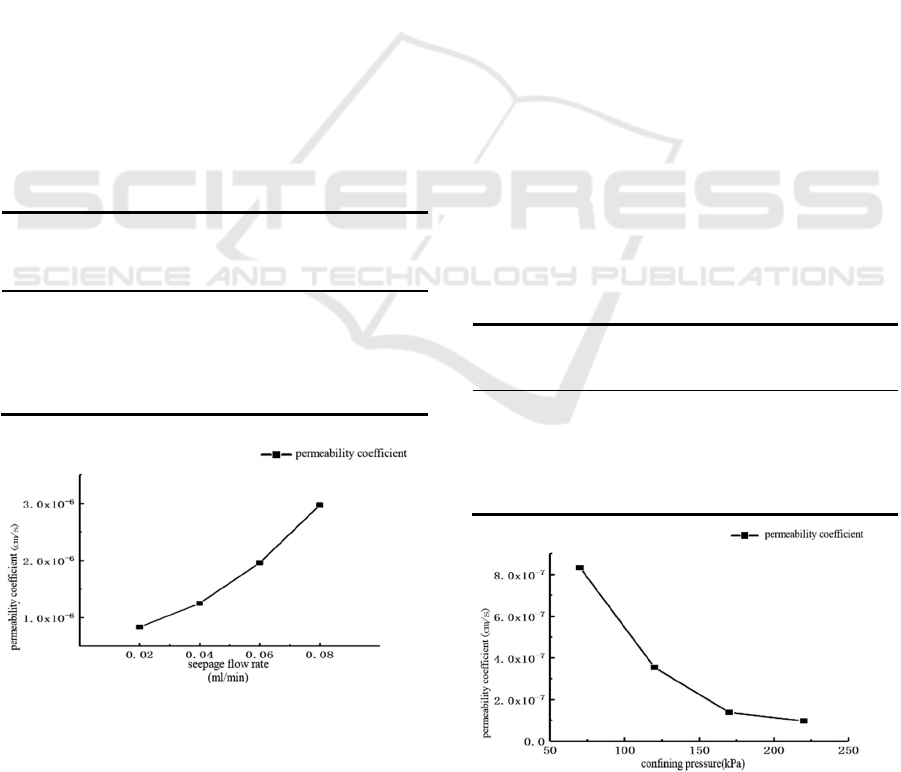
According to the data in Fig. 3 and table 4, when
the void ratio, confining pressure and principal stress
are the same in the test and the flow rate is within the
range of 0.02ml/min-0.08ml/min, the permeability
coefficient also increases with the growth of the flow
rate.
The permeability coefficient varies from 8.34E-
07cm/s to 2.97E-06cm/s in the flow variation range.
The overall variation of the permeability coefficient
changes greatly, which is an order of magnitude
higher. The permeability coefficient gradually
increases with the increase of the seepage pressure,
because the seepage flow directly affects the seepage
pressure.
The faster the rate of change in osmotic
pressure, the faster the rate of change in penetration
force and the increased ability to influence the
skeletal structure of the soil particles, resulting in
better pore connectivity.
Table 4: Effect of seepage flux on permeability coefficient.
number
Initial
void
ratio
Confine-
ng
pressure
(kPa)
Seepage
flow
(ml/m-
in)
Principal
stress
differen-
ce
(kPa)
Permeabili-
ty
coefficient
(cm/s)
HLL5 1.0 70 0.02 0 8.34E-07
HLL6 1.0 70 0.04 0 1.25E-06
HLL7 1.0 70 0.06 0 1.96E-06
HLL8 1.0 70 0.08 0 2.97E-06
Figure 3: Relationship between seepage flux and per-
meability coefficient.
4.3 Influence of Confining Pressure on
Permeability Coefficient
Triaxial seepage shear tests of remodeled soils under
different confining pressure conditions were
conducted according to the test protocol, and the
obtained permeability coefficients are shown in Table
5, and the relationship between the permeability
coefficient and the change of confining pressure is
shown in Figure 4.
According to the data in Fig. 4 and table 5, when
the pore ratio, seepage flow and principal stress are
the same and the confining pressure is in the range of
70kpa-220kpa, the permeability coefficient decreases
with the increase of confining pressure. When the
confining pressure changes from 70kpa to 220kpa,
the corresponding permeability coefficient decreases
from 8.34E-07cm/s to 9.66E-08cm/s, and the
downward trend gradually slows down.
In the seepage test, an increase in confining
pressure can restrict the evolution of seepage
channels, shrink soil pores, boost soil compactness,
and weaken soil permeability.
Confining pressure's
capacity to alter the internal particle skeleton
structure of soil during consolidation is waning as it
increases.
The pore space is already quite small due
to the addition of some confining pressure, thus it is
challenging to further shrink the vacuum by raising
the confining pressure.
Table 5: Effect of confining pressure on permeability co-
efficient.
number
Initial
void
ratio
Confine-ng
pressure
(kPa)
Seepage
flow
(ml/m-
in)
Principal
stress
differen-ce
(kPa)
Permeabili-ty
coefficient
(cm/s)
HLL9
1.0 70 0.02 0 8.34E-07
HLL10
1.0 120 0.02 0 3.54E-07
HLL11
1.0 170 0.02 0 1.38E-07
HLL12
1.0 220 0.02 0 9.66E-08
Figure 4: Relationship between confining pressure and
permeability coefficient.
ISWEE 2022 - International Symposium on Water, Ecology and Environment
172
4.4 Influence of Principal Stress
Difference on Permeability
Coefficient
Triaxial seepage shear tests of remodeled soils under
different principal stress differences were conducted
according to the test protocol, and the obtained
permeability coefficients are shown in Table 6, and
the variation of permeability coefficients with
principal stress is shown in Fig. 5.
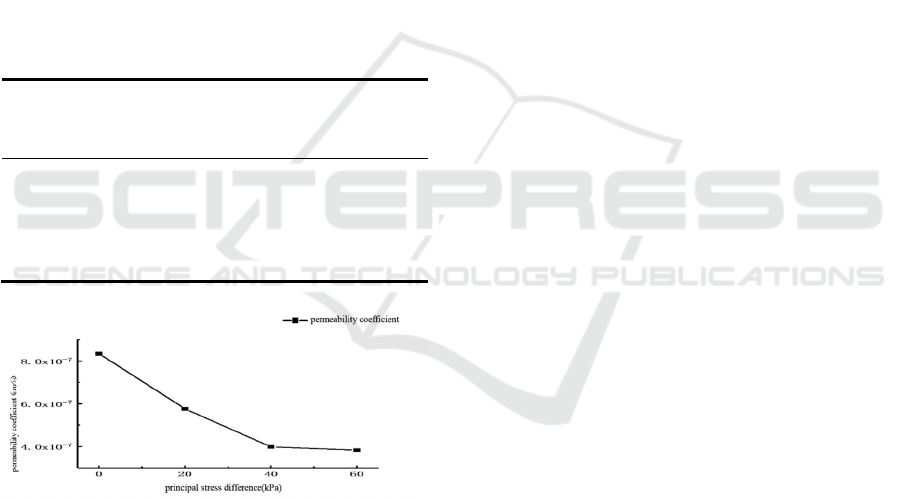
The data in Figure 5 and Table 6 show that, in tests
with the same pore ratio, seepage flow rate, and
confining pressure, the permeability coefficient drops
as the main stress differential increases.
The main
stress difference varies from 0 kPa to 60 kPa, and the
corresponding permeability coefficient decreases
from 8.34E-07cm/s to 3.38E-07cm/s, which is a small
range of permeability coefficient reduction.
Table 6: Effect of principal stress difference on permea-
bility coefficient.
number
Initial
void
ratio
Confine-
ng
pressure
(kPa)
Seepage
flow
(ml/m-
in)
Principal
stress
differen-
ce
(kPa)
Permeabili-
ty
coefficient
(cm/s)
HLL13
1.0 70 0.02 0 8.34E-07
HLL14
1.0 70 0.02 20 5.76E-07
HLL15
1.0 70 0.02 40 3.98E-07
HLL16
1.0 70 0.02 60 3.83E-07
Figure 5: Relationship between principal stress difference
and permeability coefficient.
On the one hand the applied principal stress
difference increases the vertical pressure on the soil
sample, and there will be less pore space after vertical
consolidation. On the other hand, the principal stress
difference may lead to local deformation of the soil,
and the cross-sectional area of seepage will increase.
The larger the principal stress difference is, the more
obvious the effect from local deformation will be and
the larger the area of seepage cross-section will be.
Therefore, the permeability coefficient decreases
with the increase of the principal stress difference.
5 CONCLUSIONS
(1) The permeability coefficient steadily rises as
the initial pore ratio rises, and the final growth trend
of the permeability coefficient slows down. The
larger the pore ratio, the better the connectivity of the
seepage pores, and the larger the contact surface
between the seepage water and the particles around
the pores. With the gradual increase of the seepage
force, the directional seepage force promotes the
orderly arrangement of particles, and the more
orderly pore channels can also make the penetration
more smooth.
(2) The permeability coefficient progressively rises
as the seepage flow rate rises, and the trend of rising
permeability coefficient quickens. Permeability
pressure is directly influenced by the size of the
seepage flow. The greater the rate of change in
permeability pressure, the greater the rate of change
in permeability, and the greater the ability to modify
the skeletal structure of soil particles, resulting in
improved pore connectivity.
(3) The permeability coefficient steadily drops as
confining pressure rises, and the rate at which it is
falling slows down. In the seepage test, an increase in
confining pressure can restrict the evolution of
seepage channels, shrink soil pores, boost soil
compactness, and weaken soil permeability.
Confining pressure's capacity to alter the internal
particle skeleton structure of soil during consolidation
is waning as it increases. The key point is that its
pores are already quite small when the confining
pressure is increased to a certain degree. It is
challenging to minimize the pores, even while the
confining pressure rises.
(4) The permeability coefficient steadily declines
as the major stress rises, and this decline trend
becomes slower. On the one hand, the application of
the primary stress difference will result in an increase
in the soil sample's vertical pressure ,and the pores for
vertical consolidation will be less. On the other hand,
applying the primary stress difference can cause
localized soil deformation and expand the seepage's
cross-sectional area. The influence of local
deformation is more visible and the region of seepage
cross-section is bigger as the major stress differential
increases. As a result, the permeability coefficient
similarly falls as the primary stress difference
increases.
Experimental Study on the Influence of Permeability Coefficient of Granite Residual Soil
173

ACKNOWLEDGEMENTS
The authors would like to acknowledge financial
support from the Natural Science Foundation of
Xiamen city. Audit number of Xiamen Natural
Science Foundation: 3502Z20227323.
REFERENCES
Liao,H.J., Sheng,Q., Gao,S.H., and Xu,Z.P. (2005).
Influence of drawdown of reservoir water level on
landslide stability. Chinese Journal of Rock Mechanics
and Engineering, 24(19):3454-3458.
Lu,Y.L. (2018). Analysis of slope stability based on
seepage and earthquake. Recent Developments in World
Seismology, 11:43-44.
Yan,F.F., Huang,L.C., Zhou,Q.K., and Deng L.J. (2019).
Stability analysis of deep foundation pit slope
considering rainfall impact. Port
&
Waterway
Engineering, 3:24-29.
Shi,Z.M., Shen,D.Y., Peng,M., Zhang Lulu, Zhang,F.W.,
and Zheng,X.Z. (2016). Slope stability analysis by
considering rainfall infiltration in multi-layered
unsaturated soils. Journal of Hydraulic Engineering,
47(08):977-985.
Liu,C.H, Chen,C.X., and Feng,X.T. (2005). Study on
mechanism of slope instability due to reservoir water
level rise. Rock and Soil Mechanics, 05:769-773.
Liu,C.H, Chen,C.X., Feng,X.T., and Xiao,G.F. (2005).
Effect of groundwater on stability of slopes at reservoir
bank. Rock and Soil Mechanics, 03:419-422.
Ma,M.X., Ou,F.H., Chen,Y., Wang,L., Zhou,M.K., and
Yin,K.Y. (2018). Analysis of the inflece of water level
change speed on the stability of expansive rock
slope.Sichuan Building Materials, 44(05):70-72.
ISWEE 2022 - International Symposium on Water, Ecology and Environment
174
