
The Impacts of Sand Mining on Water Quality: A South African
Perspective
Asabonga Mngeni
a
Department of Biological and Environmental Sciences, Faculty of Natural Sciences, Walter Sisulu University, South Africa
Keywords: Sand Mining, River, Water Quality, Upstream, Downstream.
Abstract: Sand mining is a common practice in many rivers and flood plains in South Africa. As a result of population
growth, economic development, and infrastructural development, the demand of sand continues to rise. The
aim of this study was to determine how sand mining affects water quality. The impact of sand mining on
water quality was determined by comparing turbidity, pH, electrical conductivity, and temperature in three
sampling sites (upstream, adjacent, and downstream). In addition, we determined if sand extracted using the
manual method affects the four water parameters the same way they are affected by the tractor-loader-backhoe.
These water parameters were measured in five rivers in the Eastern Cape Province (Tsembeyi, Thina, Gaduka,
Somerville, and Nomhala). The results showed that sand mining affects turbidity, with greater turbidity in the
adjacent sampling sites that the upstream sampling sites. The variation in turbidity can be due to sand extract
suspending solid particles in the water column. On the other hand, pH values in adjacent sampling sites
increased noticeably. The results revealed that the sand extraction method affects electrical conductivity, with
higher electrical conductivity when using the mechanical (tractor-loader-backhoe) method than the manual
method. The difference in electrical conductivity can be explained by the fact that generally turbidity and
electrical conductivity have a positive correlation. Even though other water parameters such as temperature
and pH were not affected by sand mining, results showed that sand mining affects water quality in terms of
turbidity and electrical conductivity.
1 INTRODUCTION
Surface water can be found in the form of streams,
wetlands, ditches, ponds, or lakes near or at sand
mining activities, and Orr and Krumenacher (2015)
argue that water from mining sites is likely to seep
lower into the groundwater. Ground water, on the
other hand, is regarded as a safe source of fresh
drinking water. According to Orr and Krumenacher
(2015), sand mining has a negative impact on surface
water when untreated storm water is released directly
into bodies of water. Furthermore, previous studies
have demonstrated that sand mining alters sediment
deposits in drainage networks, causing turbidity
levels to differ among upstream, adjacent to, and
downstream of sand mining sites (Lekomo et al.
2021; Okeke et al. 2019). This disparity in turbidity
levels could be related to increased riverbed and bank
erosion, which raises suspended particles in the water
at mining sites and downstream (Lekomo et al. 2021).
a
https://orcid.org/ 0000-0001-5201-7400
The rise in suspended solids has a deleterious
influence on flora and fauna (Kale, 2016). Turbidity,
for example, is a key cause of biological stress
because it is a source of abnormally large amounts of
organic material and nutrients (Kale, 2016).
Furthermore, the reintroduction of harmful
compounds caused by sand mining activities lowers
the oxygen levels in water, and therefore increases the
demand for oxygen amongst animals (Kale, 2016).
Sand mining affects not just turbidity but also
temperature. For example, it has been discovered that
when sand mining activities result in soil erosion and
deforestation, temperature levels rise (Kale, 2016).
Changes in temperature have an impact on
photosynthetic activity, gas diffusion rates, and the
amount of oxygen that can be dissolved in water
(Kale, 2016). According to Kawa et al. (2016)
temperature is essential because it affects water
chemistry, chemical reactions, for example, tend to
accelerate at high temperatures. High water
156
Mngeni, A.
The Impacts of Sand Mining on Water Quality: A South African Perspective.
DOI: 10.5220/0011950900003536
In Proceedings of the 3rd International Symposium on Water, Ecology and Environment (ISWEE 2022), pages 156-161
ISBN: 978-989-758-639-2; ISSN: 2975-9439
Copyright
c
2023 by SCITEPRESS – Science and Technology Publications, Lda. Under CC license (CC BY-NC-ND 4.0)

temperatures can dissolve minerals from rocks,
resulting in increased electrical conductivity (Kale,
2016). Furthermore, temperature influences
biological activities and growth, as well as the types
of organisms that can dwell in water bodies (Kawa et
al. 2016)
According to Kale (2016) water temperature is
likely to be altered by air temperature, quantity of
shadow, and soil erosion, which increases the amount
of sediments in a water body. The solubility of
dissolved oxygen is affected by water temperature; in
cold water, more gases can be dissolved than in warm
water. High water temperatures can boost the
photosynthetic rate of aquatic plants and algae,
resulting in increased plant growth, and algal blooms,
which can lead to eutrophication and severely impact
water biodiversity (Kale, 2016). Furthermore, Kale
(2016) found that extremely cold or extremely warm
temperatures in water raise stress levels in aquatic
creatures.
Because temperature impacts coagulation,
turbidity is similarly tied to temperature. Coagulation
efficiency is affected by temperature, and the optimal
pH for coagulation decreases, as temperature levels
rise (Kale, 2016). Furthermore, corrosion is a
function of the dissolved oxygen content in water, as
oxygen solubility decreases, temperature levels rise.
When compared to the bigger change in corrosion
rates, the change in dissolved oxygen with
temperature is negligible. Warm water carries less
dissolved oxygen than cool water, and aquatic
animals may not be able to survive without it (Kale,
2016).
Enough dissolved oxygen, relatively low organic
content, a pH value around neutral, moderate
temperature, and water free of infectious agents,
poisonous compounds, and mineral debris are all
desirable qualities of water quality (Oluyemi et al.
2010; Singh and Mosley, 2003). Microorganisms that
might cause diseases and chemical substances that are
hazardous to one's health should not be present in
portable water. Previous studies have looked at how
sand mining affects variables like turbidity,
temperature, pH, turbidity, dissolved oxygen, and
electrical conductivity (Mwanzia et al. 2018; Ashraf
et al., 2011; Okeke et al., 2019; Lekomo et al., 2021).
However, sand mining is practiced using a different
method, and there is little that is known about how
different methods affect water quality. As a result, the
aim of this research was to determine the impacts of
sand mining on water quality. The impact of sand
mining on water quality was determined by
comparing turbidity, pH, electrical conductivity, and
temperature in three sampling sites (upstream,
adjacent, and downstream). In addition, the study
determined if sand extracted using the manual method
affects the four water parameters (turbidity, pH,
electrical conductivity, and temperature) the same
way they are affected by the tractor-loader-backhoe
(TLB).
2 MATERIALS AND METHODS
The study was conducted in five sand mining sites
(rivers) which are Somerville (Maclear), Thina
(Mount Frere), Tsembeyi (Lady Frere), Nomhala
(Tsolo), and Gaduka (Mthatha) across the Eastern
Cape Province, South Africa. In all the mining sites
the area of sand extraction is riverbanks. The chosen
mining sites use different methods of extracting sand.
At Somerville and Tsembeyi sand is extracted using
the manual sand extraction methods, such as, spade,
cart and shovel. However, at Thina, Gaduka and
Nomhala the sand is extracted using the tractor-
loader-backhoe (TLB) sand extraction method.
2.1 Sampling Design
This study adopted quantitative research design. Van
der Merwe (1996) defined quantitative research as an
approach to study that aims to test hypotheses,
establish facts, show correlations between variables,
and forecast results. Methods from the natural
sciences are used in quantitative research to assure
objectivity, generalizability, and reliability. Water
samples were collected between May 2018 and
October 2018 which is the dry season. This period
was chosen given that it is the time when sand
extraction is done the most. There is high extraction
of sand during this period because of several reasons,
such as, the new financial year for the government to
issue tenders in the construction industry, low-income
people build their houses when it is dry to avoid
delays and constant demolishing of structures by
heavy rainfall amongst others. A total of 120 samples
were drawn from the five different rivers with each
river having three sampling sites (upstream of mining
sites, adjacent to mining sites and downstream of
mining sites). In each sampling site, (upstream,
adjacent and downstream) there were eight sub-sites,
and a single sample was drawn from each of those
sub-sites, making a total of eight samples in each
sampling site and 24 samples in each river. All the
eight sampling sites were >1 m apart. The upstream
of the mining sites, adjacent to mining sites and
downstream sites were >200 m apart.
The Impacts of Sand Mining on Water Quality: A South African Perspective
157

In each subsite, water parameters, including, pH,
electrical conductivity and temperature were
measured using Hanna Multiprobe parameter
whereas turbidity was measured using Hanna
Turbidity meter.
2.2 Data Analyses
The effect of sand mining on different water
parameters (electrical conductivity, pH, turbidity, and
temperature) was analysed in R using the generalized
linear mixed models (GLMMs) because data were not
normally distributed. The Shapiro-Wilk test was used
to test if data were normally distributed or not. The
lme4 package (Bates et al. 2015) was used when
calculating GLMMs. Analyses were performed for
each of the four water parameters. The Poisson
distribution was the best fit for electrical
conductivity, pH and temperature datasets, the
negative binomial distribution was used for the
turbidity dataset (Bolker et al. 2009). There were two
fixed factors (sampling sites and method of extracting
sand) and one random factor (river) in the models.
The multcomp package (Horthorn et al. 2008) was
used to determine the differences between paired
sampling sites (upstream, adjacent to sampling sites
and downstream) for water parameters that showed
significant differences in the main results.
3 PRESENTATIONS OF
RESULTS
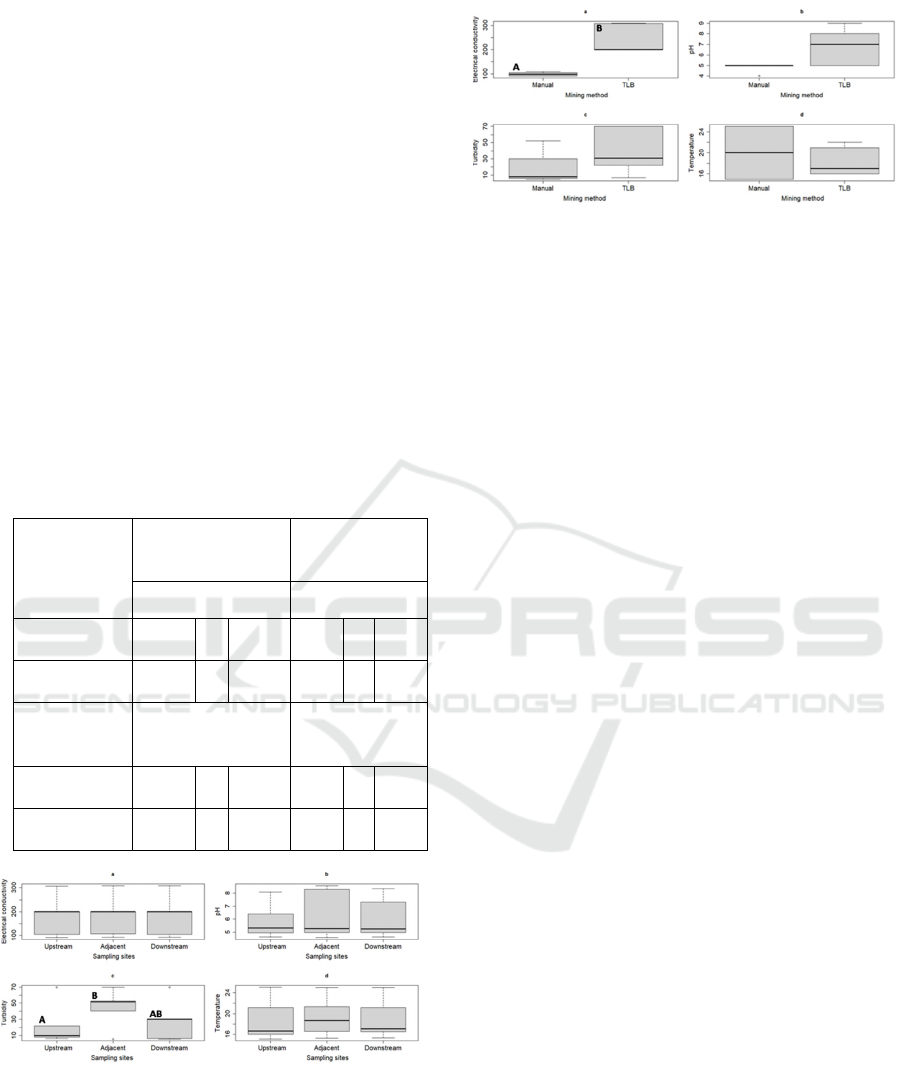
Electrical conductivity, pH and temperature did not
differ among different sampling sites of the river
(Table 1; Figures 1a, b, d). However, there was
significantly higher turbidity in the sampling site
adjacent to sand mining sites compared to the
upstream of sand mining sites (p = 0.002; Figure 1c).
Although not significantly different, the turbidity in
the sampling site adjacent to sand mining sites was
slightly higher than that in the downstream sampling
site (p = 0.052; Figure 1c). Turbidity in the upstream
and downstream sampling sites did not differ (p =
0.55; Figure 1c).
The method of extracting sand affected the electrical
conductivity only, with greater electrical conductivity
when using the tractor-loader-backhoe compared to
the manual method (Table 1; Figure 2a). Even
though, the method of sand extraction did not
significantly affect the pH and the turbidity, the
tractor-loader-backhoe had slightly higher levels of
the pH and turbidity compared to the manual method
(Table 1; Figures 2b, c). The temperature was not
affected by the method of extracting sand, even
though the rivers that used the manual method had
slightly higher temperature, than those that use the
track-loader-backhoe method (Table 1; Figure 2d).
4 DISCUSSIONS
Effect of sand mining on electrical conductivity
focusing on sampling sites.
When electrical conductivity of sampling sites
adjacent to the sand mining site was compared to that
in the upstream and downstream sampling sites, there
were no statistically significant differences. These
results agree with previous studies (Mwanzia et al.
2018; Mwanzia, 2019; Obot et al. 2019; Yen and
Rohasliney, 2013). Similarities in electrical
conductivity across sampling sites could be since
electrical conductivity is a measure of total dissolved
substitution in water, which varies with geological
structure, rainfall, and temperature (Bai et al, 2013;
Yilmaz and Koc, 2014). The fact that the study was
done during dry season, when there was no rainfall,
may explain the observed similarities in electrical
conductivity of upstream, adjacent to sand mining
sites, and downstream sampling sites. However, other
studies discovered that electrical conductivity vary
dramatically from upstream to downstream
(Bhattacharya, 2018; Lekomo et al. 2021; Okeke et
al. 2019). Furthermore, these studies suggested
differences in electrical conductivity between
upstream and downstream sampling sites are since
sand extraction is a source of dissolved ion
precipitation in the water (Bhattacharya, 2018;
Lekomo et al. 2021; Okeke et al. 2019). However, it
is worth noting that the afore mentioned authors
conducted their studies during different seasons,
including the rainy season (Bhattacharya, 2018;
Lekomo et al. 2021; Okeke et al. 2019). As such, the
contrast between our study and these previous studies
could be since our study was conducted during the dry
season, therefore the capacity of rainfall to affect
electrical conductivity was not considered.
Effect of sand mining on pH focusing on sampling
sites
The pH of water is used to determine the amount of
hydrogen present, which is controlled by chemical
reactions and the ion balance (Viera et al. 2020). This
study supports previous studies, which found
similarities of the pH values among the adjacent,
upstream, and downstream sampling sites (Mwanzia,
2019; Mwanzia et al. 2018; Obot et al. 2019; Yen and
Rahasliney, 2013). The identical pH levels between
ISWEE 2022 - International Symposium on Water, Ecology and Environment
158

adjacent, upstream, and downstream sampling sites
could be explained by the lack of harmful pollutants.
According to Singh and Gupta (2016) pollution from
diffuse sources is a non-point source of pollution.
Agricultural or storm water runoff, as well as debris
blown into waterways from land, are examples. There
was no obvious contamination (point sources) near
the sand mining sites. Wastewater, also known as
effluent, released legally or illegally by a company,
oil refinery, or water treatment facility, as well as
contamination from leaking septic systems, chemical
and oil spills, and illegal dumping, are all common
point sources of pollution in rivers (Singh and Gupta,
2016). The pH of water in a stream, river, lake, or
underground flow changes depending on the source
of the water, the kind of soil, bedrock, and
contaminants encountered along the route (Kale,
2016). Even though, the study found no statistically
significant differences between the sampling sites,
there is a slight increase in pH values at adjacent
sampling sites (Figure 1b), indicating that sand
mining has the potential of increasing the pH. On the
other hand, the study findings, contradict those of
(Gebreyohannes et al. 2015; Okeke et al. 2019) who
reported significant results among upstream,
adjacent, and downstream sampling sites. The
differences could be explained by the number of
reasons such as oil leak from the TLB used for sand
extraction which possess oil as a determining factor
for pH as alluded by (Singh and Gupta, 2016).
Effect of sand mining on temperature focusing on
sampling sites
Temperature oscillations in natural water bodies are
induced by a range of activities that cause daily and
seasonal changes in surface water. For example,
turbidity usually causes a rise in water temperature
due to heat absorption produced by suspended
particles (Kumar, 2015). Additionally, during
mechanical mining, equipment, such as, tractor-
loader-backhoe (TLB) heats up, resulting in higher
water temperatures. Furthermore, the magnitude and
time spent by TLB on the water column can be linked
to the lack of variance in water temperature. In
addition, previous studies have indicated significant
differences in temperature between upstream and
downstream mining sites and these differences in
temperature were because of heating up of mining
equipment (Okeke et al. 2019; Koehnken and Rintoul,
2018). However, in our study the temperature did not
differ among the three sampling sites (upstream,
adjacent to and downstream of sand mining site),
supporting previous studies (Mwanzia, 2019;
Mwanzia et al. 2018; Obot et al. 2019; Yen and
Rohaslineys, 2013).
Effect of sand mining on turbidity focusing on
sampling sites
The study found that the adjacent sampling sites,
which is near where sand mining is taking place, had
higher turbidity than the upstream sampling site,
which is upstream of sand mining. Increased turbidity
is normally caused by resuspension of sediment,
sedimentation due to stockpiling and dumping of
excess mining material (Ashraf et al. 2011). These
higher levels of turbidity in the adjacent sampling
sites were expected as these sampling sites are very
close to where sand mining occurs. The study
findings are consistent with previous studies, which
found that adjacent sampling site produced
statistically significant turbidity results when
compared to upstream sampling site (Bhattacharya,
2018; Bhattacharya et al. 2019; Koehnken and
Rintoul, 2018; Mwanzia et al. 2018; Okeke et al.
2019; Yen and Rohasliney, 2014).
Although not statistically significant, the turbidity
was slightly greater in the adjacent sampling sites
than in the downstream sampling site. This is most
likely owing to the river's natural desire to clean itself,
causing solid particles to settle, thus the low turbidity
in the downstream sampling sites. Furthermore,
Ashraf et al. (2011) reported that turbidity decreases
with distance downstream. In addition, Okeke et al.
(2019) found that turbidity differs significantly
between adjacent and downstream sampling site.
Even though the downstream sampling site had
slightly higher values than the upstream sampling site
(Figure 1c), the analysis found no significant
differences. The slightly higher turbidity values in
downstream sampling site than upstream sampling
sites could be attributed to sand mining after-effects.
These findings are in contrast with those of Okeke et
al. (2019), who discovered significant differences in
turbidity between upstream and downstream
sampling sites.
Effect of the method of extracting sand on water
quality
According to Padmalal and Maya (2014) mining for
river sand is done both manually and mechanically.
Manual mining is less harmful to the environment,
and the amount of mining is often low. In manual
mining, a simple equipment, such as, spades, shovels,
and carts are utilized, whereas in mechanical mining,
heavy machines, such as, power jet pumps and
tractor-loader-backhoe (TLB) are used. When
The Impacts of Sand Mining on Water Quality: A South African Perspective
159
comparing mechanical (TLB) and manual extraction
methods, the study found that TLB had a significantly
electrical conductivity than manual extraction. This
may be due to the elevated turbidity values in the
adjacent sampling site (Figure 1c). According to Aris
et al. (2014), electrical conductivity has a positive
correlation with turbidity (r = 0.765). It is worth
noting that using TLB in sand extraction raises solid
particles, which raises turbidity. However, the
turbidity together with pH and temperature were not
significantly influenced by the method of sand
extraction methods. Similarities between the manual
and machinery methods are contrary to our
expectations where temperature was expected to be
influenced using TLB given that TLB heats up and
result in higher water temperature. The amount of
time the TLB spends in the water column, the velocity
of the stream, and the amount of water in the rivers
could all explain the lack of higher water
temperatures.
Table 1: Effect of the sand mining on water parameters.
Electrical
Conductivity
pH
χ2 df p χ2 df P
Sampling
sites
0.06 2 0.97 1.04 4 0.59
Method of
extraction
10.09 1 0.001 2.80 1 0.09
Turbidity
χ
2 df P
Temperature
χ
2 df P
Sampling
sites
11.93 2 0.003 0.42 2 0.81
Method of
extraction
1.57 1 0.21 0.15 1 0.69
Figure 1: Effect of sand mining on water parameters (a -
electrical conductivity, b - pH, c - turbidity and d -
temperature) in three sampling sites; upstream of the
mining site, adjacent to the mining site and downstream of
the mining site. Letters above boxplots in turbidity indicate
significant differences (p < 0.05) among sampling sites.
Figure 2: Effect of the method of extracting sand on a)
electrical conductivity, b) pH, c) turbidity and d)
temperature. Letters above and inside boxplots in electrical
conductivity indicate significant differences (p < 0.05)
between the methods.
5 CONCLUSIONS
This study showed that the impact of sand mining is
dependent on the water parameter measured. For
example, sand mining across the sampling sites in the
five rivers in the Eastern Cape Province influenced
water turbidity, while not affecting the electrical
conductivity, pH and temperature. On the other hand,
the electrical conductivity was significantly
influenced by the sand extraction method, while pH,
temperature and turbidity were not affected. If sand
extraction continues without proper control, sand
extraction might lead to irreversible destruction of the
ecosystem and subsequent biodiversity loss. Lastly, it
is important to encourage sustainable resource use,
law enforcement, regulation of sand mining activity
and adopt negative impact minimisation strategies.
ACKNOWLEDGEMENTS
I would also like to thank National Research
Foundation for financing the study.
REFERENCES
Moore, R., Lopes, J., 1999. Paper templates. In
TEMPLATE’06, 1st International Conference on
Template Production. SCITEPRESS.
Smith, J., 1998. The book, The publishing company.
London, 2
nd
edition.
Aris, A.Z. Lim, W.Y. Praveena, S.M. Yusoff, M.K. Ramli,
M.F. and Juahir, H. (2014). Water quality status of
selected rivers in Kota Marudu Sabah Malaysisa and its
suitability for ssage. Sains Malaysiana. Vol. 43 (3).
Ashraff, M.A. Maah, M.J. Yusoff, I. Wajid, A and
Mahmood, K. (2011). Sand mining effects, causes and
ISWEE 2022 - International Symposium on Water, Ecology and Environment
160

concerns: a case study from Bestari Jaya, Selangar,
Peninsular Malaysia. Scientifc Research and Essays
Vol. 6(6).
Bai, W. Kong, L. and Guo, A. (2013). Effects of physical
properties on electrical conductivity of compacted
lateric soil. Journal of rock mechanics and Geotechnical
Engineering. Vol 5. 4060411.
Bates, D. Mächler M, Bolker MB, Walker SC (2015).
Fitting linear mixed-effects models using the lme4. J
Stat Softw 67:1 – 48. doi:10.18637/jss. v067.i01
Bhattacharya, R.K. (2018). Instream sand mining impact on
water quality and benthos community in an alluvial
reach: A case study on river kang sabati, west bengal.
international journal of current research in life sciences.
Vol. 7(8).
Bhattacharya, R.K. Chatterjee, N.D. and Dolui, G. (2019).
Consequences of sand mining on water quality and
instream biota in alluvial stream: a case-specific study
in South Bengal River, India. Sustainable water
resources management. Vol. 5.
Bolker, B.M, Brooks ME, Clark CJ, Geange SW, Poulsen
JR, Stevens MHH, White JSS. Generalized linear
mixed models: a practical guide for ecology and
evolution. Trends Ecol Evol. 2009; 24: 127-135.
Gebreyohannes, F. Gebrekiolan, A. Hadera, A. and
Estifanos,S. (2015). Investigations of physico-chemical
parameters and its pollution implications of elala river,
mekelle, tringray, ethiopia, momona. Ethiopian Journal
of Science. Vol. 7 (2).
Hothorn, T. Bretz, F. Westfall, P. (2008). Simultaneous
inference in general parametric models. Biomed J.
2008; 50: 346-363.
Kale, V.S. (2016). Consequence of temperature, pH,
turbidity, and dissolved oxygen in water quality
parameters. International Advanced Research Journal
in Science, engineering, and Technology. Vol. 3(8).
Kawa, Y.K. Kaissam, J.P, Moiwo, J.P and Kabia, V.
(2016). Physico, chemical and bacterial analysis of
drinking water: Kakua Chiefdom, BO district, Sierra
Leone. International Journal of Water Resources and
Environmental Engineering. Vol. 8(1), pp 11-23.
Koehnken, L and Rintoul, M. (2018). Impacts of sand
mining on ecosystem structure, proces and biodiversity
in rivers. WWF.
Kumar, G. (2015). Impact of coal mining on water quality.
Bachelor of technology in mining engineering.
Department of mining Engineering. National institute
of technology.
Lekomo, Y.K. Ekengove, C.M. Davola, A. Lele, R.F. Suh,
G.C. Obiri, S. and Dongmo, A.K. (2021). Assessing
impacts of sand mining on water quality in Tsoutsang
locality and design of wastewater purification system.
Cleaner Engineering and Technology Vol.2.
Mwanzia, T.N. (2019). Effects of sand harvesting on water
quality in river thwake machakos county, Kenya.
Master’s thesis. Kenyata University.
Mwanzia, T.N. Gathuru, G. and kituru, E. (2018). Physico-
chemical effects of sand harvesting on water quality in
river Thwake Machakos County, Kenya. International
Journal of Scientific and Research Publication. Vol. 8
(9).
Obot, O.I. Ekpo, I.F. and David, G.S. (2019). The effects of
sand mining on physico-chemical paramaters of ikot
ekpan river, Akwa Ibom Estate Nigeria. Journal of
Quatic Science and Marine Biology. Vol. 2 (4).
Okeke, P.N. Anyawu, J.C. and Adenta, V.I. (2019). Impact
of sand mining on water quality and bank morphology
of Ontamiri river in Owerri Nigeria. International
Journal of Advanced Research in Science, Engineering
and Technology. Vol. 6 (1).
Oluyemi, E.A. Adekunle, A.S. Adenuga, A.A. and
Makinde, W.O. (2010). Physico-chemical properties
and heavy mdetal content of water sources in Ife North
local Government area of Osun State, Nigeria. African
Journl of Environmental Science and Technology. Vol.
4 (10), pp 691-697.
Orr, I and Krumenacher, M. (2015). Environmental impacts
of industrial silica sand (frac sand) mining. Policy
Study. The Heartland Institute.
Padmalal, D. and Maya, K. (2014). Sand mining:
environmental impacts and selected case studies.
Springer. New York.
Singh, M.R and Gupta, A. (2016). Water pollution-sources,
effects and control. Pointer publishers Jaipur.
Singh, S and Mosley, L.M. (2003). Trace metal levels in
drinking water on Viti Leve, Fiji Islands. The South
Pacific Journal of Natural and Applied Sciences. Vol 21
(1). DOI 1071/SP03006.
Van der Merwe, H. (1996). The research process: Problem
statement and research design, pg. 278- 291. In Garbers,
J.G. (Ed.). Effective research in the human sciences.
Pretoria: J.L.Van Schaik.
Viera, I.F.B. Neto, F.C.R. Carvalho, M.N. Caldos, A.M.
Costa, R.C.A. da Silva, K.S. Parahyba, R.D.V. Pacheo,
F.A.L. Fernandes, L.F.S and Pissarra, T.C.T. (2020).
Water security of groundwater quality in an anthtopized
rural area from the athlantic forest biome in Brazil.
Water. Vol. 12.
Yen, T.P. and Rohasline, H. (2013). Status of water quality
subject to sand mining in the kelantan river, Kelantan.
Tropical Life Sciences Research. Vol. 24 (1).
Yilmaz, E and Koc, C. (2014). Physical and chemical
evaluation for the water quality criteria in a farm on
Akcay. Journal of Water Resources and Protection.
Vol. 6.
The Impacts of Sand Mining on Water Quality: A South African Perspective
161
