
Application of a Model Based on Demand Forecasting, ABC
Classification and EOQ in a Gastronomic SME to Improve Inventory
Turnover: Case Study in Peru
Bryan Anthony Cuba Paz
*a
, Piero Enrique Bazan Cabezas
†b
and Alberto Flores-Perez
c
Facultad de Ingenieria y Arquitectura, Universidad de Lima, Lima, Peru
Keywords: ABC Classification, EOQ, Demand Forecasting, Restaurant, Inventory, Small and Medium Enterprise.
Abstract: The Small and Medium Enterprise (SME) and gastronomic sector suffered a great negative impact due to the
crisis caused by the pandemic, resulting in the search for solutions to minimize costs internally in order to
survive the changes of the new economic environment. Therefore, the application of a methodology consisting
of demand forecasting, ABC classification and EOQ was proposed to improve inventory turnover in this
sector. Several research articles were reviewed, from which the success cases and their methodologies to solve
the problem were interpreted. In this case the main problem is the low inventory turnover due to inefficient
demand forecasting, inadequate planning of purchases of inputs and poor prioritization of these, which
generated losses to the SME studied. For the validation of the contribution, the Arena simulator was used,
showing a turnover similar to that of the case study and giving positive results after the application of the
contribution, empirically, improving the proposed indicators, such as; the variation of times of purchase of
inputs, which increased by 8.57%, the average inventory, which decreased by 22.67%, the level of service,
which improved by 5.29% and the main indicator, the inventory turnover, which improved by 40.02%.
1 INTRODUCTION
The economic crisis generated by the last pandemic
affected all companies regardless of their size and
sector, which caused them to make changes in their
different business strategies in order to reduce their
expenses, survive and adapt to changes in the
economic environment (Giles, 2020). In Peru, this
crisis seriously affected the SME sector, where they
presented a 59.2% decrease in annual sales with
respect to what was reported in 2019, registering the
lowest value in recent years, resulting in 60,489
million PEN, equivalent to 8% of the Peruvian gross
domestic product (GDP) in the year under study
(Confederación Nacional de Instituciones
Empresariales Privadas [CONFIEP], 2021). The
participation of this sector has been quantitatively
important within the Peruvian business sector, since
it has maintained a participation of over 92.7% over
the last few years.
a
https://orcid.org/0000-0002-6301-6224
b
https://orcid.org/0000-0002-3204-2366
c
https://orcid.org/0000-0003-0813-0662
One of the most important sectors within the
Peruvian Small and Medium Enterprises (SMEs) is
the gastronomic sector, which, until before the
pandemic, 2019, represented 3.2% of the total
Peruvian GDP, and although it has suffered a fall of
30.6%, this has been increasing since the beginning
of 2021 (Sociedad de Comercio Exterior del Peru
[COMEXPERU], 2022). Such is the importance of
this sector that the Peruvian government made
proposals for economic reactivation in the restaurant
sector, where facilities were provided for the use of
own or third party delivery, which led to a different
behavior than usual, due to the constant variation in
production (COMEXPERU, 2021).
Therefore, the key problem of the case study is the
company's capacity to possess the necessary inputs
for the preparation of the dishes, since, being an
atypical situation, it generated losses of inputs due to
poor storage, overstocking of inputs with low
demand, stock breakage of the most relevant inputs,
as well as inadequate inventory control and
434
Cuba Paz, B., Bazan Cabezas, P. and Flores-Perez, A.
Application of a Model Based on Demand Forecasting, ABC Classification and EOQ in a Gastronomic SME to Improve Inventory Turnover: Case Study in Peru.
DOI: 10.5220/0011950400003612
In Proceedings of the 3rd International Symposium on Automation, Information and Computing (ISAIC 2022), pages 434-439
ISBN: 978-989-758-622-4; ISSN: 2975-9463
Copyright © 2023 by SCITEPRESS – Science and Technology Publications, Lda. Under CC license (CC BY-NC-ND 4.0)

purchasing management procedures. In addition, the
inadequate management of the company's inventory,
regardless of its size, drastically affects its annual
revenue (Villón, 2021). This affects directly with the
level of satisfaction provided to customers, since the
requested order cannot be delivered, therefore, the
perceived income is diminished. Therefore, to
analyse the results of the model, indicators such as
inventory turnover, average inventory, service level
and variation in the quantity of input purchases were
proposed. In addition, a correct control of
merchandise will generate a positive impact on the
growth and liquidity of the cash flow of companies,
since inventories are considered a key factor in the
competitiveness factors that every company,
including SMEs, must manage (Serna et al., 2018). In
this sense, several authors have appeared who sought
to solve this problem.
On the one hand, in one of the papers studied, the
inventory management of a Cuban commercial chain
classified its products based on the ABC tool and
analysed historical data to obtain a demand forecast,
since the company did not have an efficient
management model to generate orders (Bofill et al.,
2017). In addition, it uses the EOQ system to obtain
the order quantity while minimizing warehouse costs.
It ends up with a remarkable improvement in the
service level and a better utilization of the products in
the warehouse. On the other hand, in a footwear
trading company, the use of ABC and EOQ tools is
carried out to classify according to their importance
in the warehouse and to identify the order (Causado,
2015). In this case, the most important products in the
warehouse are obtained as a result of the Pareto
diagram. After that, a series of calculations are
performed to obtain the order cost and quantities of
these. In addition, the author recommends the use of
software to manage the information and its
application in the company under study, since it has
several products with a lot of stock that take a long
time to leave the warehouse and a high opportunity
cost is obtained. As mentioned above, the sector in
the case study presents failures in inventory
management due to poor demand forecasting, lack of
information in records and poor planning of
warehouse management so that an improvement in its
model is needed to generate effective solutions to this
problem.
It was proposed to create a working model where
the company's database is organized to categorize the
most relevant dishes with the ABC classification.
After that, a demand forecast with simple exponential
smoothing was applied to forecast the next period's
demand and to know the required quantity of each
input used in the dishes. In addition, these inputs were
then sorted by ABC classification, taking into account
only products from zone A. Finally, the EOQ tool was
used, which allows us to obtain the lowest possible
inventory cost by using the costs of ordering and
keeping these inputs in the warehouse. The decision
to make this proposal was made because no other
scientific article was found that uses the tools together
and presents our improvement proposal for SMEs in
the gastronomic sector.
2 STATE OF THE ART
2.1 Demand Forecasting
This tool has been considered by numerous
researchers as fundamental in different improvement
proposals, since it is a vital point for making decisions
in the company on logistics issues that have
repercussions on the other activities to be carried out
with respect to inventory purchasing
(Gonzáles,2020). In addition, it is easily integrated
into the models proposed for warehouse management,
which also has a high impact on the aggregate
planning of companies. As can be seen in the papers
reviewed, the authors highlight the added value of
implementing this tool for decision making and
improving the desired results (Madariaga et al.,
2022).
2.2 ABC Classification
Its main objective is to classify a large number of
items by grouping them into the same family, since it
allows them to be grouped by different criteria that
they have in common (Rivera et al, 2019). Based on
this methodology for the selection of items, which has
been widely used by different organizations due to its
versatility of implementation regardless of the sector
in which it is found, its presence and use has been
seen in hospitals, clinics, insurance companies, coffee
companies, hotels, education, electronic companies,
among others. In this sense, as has been proven in a
case study, this methodology is characterized by
allowing the organization to obtain better control in
warehouse management, focusing on what is most
important for the company, according to their
interests and minimizing costs, although, even so,
there is still a resistance by companies to change in its
use due to lack of knowledge of its management
(Escobar et al, 2021).
Application of a Model Based on Demand Forecasting, ABC Classification and EOQ in a Gastronomic SME to Improve Inventory
Turnover: Case Study in Peru
435

2.3 EOQ (Economic Order Quantity)
This tool provides us with the optimal value of the
quantity to order to avoid stock breaks and to make
the management of the company's economic
resources more efficient (Rodriguez et al, 2018). In
addition, its main objective is to obtain the balance
between fixed costs and costs related to the inventory
held, so it is present in various case studies operating
in different sectors, as in the case of a paper with a
model based on this tool applied to the automotive
sector, where it guided its warehouse managers to
improve their logistics planning and ensure customer
demands without generating surpluses, offering a
better level of service (Contreras, et al 2019).
3 BASIS OF THE MODEL
In our case study we evidenced problems in inventory
control that were repeated in different SMEs based on
the literature due to the lack of tools for its
management and training. Therefore, we propose an
improvement proposal for storage management,
taking as a guide the different proposals analyzed in
papers on inventories that were implemented in
SMEs. The papers studied detail their proposals based
on components such as those shown in Table 1.
Unlike other models applied in sectors other than
restaurants, the proposed model includes demand
forecasting to obtain the optimal demand for the
following period, ABC classification that will
improve the results expected from the categorization
of supplies in the storage area and the EOQ tool for
planning the purchase of those categorized in zone A.
Table 1: Comparison matrix.
Causes Deficient
inventory
purchase
planning
Inefficient
demand
planning
Incorrect
decision on
the
importance
of inputs
Authors
Madariaga F.,
Carlos et al
(2020)
Demand
forecasting –
ABC
Classification
Artificial
Neural
Network
Rodríguez L.,
Guillermo et
al (2018)
EOQ ABC
Classification
Carreño D.,
Diego et al
(2019)
Demand
forecasting -
EOQ
Proposed
Model
Demand
forecasting -
EOQ
Demand
forecasting –
ABC
Classification
ABC
Classification
4 PROPOSED MODEL
Based on our review of different scientific articles on
our research topic, our proposal is made to improve
storage management using demand forecasting, ABC
classification and EOQ to increase inventory turnover
and the objective indicators of the proposed model.
First we have a low inventory turnover, and the
analysis of the problem is performed along with the
collection of data, then we move to the phases of the
model that have as name; organization, estimation,
prioritization and planning, finally an analysis of the
indicators in the validation, obtaining as a result an
improved inventory turnover.
4.1 Components
At the beginning of the proposed contribution, we
analyse the information provided in the case study
with a root cause or Ishikawa diagram, in order to
highlight the possible causes of the main problem.
After that, the 5 Whys tool is used in different
personnel of the company to validate the information,
in addition to a Pareto diagram highlighting the most
relevant events. After having reviewed the
information and having verified it, we collected data
relevant to the main axis of the problems that will be
used in the following components.
In phase 0, we began with the collection of the
necessary data for the use of the input tools, so we
worked together with the company to obtain the
required data. Among the data needed for the
implementation we have; list of the restaurant's
dishes; sales in units per month and cost of each dish.
In phase 1, called Organization, the categorization
of all the existing dishes in the company was carried
out. They are classified according to their units sold
by their unit cost in the same time range. After that,
we selected only the dishes categorized in zone A,
which represent the 80% with the highest utilization
value.
In phase 2, called Estimation, we proceeded to run
the demand forecasting tool for the dishes exclusively
in zone A, using the historical demand for each dish,
Figure 1: Proposed model
ISAIC 2022 - International Symposium on Automation, Information and Computing
436

the type of forecast selected for our contribution is
simple exponential smoothing to ensure that the
forecast is the most accurate [12]. The following
formula will be used;
𝐹t =𝐹t-1+∝(
𝐴
t-1 −𝐹t-1)
(1)
Ft = Average number of products sold in a given
period t.
Ft-1 = Average number of products sold in a given
period t-1.
At-1= Quantity of products sold in a period t-1.
∝ = Smoothing coefficient between 0 and 1.
In phase 3, called Prioritization, a new
categorization was carried out by disaggregating the
inputs of each plate to obtain a general list of the
inputs used. In this list, the ABC classification tool
was used again to obtain the inputs that represent 80%
of the total in order to continue with the following
tool.
In phase 4, called Planning, EOQ was performed
to obtain accurate data on order quantity, time
between orders and reorder point, then evaluate the
results with indicators in the next phase. For this we
need to obtain data such as:
Q* = Optimal number of units to order (EOQ)
D = Monthly demand in units
St = Ordering Cost ($)
Ht = Cost of maintaining inventory ($)
s = Unit order cost for each order ($)
h = % of cost of holding inventory
c = Unit cost of product ($)
R = Reorder Point
Lt = Monthly Lead Time
𝑄* =
2𝐷∗ 𝑠
ℎ∗𝑐
; N=
𝐷
𝑄*
;T=
30
𝑁
; 𝑅=𝐷 ∗ 𝐿𝑡
(2)
𝑆t =
𝐷
𝑄*
∗
(
𝑠
)
; 𝐻t =
𝑄*
2
(
ℎ∗𝑐
)
(3)
Finally, in this phase, the indicators selected for
monitoring the proposed model were inspected to
analyze the performance of the results found after its
application, having previously carried out a previous
evaluation of the same indicators at the beginning of
the application of the tools, for comparison in the
simulator. All this will be recorded in order to
continuously improve the processes and obtain
opportunities for improvement. The main indicator of
this article is the inventory turnover, then we have
proposed the evaluation of related indicators such as
average inventory, service level and the variation of
times of purchase of inputs, all shown in Table 2 with
their respective formulas and uses.
Table 2: Indicators
Indicator Formula
Inventory turnover
𝐶𝑜𝑠𝑡 𝑜𝑓 𝑠𝑎𝑙𝑒𝑠
𝐴𝑣𝑒𝑟𝑎𝑔𝑒 𝐼𝑛𝑣𝑒𝑛𝑡𝑜𝑟𝑦
Average inventory
𝐵𝑒𝑔𝑖𝑛𝑛𝑖𝑛𝑔 𝐼𝑛𝑣.+Ending Inv.
2
Service Level
𝐶𝑜𝑚𝑝𝑙𝑒𝑡𝑒𝑑 𝑜𝑟𝑑𝑒𝑟𝑠
𝑂𝑟𝑑𝑒𝑟𝑠 𝑟𝑒𝑐𝑒𝑖𝑣𝑒𝑑
Variation of times
of purchase of
su
pp
lies
#purch.𝑡−# 𝑝𝑢𝑟𝑐ℎ.(𝑡−1)
# 𝑝𝑢𝑟𝑐ℎ.(𝑡− 1)
5 VALIDATION
5.1 Initial Diagnosis
The data obtained from the case study provide us with
a technical gap with respect to the industry standard
inventory turnover, whose value is 11.23 (Company,
Sector, Industry and Market Analysis [CSI Market]
2021). The company under study has an inventory
turnover level of 8.20, which generates an operating
cost representing 11.21% of the company's
profitability in the case study. The main reasons for
this problem are: (a) overstocking due to low number
of purchase times, (b) loss of sales due to lack of
required inputs, (c) poor product categorization
approach.
5.2 Validation Design and Comparison
The technique selected for our validation will be the
simulation and it will be performed in the simulator
program called Arena, since it has the advantage of
representing the systems and reports in a more
dynamic way, giving reports on the functionality of
the system within the restrictions used. For this we
use the historical data of the company as the arrival
of orders, the number of dishes, the type of dishes to
choose, among others. All this information was
necessary for the application of the tools proposed in
our contribution. These are ABC classification for
both dishes and inputs, demand forecasting and EOQ.
This will be done in order to corroborate the
efficiency of the application of our proposal in the
case study, mentioning some previous considerations
for its development.
We consider in this section both the input
variables, which were analyzed by the Input
Application of a Model Based on Demand Forecasting, ABC Classification and EOQ in a Gastronomic SME to Improve Inventory
Turnover: Case Study in Peru
437
Analyzer, the scope of the system, the calculation of
the sample size giving more confidence to the
simulation results, entities and constraints, as well as,
the period applicable to the simulator, improvements
and recommendations. Finally, we will show the
metrics of the results obtained.
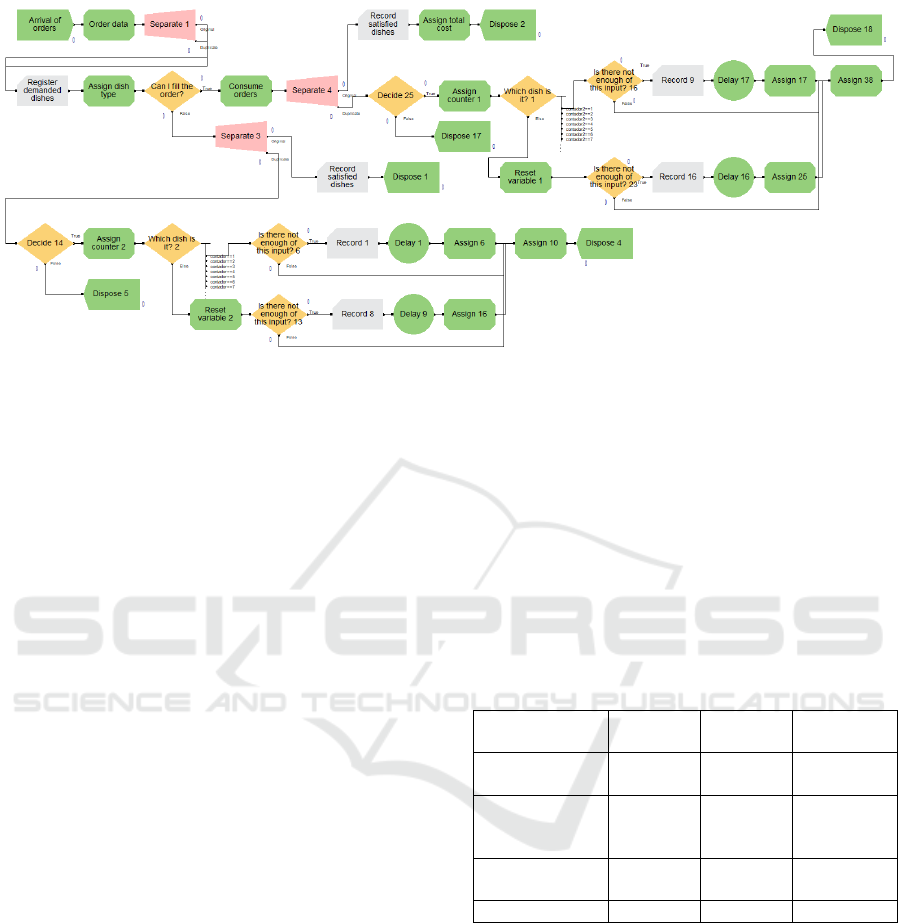
5.3 Simulation of the Proposal Model
The simulation of the inventory management process
for our case study begins with the entry of orders,
where the amount of dishes to choose is obtained as
input data; as well as the type of dish. After that, the
order is generated to the kitchen for the preparation
where the stock of inputs is discounted and the order
is delivered to the customer. If the order is not
fulfilled due to lack of supplies, an unexpected
purchase order will be generated for replenishment
during the course of the day. Therefore, the customer
cannot be served until the required supplies are
replenished and it will be considered as an unfilled
order. Each day a review of the inputs is carried out,
verifying the reorder point of each input, if it does not
meet this condition, a purchase order is generated
with a lot size determined by the company, where a
one-day delay time restriction for resupplying all
inputs has been taken as a restriction.
The restrictions of this simulation are based on the
10 dishes obtained within zone A of the ABC
classification applied among the restaurant's dishes,
since they are the ones that represent the most value
and relevance for the company. In addition, it should
be considered that the simulation will use only the
most used inputs for the group of dishes resulting
above, obtaining the 8 most relevant inputs, since an
ABC classification was also performed to give more
focus to these inputs, which represent 80% of the total
value of inputs used in their preparation.
It was also considered that the working time is 10
hours per day in an applicable period of one month.
In addition, there are two branches, one for inventory
replenishment due to stock-outs and the other with
planned purchase orders. After the application of the
simulation, either in the current situation and in the
proposed model, the results detailed in Table 3 are
shown.
Table 3: Simulation results of the initial model and the
proposed model.
Indicator Units Initial
Situation
Improved
situation
Inventory
turnove
r
Times 9.12 12.77
Variation of
purchases of
su
pp
lies
+/- % - + 8.57%
Average
inventor
y
$ 1230.14 951.27
Service Level % 72.80% 78.09%
6 CONCLUSIONS
In the first place, we were able to improve the process
of the case study by obtaining a better inventory
turnover, which was our objective, and this was due
to the correct implementation of the tools in the
inventory management process, and all this without
modifying the structure of the current process, but
with a better planning of its purchasing strategies. As
a result, we obtained a remarkable improvement of
40.02% of our main problem over the indicator of the
current situation.
Figure 2: System representation in the Arena simulator
ISAIC 2022 - International Symposium on Automation, Information and Computing
438

In second place, it is evident in the case study that
there are SMEs that do not give greater relevance to
their inventory control and the monetary loss that this
represents, since the main causes of their low turnover
can be solved by obtaining a positive economic
impact on the company's capital.
Thirdly, the application of the improvement
proposal is effective in different scenarios according
to the simulations made, which demonstrates the
robustness of our proposal, which could be replicated
in other related or similar areas.
Finally, tools such as ABC classification allowed
us to categorize a large number of items, which
facilitated the prioritization of these items and
allowed a better quality of data for the demand
forecast. In this way, the EOQ tool was executed,
with which we obtained the quantity to be purchased
per lot, the amount of re-order, as well as the exact
time to generate the order. However, more research
should be done on the use of EOQ with products with
expiration dates and it should be coupled to the model
to achieve a greater impact on inventory turnover and
on the company's future planning with respect to its
inventories.
REFERENCES
Acevedo Yepez, E., 2014. Herramienta para la gestión de
inventarios según distribución ABC basado en ventas a
proyectar para el Supermercado Cocot. Universidad de
Costa Rica.
Bofill Placeres, A., Sablón Cossío, N., & Florido García,
R., 2017. Procedimiento Para La Gestión De Inventario
En El Almacén Central De Una Cadena Comercial
Cubana. Universidad y Sociedad, 9(1), 41–51.
Carreño Dueñas, D. A., Amaya González, L. F., Ruiz
Orjuela, E. T., & Javier Tiboche, F., 2019. Diseño de
un sistema para la gestión de inventarios de las pymes
en el sector alimentario. Industrial Data, 22(1), 113–
132. https://doi.org/10.15381/idata.v22i1.16530
Causado Rodríguez, E., 2015. Modelo de inventarios para
control económico de pedidos en empresa
comercializadora de alimentos. Revista Ingenierías
Universidad de Medellín, 14(27), 163–178.
https://doi.org/10.22395/rium.v14n27a10
Confederación Nacional de Instituciones Empresariales
Privadas, 2021. PYMES: El motor del crecimiento en
el Perú. https://www.confiep.org.pe/confiep-tv/pymes-
el-motor-del-crecimiento-en-el-peru/
Contreras, A., Escalante, M., Cortes, I., & Baños, F., 2019.
Modelo de lote económico de pedido EOQ en el
inventario de partes de servicio automotriz. Ingenio y
Conciencia Boletín Científico de La Escuela Superior
Ciudad Sahagún, 6(12), 90–94.
https://doi.org/10.29057/escs.v6i12.4159
CSIMarket, 2021. Restaurant Industry: Efficiency
information & Trends.
https://csimarket.com/Industry/industry_Efficiency.ph
p?ind=914
Escobar-Mamani, F., Argota-Pérez, G., Ayaviri Nina, V.
D., Aguilar-Pinto, S. L., Quispe Fernández, G. M., &
Arellano Cepeda, O. E., 2021. Costeo basado en
actividades (ABC) en las PYMES e iniciativas
innovadoras: ¿opción posible o caduca? Revista de
Investigaciones Altoandinas - Journal of High Andean
Research, 23(3), 171–180.
https://doi.org/10.18271/ria.2021.321
Giles Navarro, C. A., 2020. Recomendaciones para las
MIPyME ¿Qué hacer para sobrevivir a la pandemia del
Covid-19? Notas Estratégicas, 13.
González, Adolfo, 2020. Un modelo de gestión de
inventarios basado en estrategia competitiva. Ingeniare.
Revista chilena de ingeniería, 28(1), 133-142.
https://dx.doi.org/10.4067/S0718-
33052020000100133
Madariaga Fernández, C. J., Lao León, Y. O., Curra Sosa,
D. A., & Lorenzo Martín, R., 2020. Metodología para
pronosticar demanda y clasificar inventarios en
empresas comercializadoras de productos mayoristas.
Retos de La Dirección, 14(2), 354–37316
Morejón, D. et al., 2018. Modelo de inventario para el
control económico de pedidos en Microempresa de
Calzado. Revista Científica Mundo de La Investigación
y El Conocimiento.
Rivera Gómez, H., Fragoso Cruz, P. L., Garnica González,
J., & Montufar Benítez, M. A., 2019. Aplicación de
Técnicas de Planeación de la Producción a una Empresa
de Prefabricados de Concreto. Conciencia Tecnológica,
58.
Rodríguez-López, G., Salazar-Vázquez, F., & González-
Urgiles, J., 2018. Control de inventarios con ajuste
dinámico del punto de reorden - Un caso de estudio para
empresas con productos perecibles y no perecibles,
usando técnicas computacionales. Advance Research
Journal of Multi-Disciplinary Discoveries I, 23(1), 13–
20. www.journalresearchijf.com
Serna, D. y Rivera, Y., 2018. Dinámica de sistemas en la
gestión de inventarios. Ingenierías USBMed, 9(1), 75-
85. https://doi.org/10.21500/20275846.3305
Sociedad de Comercio Exterior del Perú, 2021.
Alojamiento y restaurantes; transporte; y manufactura
entre los sectores con mayor urgencia de reactivación
económica.
Sociedad de Comercio Exterior del Perú. 2022. El
Subsector Restaurantes registró un crecimiento
interanual del 92.06% en febrero de 2022.
Villón Tigrero, A. M., 2021. Rotación de inventario y su
importancia en la aplicación en el sector comercial.
Universidad Estatal Península de Santa Elena.
Zuluaga, C. A. C., Eafit, U., & Escobar, S. C. B., 2012.
Metodología para la selección del parámetro alpha en el
modelo de Suavización Exponencial: Un enfoque
empírico. 10 Latin American and Caribbean
Conference for Engineering and Technology, 1–10.
Application of a Model Based on Demand Forecasting, ABC Classification and EOQ in a Gastronomic SME to Improve Inventory
Turnover: Case Study in Peru
439
