
Analysis of the Influence Relationship for the Earth Dam-Break
Outflow Estimation Parameters
Liu Jie
*
a
, Xu Jiajun, He Hujun and Li Xuewei
School of Civil and Building Architecture Engineering College of Pan Zhihua University,
No.10 Airport Road, PanZhihua, China
Keywords: Dam-Break, Breach Outflow, Breach Width, Breach Water Surface Velocity, Breach Water Depth.
Abstract: In order to exploration the relationship between breach hydrograph and other breach parameters, a series earth
dam-break experimental with spatial breach overtopping tests were conducted in an 4m wide, 50m long and
2m high with glass side-walls flume at the State Key Laboratory of Hydraulics and Mountain River
Engineering of Sichuan University. An industry camera and two digital video recorders were used to record
the dam breach process, and the Large-Scale Particle Image Velocimetry (LSPIV) technique was introduced
to measure water surface velocity of dam breach. The results showed that the dam breach process can be
divided into two stages, the main feature of first stage was “headcut” while the second stage was“surface”
erosion. The length rate of CSC and CS was approximately 0.85 at peaking discharge moment in the present
study. The breach hydrograph may be the function of breach water width and breach water velocity. The
breach water depth can be estimated by using
() () ()tan
cw c d
ht z t X t z
ϕ
=+ −
, and the breach depth at 100s
was approximately equal to 13cm based on this formula. The time of breach peak discharge was nearly the
same as the breach width reach the maximum. However, there was about 30s time lag for breach peak
discharge relative to time of peak breach water surface velocity
1 INTRODUCTION
The earth dams have served mankind as hydropower
generating industry, water supply, irrigation systems
and flood control. If the inflow exceeds the storage
capacity of the reservoir and/or the spillway design in
the time of cloudburst, the dam-break may happen
and the rushing flood would cause damage and
disruption to people and economies. (Wang and Chen,
2010).
Over the past several decades, the model of
estimating the earth dam failures discharge due to
overtopping has been developed, mainly using
mathematical techniques. Besides, many researchers
attempted to find a general formula to describe the
time history of breach hydrograph, since the
hydrograph can be used to predict the downstream
flood levels and discharges routing (Singh 1996;
Hanson et al., 2005). Such formulas for dam
breaching according to the basis of data from dozens
a
https://orcid.org/0000-0003-0947-5590.
*
Liu Jie(1986-), man, Doctor, Associate professor, Mainly
engaged in dam-break and disaster research
of historic dam failures were called parameter
method. The common parameters include reservoir
volume, reservoir water depth, breach width, breach
shape, breach water velocity and so on (Wu, 2011).
The advantages of parameter method are quick and
easy and can be used to estimate real-time discharge.
For example, Coleman et al.(2002) proposed the
concept of “curved section”, which was the highest
points of the inlet of breach channel (Coleman et al.,
2002). In this cross-section, the hydrograph was
related to the water height above the breach channel
during dam failure process. However, the reservoir
water level for all of Coleman’s experiments were
considered keeping constant during whole dam-break
process. In other words, Coleman ignored the effects
of the reservoir volume. Following Coleman’s
research, Al-Riffai (2014) conduct a series
experiments to estimate the width of “curved
section”. Since the shape of “curved section” was not
a straight line, Al-Riffai (2014) assumed the shape to
be a circular, and then the distance ratio of curved line
150
Jie, L., Jiajun, X., Hujun, H. and Xuewei, L.
Analysis of the Influence Relationship for the Earth Dam-Break Outflow Estimation Parameters.
DOI: 10.5220/0011950300003536
In Proceedings of the 3rd International Symposium on Water, Ecology and Environment (ISWEE 2022), pages 150-155
ISBN: 978-989-758-639-2; ISSN: 2975-9439
Copyright
c
2023 by SCITEPRESS – Science and Technology Publications, Lda. Under CC license (CC BY-NC-ND 4.0)
and straight line and how the “curved section”
influence the breach discharge was discussed (Al-
Riffai, 2014). Walder et al. (2015) employed the
photogrammetric method to measure the “curved
section” shape, believing the vertical cross section
was a parabolic, and obtained a discharge estimating
formula that based on area of “curved
section”(Walder et al., 2015). Liu et al. (2021) used
LSPIV technology to measure the surface velocity of
“curved section”, analysing the effects of different
vertical velocity profile approximation and
suspended sediment concentration (Liu et al., 2021).
However, very few work have carried to investigation
the relationship between breach hydrograph and other
breach parameters, especially whether the peak time
for those parameters are synchronized. In order to
better understanding this relationship, a series earth
dam-break experimental with spatial breach
overtopping tests were conducted, and the focus of
this paper was to analyse the experiments data and
provides the research basis for the following
manuscript.
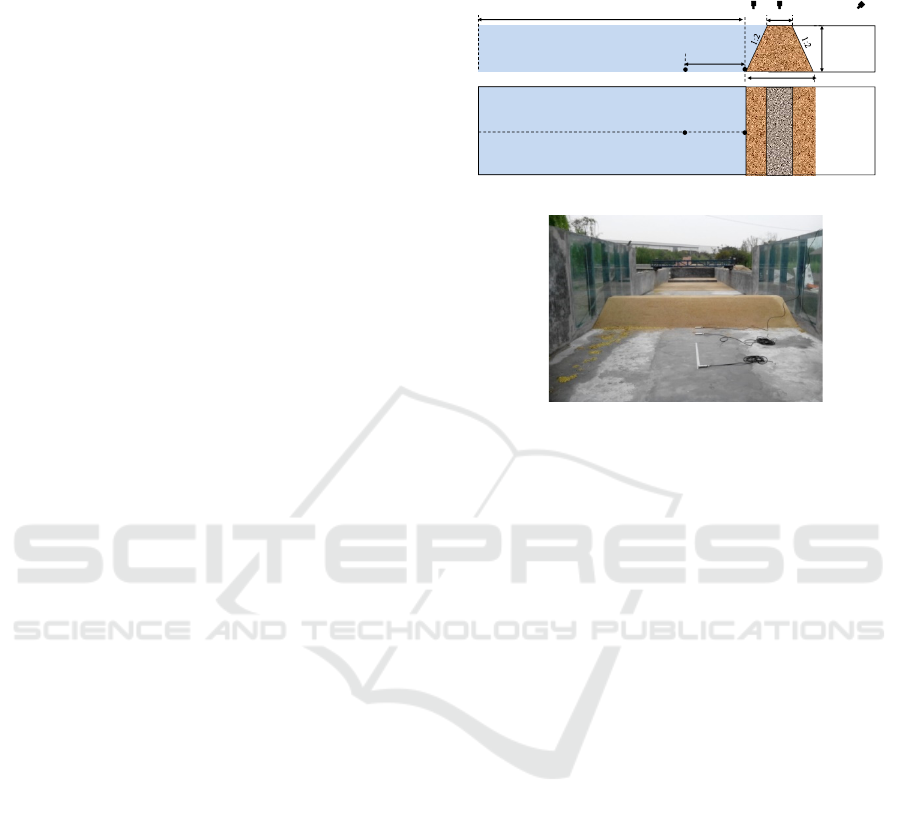
2 EXPERIMENTAL SETUP
The experiments flume was built in Jiang’an campus
of Sichuan University, and the scale was 4m in width,
2 m in height and 40 m in length with a concrete bed.
The flume side walls were built using bricks and
concrete with glass view windows at the middle
centre. The model dam was an isosceles trapezoid
homogenous sand dam, with the 0.05 m depth initial
breach through the middle of dam crest. The dam
height is 50 cm, top width is 50 cm and the bottom
width is 250cm. Two pressure transducers labeled
Y0043, Y0044 were deployed to measure the time
history of water depth along the flume. In addition,
two industrial cameras labeled CCD1 and CCD2, and
one high speed digital cameras labeled DV1 were
used to record the dam break process. The schematic
views of the whole flume and the photo image of
experiment field were shown as Figure 1. The inflow
to the reservoir was supplied by two symmetry
channel and measured with a Sharp-crested weir at
upstream of reservoir after all the equipment were
ready. The inflow discharge stabilized quickly until
the water level rail up to 40cm and then maintained at
a relatively constant flow of about 0.00167m3/s for
all tests. Once the upstream water level reaches and
overtops the dam crest, the dam breach process
commences. In order to obtain the water surface
velocity based on LS-PIV technology, the scraps of
paper with 1cm by 1cm in size and white in colour
were throw into reservoir as tracers to visualize the
flow pattern when the test begins.
(a)Schematic view of whole experiment field
(b) The photo image of whole experiment field
Figure 1: The schematic views of the whole flume and the
photo image of experiment field
3 OBSERVATION AND
DISCUSSION
3.1 Dam Breaching Process
Snapshots of the breach development in the idealized
dam are captured and presented in Figure 2. The
starting time of dam-break was defined as the water
flows through the initial breach channel and reached
the dam toe (Figure 2(0s)). In the early stage of dam
failure, since the discharge was too small, the most of
water was permeated into dam and the sand can’t be
moved far away, the initial breach flow resulted in
sheet and rill erosion in downstream slope, a large
amount of sand accumulate at the toe of dam and
formed a deposition fan. This phenomenon would last
until the time of 50s. During this stage, the depth
erosion was faster than width erosion at downstream
but at crest the depth erosion and width erosion was
nearly the same (Figure 2(30s)). Observations from
other researcher’s laboratory experiments and case
studies suggest that the earth dam breaching
mechanism for the typical overtopping erosion model
relay on dam material and compaction, which is head-
cut erosion for cohesive earth dam while progressive
surface erosion for non-cohesive dam, but there are
no strict definition for the transition point between
surface erosion and head-cut (Hanson et al., 2005).
CCD1 CCD2
DV1
Reservoir
0.5m
1.5m
22.25m 0.5m
Side view
YL0044
YL0043
Reservoir
Plan view
2.5m
Analysis of the Influence Relationship for the Earth Dam-Break Outflow Estimation Parameters
151
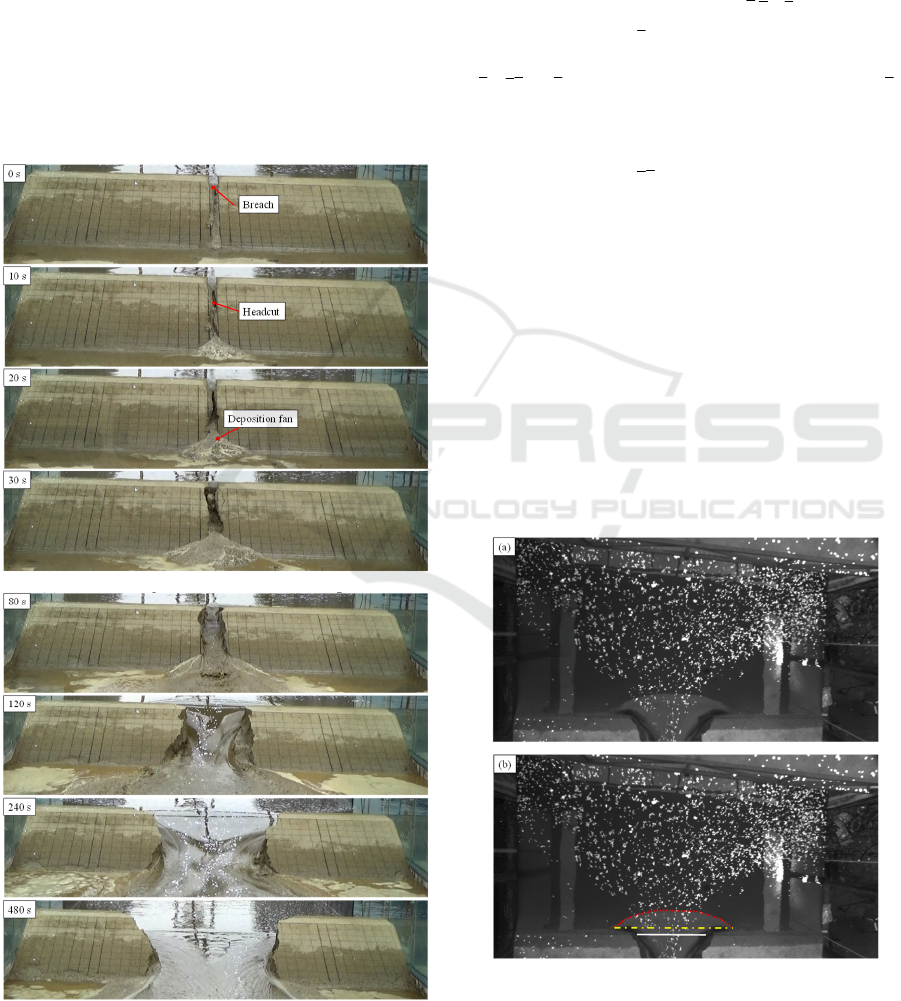
Referring this definition, the head-cut was the main
feature for the stage of 0s~50s of our experiments.
Erosion further advanced form downstream slope to
upstream, resulting the dam crest width decreasing.
The breach side wall mass failure often interdicted
breach flow. When the head-cut sheet advanced to the
water line on the upstream slope of the dam, the
breach outflow increased significantly. From this
moment, the breach inlet enlarge rapidly, a large
amount of water swarmed into breach, the carrying
sand ability enhances, the breach erosion model was
changed from “head-cut” into “surface” erosion
(Figure 2(80s~480s)). Therefore, the breach erosion
model is not only related to the material and
compaction, but also be related to breach outflow.
(a) The first stage of breach deformation process
(b) The second stage of breach deformation process
Figure 2: The breach deformation process of two stages
3.2 The Parameters of Breach Outflow
Estimation
Many researchers attempted to investigation the
common parameters to quantify the breach outflow.
According to Coleman, the best cross-section for
calculate real-time discharge is at the “curve section”
(Coleman et al., 2002). Generally, the breach
discharge can be defined as
out
QAV=
(
A
was average
cross-section area,
V
was average water velocity).
While the average cross-section can be express as
ABh=
(
B
was average length of breach width,
h
was average breach water depth), and the average
water surface was often the function of water surface
velocity. Therefore, the breach discharge can be
estimated as
()
out surf
QBhfu=⋅
(
s
urf
u
was the water
surface velocity)(Mahmoud et al., 2022).
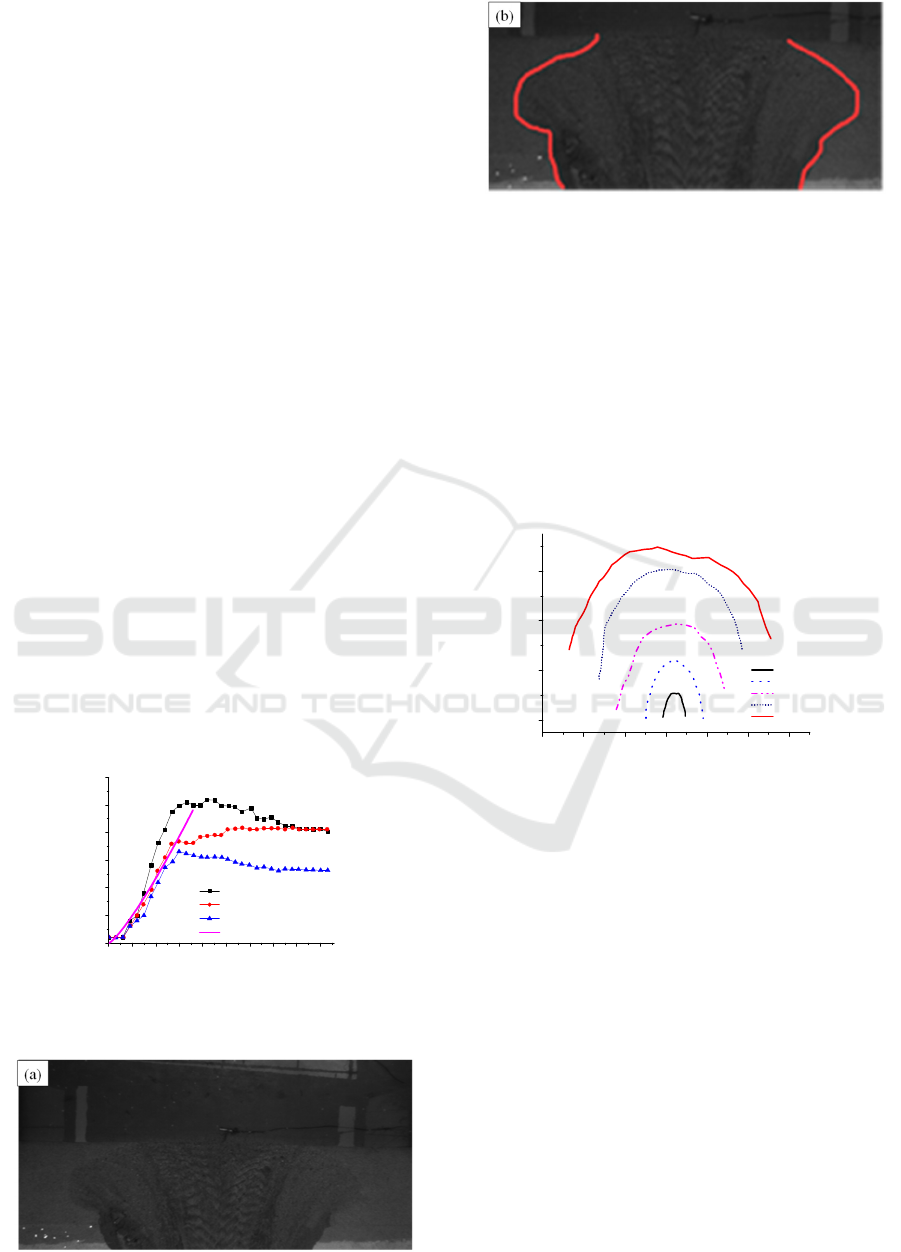
3.2.1 The Length of “Curve Section”
The length of “curve section” was difficult to measure
directly since its irregular shape (Figure 3). One of the
common methods was using other distance to replace
it. For example, the dash line in Figure was the “curve
section”(CS), which can be replaced by the dot dash
line or solid line. The dot dash line was the chord of
“curve section”(CSC), the solid line was breach water
width at initial breach inlet position(IB). The location
of dash line and dot dash line moving upstream but
the solid line stood still during whole dam-break
process.
Figure 3: Sketch of different breach length location
Coleman’s study showed the length of “curve
section” was the function of time while not the
ISWEE 2022 - International Symposium on Water, Ecology and Environment
152
sediment, the function was
30.616
**
1.29 10 ( )Lt
−
=×
(
*
L
was dimensionless length,
*
t
was dimensionless
time). For the present experiment, we measured the
time history length of these three lines, and compared
the experiments data with Coleman’s function dada,
which was shown Figure 4. It found that the
calculated data fitting to the CSC data better than CS
data and IB data before 120s. However, the calculated
data separated a lot to all experiments data after 120s.
This was because Coleman’s formula was based on
the condition of constant reservoir, which was not
appropriate for present experiments. Comparison
other three experiments data, the length of “curve
section” was longest, the CSC was second long and
the IB was shortest. At the beginning time and ending
time of dam-break, the CS and CSC was the same
length, while at other period the CS length was larger
than CSC length. There were many investigators to
estimate the length rate of CSC and CS. For example,
Das’s (1997, p. 89) study showed the rates were 0.46
and 0.67 for two dam-break experiments (Das et al.,
1997). Walder et al.(2015, p. 6710) presented several
dam failure test showing the rate may increase from
0.1to 0.5 as dam height decreasing (Walder et al.,
2015). It was found that the rate was approximately
0.85 at peaking discharge moment in the present
study. The profile of final breach was showed in
Figure 5, In addition to these three sections, the length
of other section form upstream to downstream was
also different. Therefore, which section was most
suitable for measuring the dam-break outflow? This
is a long-term task that needs more work to confirm.
Figure 4: Comparison of breach length of different section
and empirical formula
Figure 5: The profile for final breach
3.2.2 The Water Depth Estimation at
“Control Section”
The location of the “control section” as a function of
time, moved upstream during outflow rush out from
dam breach, was recorded by using the video above
the dam crest. The distance between every location
and initial location can be measured by using
photogrammetric method. As Figure 6 showed, the
curvature of “control section” was decreasing when it
moving upstream but the length was increasing.
Figure 6: The location of “control section” moving
upstream process
Following Walder’s (2015) method, the flow depth at
the “control section” was defined as follows:
() () ()
cwc
ht z t zt=−
(1
)
As Figure 7 showed,
c
h
was the water depth at the
“control section”,
w
z
was the water free surface
elevation over the “control section”, and
c
z
was the
bottom elevation of the “control section”,
c
X
was the
distance form initial location to present location,
ϕ
was the upstream slope of the dam,
d
z
was the initial
dam height. Among these parameters,
d
z
,
w
z
and
c
X
can be measured directly. For artificial earth dam,
ϕ
was usually a given factor, while it should be assumed
for nature dam. Therefore, the equation 1 can be
0 50 100 150 200 250 300 350 400 450
0.0
0.5
1.0
1.5
2.0
2.5
3.0
Time/s
Breach Length /m
Length of CS
Length of CSC
Length of IB
Coleman.et al.(2002)
0.8 1.2 1.6 2.0 2.4 2.8 3.2
0.0
0.1
0.2
0.3
100s
140s
180s
220s
260s
Locotion (m)
Length (m)
Analysis of the Influence Relationship for the Earth Dam-Break Outflow Estimation Parameters
153
expressed as equation 2. Based on equation 2, the
breach water depth was about 13cm at 100s.
However, the equation 2 worked well in the early
period of the second stage of dam break but not all: it
failed when the breach water depth become too large.
() () ()tan
cw c d
ht z t X t z
ϕ
=+ −
(2
)
Figure 7: Sketch of the breach water depth estimation
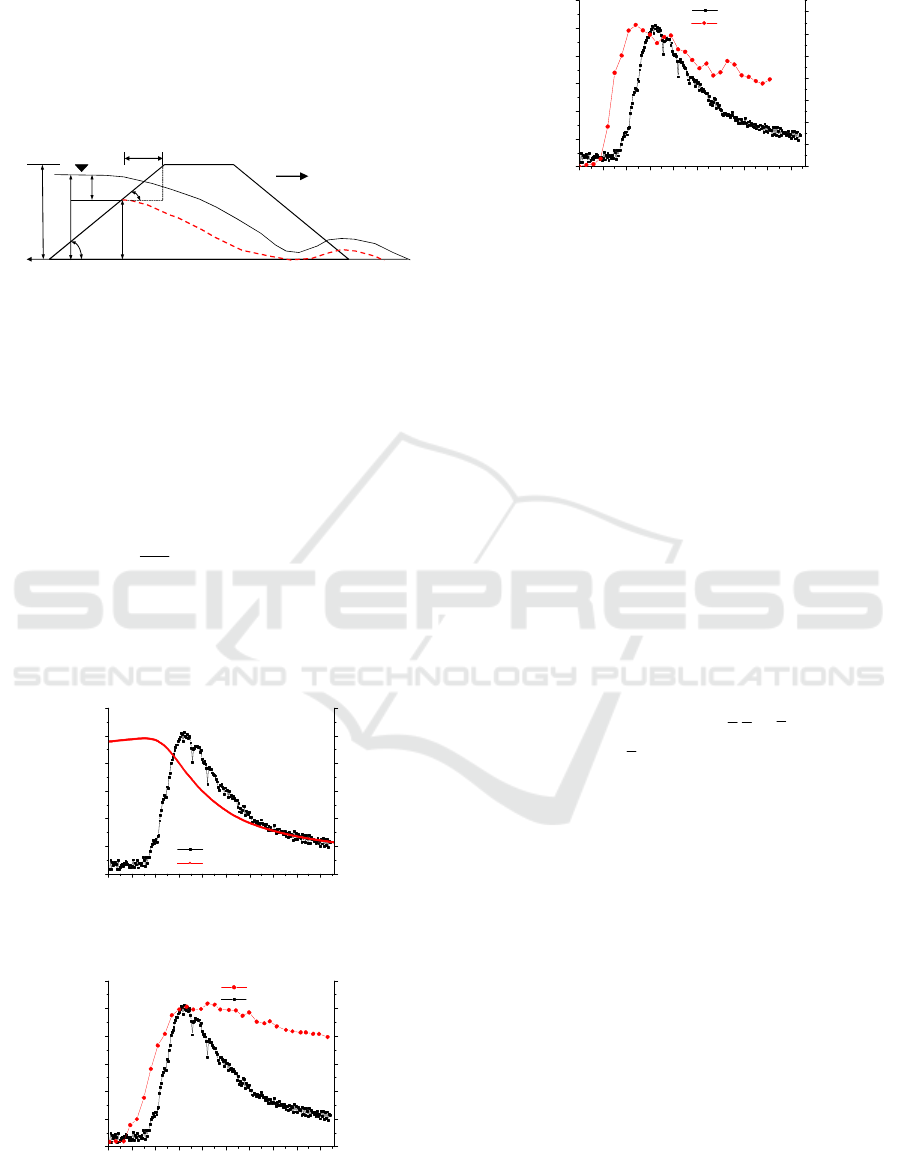
3.2.3 Comparison Breach Hydrograph and
Other Parameters
The breach discharge was the most important
parameters for dam-break problem since it
determines the downstream inundated area, which
was often estimated using water volume balance of
reservoir.
in out
dW
QQ
dt
=−
(2)
where
in
Q
was the inflow;
out
Q
was the breach
discharge;
W
was the water volume of the upstream
reservoir.
(a) Comparison breach hydrograph and water depth of
reservoir
(b) Comparison breach hydrograph and breach length of
“control section”
(c) Comparison breach hydrograph and water surface
velocity
Figure 8: Comparison breach hydrograph and other
parameters
In order to better understand the time correlation of
breach discharge and other parameter such as
reservoir water depth, breach width and breach water
surface velocity, the breach hydrograph and these
parameters were put together and showed in Figure
8a~c. According to equation 3, the discharge curve
was derived from water depth of reservoir, and the
peak discharge time would come out at maximum
slope of reservoir water level curve, as shown in
Figure 8a. Comparison of time history of dam breach
discharge and the breach length of “control section”,
it can be found that when the length of “control
section” reach the maximum, the discharge was also
the maximum (Figure 8b). The water surface velocity
at “control section” was measured by using LS-PIV
technology, and there exist about 30s interval for peak
water surface velocity to peak discharge (Figure 8c).
Therefore, according to
out
QAV=
(
A
was average
cross-section area,
V was average water velocity), the
contribution of cross-section area was larger than
water velocity for dam breach outflow estimation.
4 SUMMARY AND
CONCLUSIONS
This study presents the experimental investigation of
the breach parameter relationship for earth dam
failure due to overtopping. The experiment was
conducted in a flume of 50m*4m*2m with an
idealized earthen dam placed in the middle.
According to experiments data, it showed that the
dam breach process can be divided into two stages,
the main feature of first stage was “head-cut” while
the second stage was “surface” erosion. It was found
that the length rate of CSC and CS was approximately
0.85 at peaking discharge moment in the present
study. The breach water depth can be estimated by
𝜑
𝑧
𝑧
ℎ
𝑋
Flow direction
𝑧
𝜑
0 50 100 150 200 250 300 350 400 450
-0.05
0.00
0.05
0.10
0.15
0.20
0.25
Breach Outflow
Time/s
Outflow/(m
3
/s)
0
100
200
300
400
500
600
Water Depth of Reservoir
Water Depth/mm
0 50 100 150 200 250 300 350 400 450
-0.05
0.00
0.05
0.10
0.15
0.20
0.25
Breach Outflow
Time/s
Outflow/(m
3
/s)
0.0
0.5
1.0
1.5
2.0
2.5
3.0
Length of CS
Length of CS/m
0 50 100 150 200 250 300 350 400 450
-0.05
0.00
0.05
0.10
0.15
0.20
0.25
Breach Outflow
Outflow/(m
3
/s)
Time/s
0.0
0.2
0.4
0.6
0.8
1.0
1.2
1.4
Surface Velocity
Surface velocity/(m/s)
ISWEE 2022 - International Symposium on Water, Ecology and Environment
154

using
() () ()tan
cw c d
ht z t X t z
ϕ
=+ −
, and the based on
this formula, the breach depth at 100s was
approximately equal to 13cm. The peak time of
discharge was nearly the same as maximum breach
width time and maximum reservoir water depth
decreasing slope time but delayed to peak water
surface velocity time about 30s.
ACKNOWLEDGMENT
This research was jointly supported by the youth
program of Sichuan Science foundation:
Experimental study and numerical simulation of
landslide surge superimposed in different stages of
earth-rock dam break process (Grant No.
2022NSFSC1068), and the open project of key
laboratory of scientific research projects of colleges
and universities of Sichuan province (Grant No. SC_
FQWLY-2021-Y-03), the 2022 open project of
failure mechanics engineering disaster prevention of
key Lab of Sichuan Province: The investigation of the
impact force of surge wave on dam and its damage
mechanism research (Grant No. FMEDP202210), the
2022 open project of failure mechanics engineering
disaster prevention of key Lab of Sichuan Province:
Study on the rule and mechanism of dynamic crack
propagation under blasting (Grant No.
FMEDP202208).
REFERENCES
Al-Riffai, M., 2014. Experimental study of breach
mechanics in overtopped noncohesive earthen
embankments. PhD dissertation, Univ. of Ottawa,
Ottawa, Ont., Canada.
Coleman, S. E., Andrews, D. P., and Webby, M. G.,2002.
Overtopping breaching of noncohesive homogeneous
embankments. Journal of Hydraulic Engineering-Asce,
128(9): 829-838.
Das, P. K., 1997. Breach erosion process of homogeneous
earth fill dams and fuse plugs due to overtopping flow,
Ph D thesis, Indian Inst.of Technol. Kanpur, Kanpur,
India,.
Hanson, G. J., Cook, K. R., and Hunt, S. L., 2005. Physical
modeling of overtopping erosion and breach formation
of cohesive embankments.Trans. ASABE,48(5):1783-
1794.
Liu, J., Xiao, H., Lin, P., Zhou, C., and Wang, W., 2021.
Effect of vertical velocity profile approximations on
estimates of dam breach discharge using surface
velocities. Journal of Flood Risk Management, 14(3):1-
13.
Mahmoud T. Ghonim, Magdy H. Mowafy et al.,2022.
Investigating the peak outflow through a spatial
embankment dam breach. Ain Shams Engineering
Journal 13,101799
Singh, V. P., and Scarlatos, C. A.,1988. Analysis of gradual
earth-damfailure. Journal of Hydraulic Engineering,
114(1): 21–42.
Wang J.C., Chen X.,2011. Study of a landslide surge
disaster based on Pan Jiazheng calculation method of
sliding velocity and surge. Hazard, 1:16–22.(in Chinese)
Wu W. M.,2011. Earthen Embankment Breaching. Journal
of Hydraulic Engineering, 137:1549-1564.
Walder, J. S., Iverson, R. M., Godt, J. W., Logan, M., and
Solovitz, S. A.,2015. Controls on the breach geometry
and flood hydrograph during overtopping of noncohesive
earthen dams. Water Resources Research,51(8): 6701-
6724.
Analysis of the Influence Relationship for the Earth Dam-Break Outflow Estimation Parameters
155
