
Analysis on the Trend of Total Water Use and Water Use Efficiency
in the Pearl River Basin During 2001-2017
Sen Wang
1,2
and Shanzong Li
3,*
1
Pearl River Water Resources Research Institute, Guangzhou 510611, China
2
Key Laboratory of the Pearl River Estuary Regulation and Protection of Ministry of Water Resources,
Guangzhou 510611, China
3
Technical Advisory of Pearl River Water Resources Commission (Guangzhou)Co. Ltd, Guangzhou 510611, China
Keywords: Water Resources Management, Pearl River Basin, The Most Stringent Water Management Policy.
Abstract:
Implementing the most stringent water management policy (MSWMP), which includes total water use redline,
water use efficiency redline and pollution limit redline, is the guiding principle and overall requirement for
water resources management in China. In recent years, through the implementation of the MSWMP, the water
resources management system and capability have been gradually improved, and water resources
management has achieved remarkable results. Based on the data released from the 2001-2017 Water
Resources Bulletin of Pearl River Basin, this paper systematically analyzes the total water use and main water
use efficiency indicators of the water resources secondary area and provincial administrative area in the basin,
and the trend of it also been revealed. In summary, this study aims to provide the watershed management
agency with a reference for the better implementation of the MSWMP in the future.
1 INTRODUCTION
Water is one of the basic resources for social and
economic development. From the perspective of
China's historical development process, the water
resources development and utilization mode has
gradually shifted from extensive high-water
consumption and high pollution mode to water-
saving priority sustainable development mode. In
order to better promote the rational, orderly and
sustainable development and utilization of regional
water resources (Wang, 2015; Liu, 2012; Men, 2018),
the state has put forward the most stringent water
resources management system, formulated an
insurmountable red line for the total water use and
water use efficiency of regional socio-economic
development, and prioritized water conservation and
building a water-saving society as the clearly defined
central water management policy of the 18th Party
Congress (Yong, 2015). In order to better promote the
implementation of the most stringent water resources
management system (Zuo, 2014), it is necessary to
explore the relatively weak links in regional water
resources management, and to study the changes in
the historical development trends of total water use
and water use efficiency in river basins and regions.
The Pearl River is the second largest river in
China. Its annual runoff ranks second in the national
river system, with a total length of 2320 km. The Pearl
River includes the three major tributaries of Xijiang
River, Beijiang River and Dongjiang River, and flows
through the provinces (districts) of Yunnan, Guizhou,
Guangxi, Guangdong, Hunan and Jiangxi. In addition
to the Pearl River Basin, the Pearl River Area
includes rivers along the coast of South China and
rivers in Hainan Island.
Based on the data of Water Resources Bulletin of
the Pearl River Area from 2001 to 2017, this paper
analyzes and summarizes the changing trend of the
total water use and main water use efficiency
indicators of the secondary water resources areas and
provincial administrative regions in the Pearl River
Area, and points out the relatively weak links in the
water resources management of the river basins,
which has certain reference value for watershed and
regional water resources management.
136
Wang, S. and Li, S.
Analysis on the Trend of Total Water Use and Water Use Efficiency in the Pearl River Basin During 2001-2017.
DOI: 10.5220/0011948600003536
In Proceedings of the 3rd International Symposium on Water, Ecology and Environment (ISWEE 2022), pages 136-143
ISBN: 978-989-758-639-2; ISSN: 2975-9439
Copyright
c
2023 by SCITEPRESS – Science and Technology Publications, Lda. Under CC license (CC BY-NC-ND 4.0)

2 OVERVIEW OF THE PEARL
RIVER AREA
2.1 Water Resources Component
The Pearl River Area includes the Pearl River Basin,
the Hanjiang River Basin, the coastal rivers of
Guangdong and Guangxi, and the rivers in Hainan
Province. Among them, the Hanjiang River Basin,
coastal rivers of Guangdong and Guangxi, and the
rivers in Hainan Province are jointly called the
Coastal Rivers of South China. The whole river
system is divided into 10 secondary water resources
areas, including North and South Panjiang River
(NSPJ), Hongliujiang River (HLJ), Yujiang River
(YJ), Xijiang River (XJ), Beijiang River (BJ),
Dongjiang River (DJ), Pearl River Delta, Hanjiang
and eastern Guangdong Rivers (HGRs), Coastal
Rivers of West Guangdong and South Guangxi
(GGCRs), Rivers in Hainan and South China Sea
Islands (SCIRs), of which the HLJ has a maximum
area of 113,000 km
2
and Pearl River Delta has a
minimum area of 27,000 km
2
. According to
administrative division, the river system involves 8
provinces (or autonomous regions) of Yunnan,
Guizhou, Guangxi, Guangdong, Hunan, Jiangxi,
Fujian and Hainan, and two special administrative
regions of Hong Kong and Macao.
2.2 Precipitation
The average annual precipitation of the Pearl River
Area is 8948.5×10
8
m
3
(1956-2000 series, based on
the evaluation results of the second national water
resources investigation), which is equivalent to a
depth of 1549 mm. In comparison, the average
precipitation from 2001 to 2017 is 9071.9×10
8
m
3
,
which is equivalent to a depth of 1570 mm. The
overall difference is only about 1.4%. Generally, the
average precipitation in the Pearl River Area in recent
17 years is close to the perennial average value, but
the average precipitation in some secondary water
resources areas and administrative regions in recent
15 years is quite different from the perennial average
value (table 1). Among them, the average
precipitation in the NSPJ area in recent 17 years is
8.5% less than the perennial average value, and the
average precipitation in Hainan Island in recent 15
years is 12.9% more than the perennial average value.
There is a great difference between the average
precipitation in recent 17 years and the perennial
average value in each province (table 2). For
example, the average precipitation in Yunnan and
Guizhou provinces has decreased, while that in
Hainan has increased. The deviation is more than 5%.
Table 1: Comparison of average precipitation from 2001 to
2017 and perennial value for secondary water resources
areas within the Pearl River Area.
Secondary
water
resources
areas
Average
precipitation
from 2001
to 2017 (10
8
m
3
)
Perennial
value
(10
8
m
3
)
Deviation
ratio
NSPJ 862.7 943.3 -8.5%
HLJ 1645.1 1664.1 -1.1%
YJ 1035.3 1028.8 0.6%
XJ 1122.5 1081.2 3.8%
BJ 849.5 829.4 2.4%
DJ 472.7 471.9 0.2%
Pearl River
Delta
505.8 492.2 2.8%
HGRs 809.7 793.1 2.1%
GGCRs 1093.8 1047.0 4.5%
SCIRs 674.8 597.4 12.9%
Note: The perennial value in this paper refers to the series
from 1956 to 2000, which is based on the evaluation
results of the second national water resources
investigation.
Table 2: Comparison of average precipitation from 2001 to
2017 and perennial value for provincial administrative
regions within the Pearl River Area.
Administrativ
e regions
Average
precipitatio
n from 2001
to 2017
(10
8
m
3
)
Perennia
l value
(10
8
m
3
)
Deviatio
n ratio
Yunnan 557.3 625.0 -10.8%
Guizhou 721.5 773.2 -6.7%
Guangxi 3557.5 3468.8 2.6%
Guangdong 3216.1 3139.5 2.4%
Hainan 674.8 597.4 12.9%
Fujian 207.5 204.7 1.4%
Hunan 77.6 80.3 -3.3%
Jiangxi 59.6 59.6 0.0%
2.3 Water Resources Amount
The average annual runoff in the Pearl River Area is
4708.5×10
8
m
3
, which is equivalent to 815 mm in
depth. As for the secondary water resources areas:
390×10
8
m
3
in NSPJ, 904×10
8
m
3
in HLJ, 424×10
8
m
3
in YJ, 583 ×10
8
m
3
in XJ, 510 ×10
8
m
3
in BJ,
Analysis on the Trend of Total Water Use and Water Use Efficiency in the Pearl River Basin During 2001-2017
137

510×10
8
m
3
in DJ, 281×10
8
m
3
in Pearl River Delta,
458×10
8
m
3
in HGRs, 581×10
8
m
3
in GGCRs, and
304×10
8
m
3
in SCIRs. By administrative division
(refers only to the provincial administrative regions
within the Pearl River Area), the average annual
runoff is: 229×10
8
m
3
in Yunnan Province, 382×10
8
m
3
in Guizhou Province, 1780×10
8
m
3
in Guangxi
Province, 1817 ×10
8
m
3
in Guangdong Province,
304 ×10
8
m
3
in Hainan Province, 116 ×10
8
m
3
in
Fujian Province, 48 ×10
8
m
3
in Hunan Province,
32×10
8
m
3
in Jiangxi Province.
From 2001 to 2017, the average water resources
amount in the Pearl River Area was 4842×10
8
m
3
and
the equivalent runoff depth was 838 mm, which was
similar to the 1956-2000 series. However, there were
some differences in water resources amount among
the sub-regions. The amount of water resources in
each sub-region from 2001 to 2017 was compared
with the perennial average value, and the number of
wet, normal and dry years in recent 17 years was
counted. The results of the division by secondary
water resources areas and provinces are shown in
table 3 and table 4, respectively.
It can be seen that the difference in water
resources amount between the 17-year series mean
and the perennial value in each sub-region is related
to the number of wet, normal and dry years. There are
more dry and extra-dry years in NSPJ basin, Yunnan
and Guizhou provinces, and more wet and extra-wet
years in XJ basin and Hainan Island.
Table 3: Comparison of average water resources amount from 2001 to 2017 and perennial value for secondary water resources
areas within the Pearl River Area, and the statistics on Wet-dry of runoff series.
Secondary
water resources
areas
Average
value of
2001-2017
(10
8
m
3
)
Perennial
value of
1956-2000
(10
8
m
3
)
Deviation
ratio
Extreme
wet
wet normal dry
Extreme
dry
NSPJ 326 390 -16.5% 0 1 6 3 7
HLJ 902 904 -0.3% 3 2 6 4 2
YJ 418 424 -1.3% 3 2 4 4 4
XJ 661 583 13.2% 7 4 4 0 2
BJ 528 510 3.4% 3 5 4 3 2
DJ 271 274 -1.1% 3 2 6 1 5
PRD 292 281 4.1% 5 2 6 2 2
HGRs 475 458 3.9% 4 2 6 2 3
GGCRs 602 581 3.6% 4 3 5 2 3
SCIRs 368 304 21.1% 9 1 4 0 3
Table 4: Comparison of average water resources amount from 2001 to 2017 and perennial value for administrative regions
within the Pearl River Area, and the statistics on Wet-dry of runoff series.
Administrative
regions
Average
value of
2001-2017
(10
8
m
3
)
Perennial
value of
1956-2000
(10
8
m
3
)
Deviation
ratio
Extreme
wet
wet normal dry
Extreme
dry
Yunnan 194 229 -15.3% 1 1 4 4 7
Guizhou 355 382 -7.2% 1 1 8 5 2
Guangxi 1860 1780 4.5% 5 2 6 1 3
Guangdong 1865 1817 2.6% 5 1 6 4 1
Hainan 368 304 21.1% 9 1 4 0 3
Fujian 119 116 2.6% 5 1 6 0 5
Hunan 50 48 2.5% 4 2 4 5 2
Jiangxi 32 32 1.3% 3 2 7 0 5
ISWEE 2022 - International Symposium on Water, Ecology and Environment
138
3 ANALYSIS OF TOTAL WATER
USE AND ITS TREND
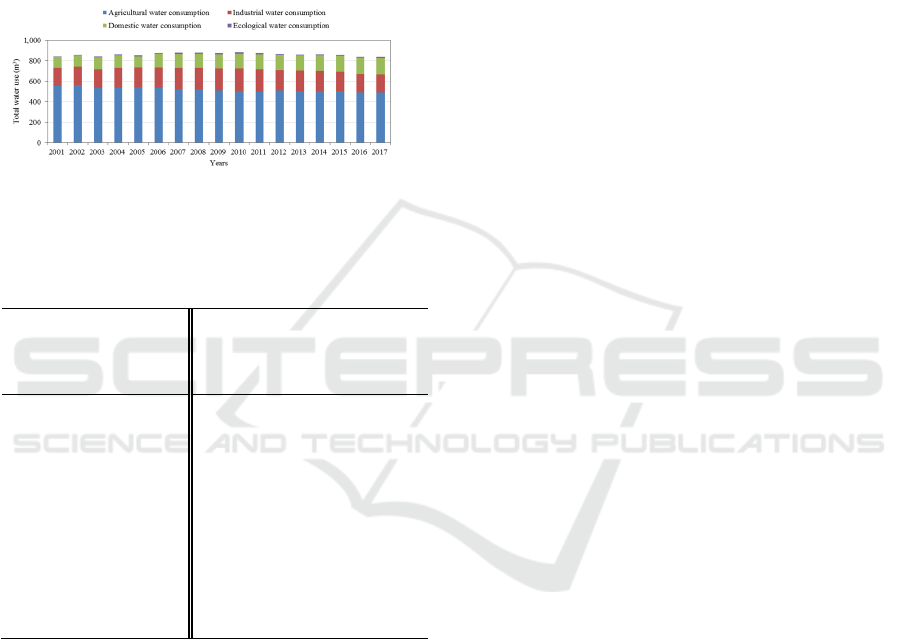
From 2001 to 2017, the average total water supply
and consumption in the Pearl River Area was
861.5×10
8
m
3
, and the total water use in the basin
area increased first and then decreased (figure 1). The
total amount of water supply and consumption in the
Pearl River Area from 2001 to 2017 is shown in table
5.
Figure 1: Schematic diagram of total water use in the Pearl
River Area from 2001 to 2017.
Table 5: Total water use in the Pearl River Area from 2001
to 2017.
Years
Total water
supply and
consumption
(10
8
m
3
)
Years
Total water
supply and
consumption (10
8
m
3
)
2001 838.2 2010 883.4
2002 851.9 2011 877.8
2003 840.1 2012 864.8
2004 861.1 2013 859.3
2005 873.6 2014 861.6
2006 878.9 2015 857.2
2007 879.9 2016 838.1
2008 881.2 2017 836.2
2009 876.8 Average 861.5
From the perspective of secondary water
resources areas: the total amounts of water use in XJ
area, Pearl River Delta area, HLJ area and DJ area
generally show the trend of rising first and then
falling; BJ area shows a trend of slow decline; YJ area
shows an obvious upward trend in water use in the
early stage, and water use has been relatively stable
in the past 10 years; the total water use in GGCRs and
SCIRs areas is relatively stable; and the total water
use in HGRs shows a slow upward trend as a whole.
From the perspective of provincial
administrative regions, the total amounts of water use
in Guangdong, Yunnan and Guizhou provinces have
generally increased first and then decreased. Among
them, Guangdong and Yunnan provinces have seen a
significant decline since 2011; the peak water
consumption in Guizhou Province appeared in 2010,
and the downward trend after 2012 is more obvious;
the total water consumption in Guangxi Autonomous
Region has generally increased first and then
decreased, and the downward trend is slower; the total
water consumption in Fujian and Jiangxi provinces
showed a slow upward trend; and the total water
consumption in Hunan Province was relatively stable.
4 ANALYSIS OF WATER
EFFICIENCY INDICATORS
4.1 Per Capita Comprehensive Water
Consumption
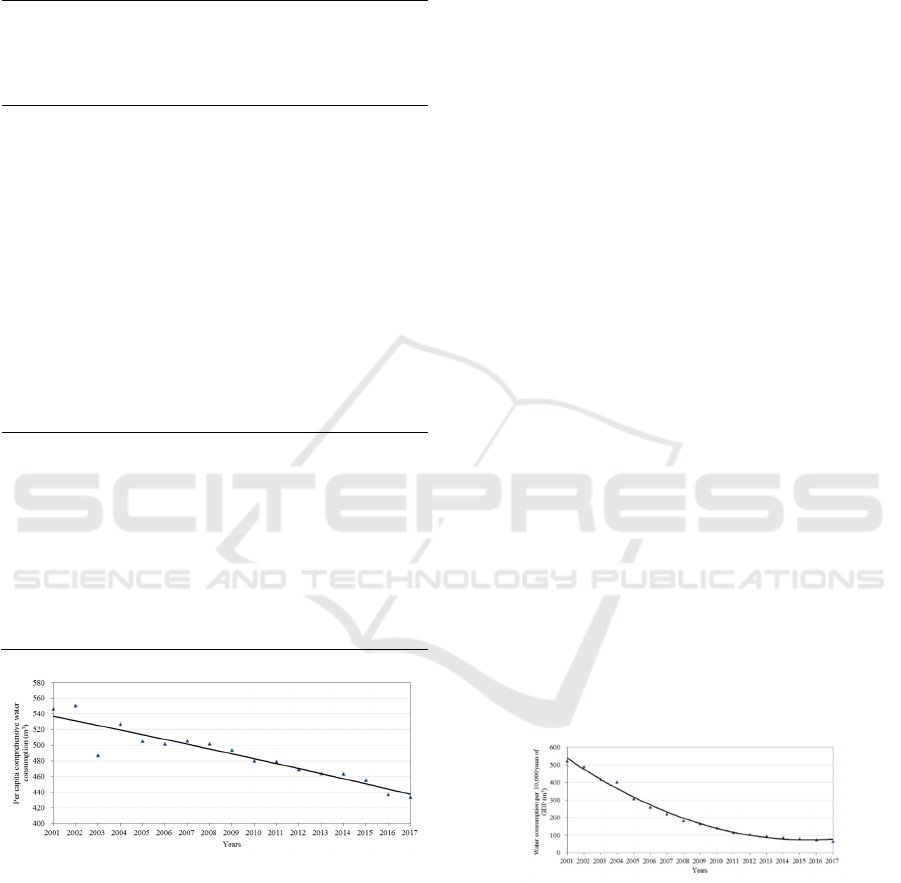
Since 2001, the per capita water consumption in the
Pearl River Area has generally declined (figure 2).
The average per capita comprehensive water
consumption of the basin area has decreased from 547
m
3
in 2001 to 434 m
3
in 2017. On the one hand, the
total water use in the basin area has generally declined
slowly. On the other hand, the population in the basin
area has grown rapidly. Water use indicators for some
years in the basin area are shown in table 6.
From the perspective of secondary water
resources areas: the per capita comprehensive water
consumption indicators of NSPJ area, XJ area, HGRs
area, and GGCRs area have generally changed little;
the per capita comprehensive water consumption
indicators of HLJ area and YJ area have increased to
a certain extent; the per capita comprehensive water
consumption indicators of BJ area, DJ area, Pearl
River Delta area, and SCIRs area have declined
significantly.
From the perspective of provincial
administrative regions, the per capita comprehensive
water consumption in Yunnan, Guangdong, Hainan
and Hunan provinces showed a downward trend; the
per capita comprehensive water consumption in
Guizhou, Guangxi, Fujian and Jiangxi provinces
showed an upward trend.
According to the indicators of 2017, the per
capita comprehensive water consumption in HLJ
area, YJ area, XJ area and BJ area is higher than 500
m
3
, while the per capita comprehensive water
consumption in NSPJ area, DJ area and Pearl River
Delta area is lower than 400 m
3
. Among the provinces
and regions, the per capita comprehensive water
consumption of Guangxi and Fujian is relatively high,
Analysis on the Trend of Total Water Use and Water Use Efficiency in the Pearl River Basin During 2001-2017
139
with Fujian reaching 734 m
3
, while Yunnan and
Guizhou have relatively low indicators.
Table 6: Changes in the per capita comprehensive water
consumption indicators in the Pearl River Area (m
3
).
Water
resources areas
or
administrative
re
g
ions
2001 2005 2010 2015 2017
NSPJ 282 277 271 286 291
HLJ 505 570 558 600 554
YJ 512 530 622 607 576
XJ 617 675 662 606 559
BJ 626 618 585 552 542
DJ 623 481 446 365 344
Pearl River
Delta
988 554 441 393 365
HGRs 374 364 399 366 354
GGCRs 483 490 490 476 474
SCIRs 566 538 511 503 492
The Pearl River
Area
547 505 480 455 434
Yunnan 334 315 257 279 284
Guizhou 217 213 259 295 323
Guangxi 595 625 647 618 577
Guangdong 589 499 449 408 388
Hainan 566 538 511 503 492
Fujian 707 621 1181 811 734
Hunan 520 360 429 413 423
Jiangxi 289 317 293 476 485
Figure 2: Schematic diagram of the trend of per capita
comprehensive water consumption in the Pearl River Area
from 2001 to 2017.
4.2 Water Consumption per 10,000
Yuan of GDP
From the overall perspective of the basin area, the
water consumption per 10,000 yuan of GDP showed
a significant downward trend from 2001 to 2017. The
average value of water consumption per 10,000 yuan
of GDP in the basin area was 522 m
3
in 2001 and
decreased to 64 m
3
in 2017 (table 7). The changing
trend of water consumption per 10,000 yuan of GDP
in the Pearl River Area from 2001 to 2017 is shown
in figure 3.
From the perspective of secondary water
resources areas, the water consumption per 10,000
yuan of GDP in the 10 secondary water resources
areas within the Pearl River Area has been greatly
reduced. In terms of absolute value of the indicators,
the water consumption per 10,000 yuan of GDP in
Pearl River Delta area is far less than that of other
water resources areas in the same year, which reflects
the remarkable effect of water saving work in the
water resources areas.
From the perspective of provincial
administrative regions, the water consumption per
10,000 yuan of GDP in 8 provinces and regions
within the Pearl River Area has been greatly reduced.
In terms of absolute value of the indicators, the water
consumption per 10,000 yuan of GDP in Guangdong
Province is far less than that in other provinces and
regions, followed by Yunnan and Guizhou, while the
water consumption per 10,000 yuan of GDP in the
area of Jiangxi Province within the Pearl River Area
is the highest due to the large proportion of
agriculture.
From the perspective of indicators in 2017,
among the secondary water resources areas, the water
consumption per 10,000 yuan of GDP in HLJ area, YJ
area and XJ area is relatively high, while the water
consumption per 10,000 yuan of GDP in DJ area and
Pearl River Deltas area is relatively low. From the
perspective of provincial administrative regions, the
water consumption per 10,000 yuan of GDP of
Jiangxi Province is the highest, while that of
Guangdong Province is the lowest.
Figure 3: Schematic diagram of the changing trend of water
consumption per 10,000 yuan of GDP in the Pearl River
Area from 2001 to 2017.
ISWEE 2022 - International Symposium on Water, Ecology and Environment
140
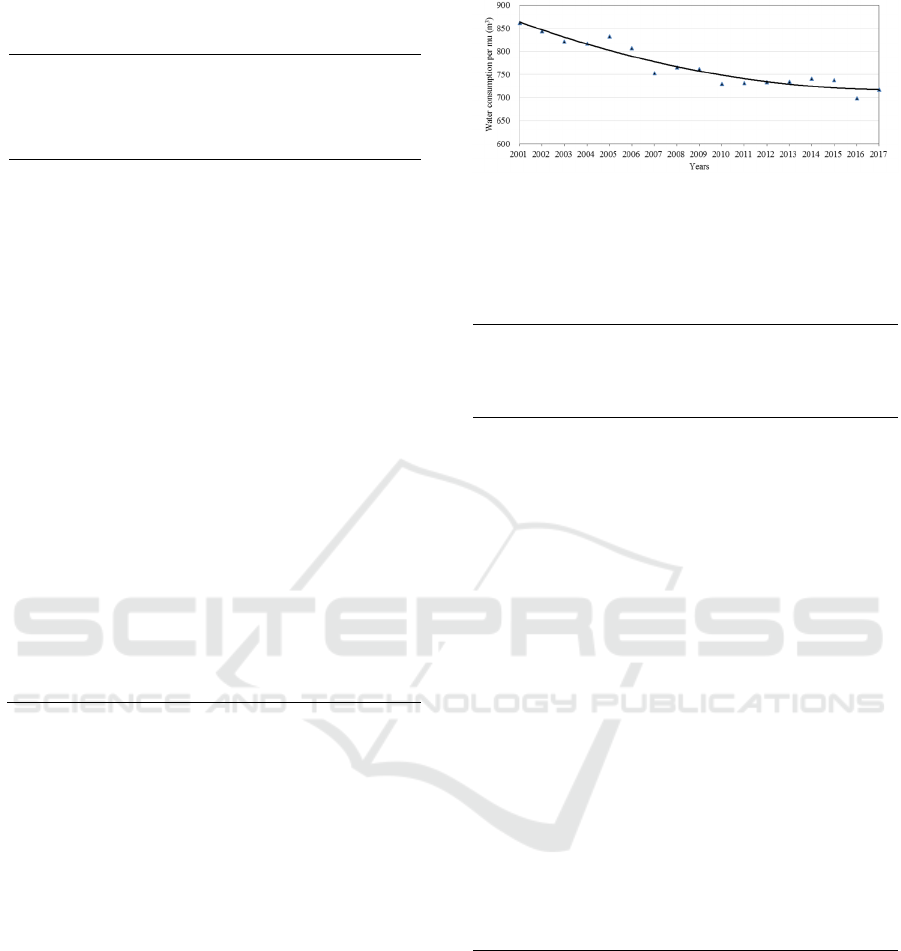
Table 7: Changes in the water consumption per 10,000 yuan
of GDP in the Pearl River Area (m
3
).
Water
resources
areas or
administrative
regions
2001 2005 2010 2015 2017
NSPJ 528 324 168 82 73
HLJ 1214 789 311 189 147
YJ 992 625 291 150 119
XJ 1035 780 337 189 153
BJ 1068 659 225 140 119
DJ 333 183 100 50 37
Pearl River
Delta
249 133 61 34 28
HGRs 556 398 197 111 89
GGCRs 739 501 225 126 100
SCIRs 787 487 216 124 102
The Pearl
River Area
522 307 141 80 64
Yunnan 460 304 138 83 75
Guizhou 822 437 252 92 86
Guangxi 1206 763 313 175 136
Guangdong 368 211 99 56 45
Hainan 787 487 216 124 102
Fujian 1158 638 310 125 92
Hunan 1370 503 374 145 121
Jiangxi 991 634 269 225 187
4.3 Water Consumption per Mu
From 2001 to 2017, the average gross water
consumption per mu (a unit of area, equals to 0.0667
hectares) in the basin area showed a downward trend.
The fluctuation between years mainly came from the
influence of annual precipitation. The decrease of the
average water consumption per mu was generally due
to the improvement of water saving level in
agriculture and the increase of irrigation coefficient
of farmland water year by year. Because of the
difference of regional climate conditions and planting
structure, the horizontal comparability of water use
per mu between different water resources areas and
administrative regions is not high, so no comparison
is made. The variation trend of water consumption per
mu in the Pearl River Area from 2001 to 2017 is
shown in figure 4. The specific statistics are shown in
table 8.
Figure 4: Schematic diagram of the changing trend of water
consumption per mu in the Pearl River Area from 2001 to
2017.
Table 8: Changes in the water consumption per Mu in the
Pearl River Area (m
3
).
Basis of
division
Water
resources
areas or
administrative
regions
2001 2005 2010 2015 2017
Secondary
water
resources
areas
NSPJ 520 533 360 359 357
HLJ 849 922 757 728 691
YJ 921 949 838 793 721
XJ 973 1003 966 864 825
BJ 809 777 709 689 708
DJ 972 825 740 756 747
Pearl River
Delta
800 815 632 724 741
HGRs 893 841 793 749 752
GGCRs 897 868 818 818 786
SCIRs 1033 618 552 995 1000
The Pearl
River Area
862 832 730 738 717
Administrative
regions
Yunnan 487 507 308 333 330
Guizhou 585 601 480 399 398
Guangxi 995 1042 907 869 807
Guangdong 834 803 751 753 756
Hainan 1033 618 552 995 1000
Fujian 938 759 725 652 639
Hunan 713 557 504 532 517
Jiangxi 468 531 413 522 564
4.4 Water Consumption of Industrial
Added Value per 10,000 Yuan
From 2001 to 2017, the industrial added value per
10,000 yuan in the Pearl River Area decreased
substantially, mainly benefiting from the guidance of
the national industrial policy and the gradual
withdrawal of high water consumption and high
pollution industries gradually. Meanwhile, the water
consumption per unit product was also decreasing due
to technological progress. The changing trend of
water consumption of industrial added value per
Analysis on the Trend of Total Water Use and Water Use Efficiency in the Pearl River Basin During 2001-2017
141
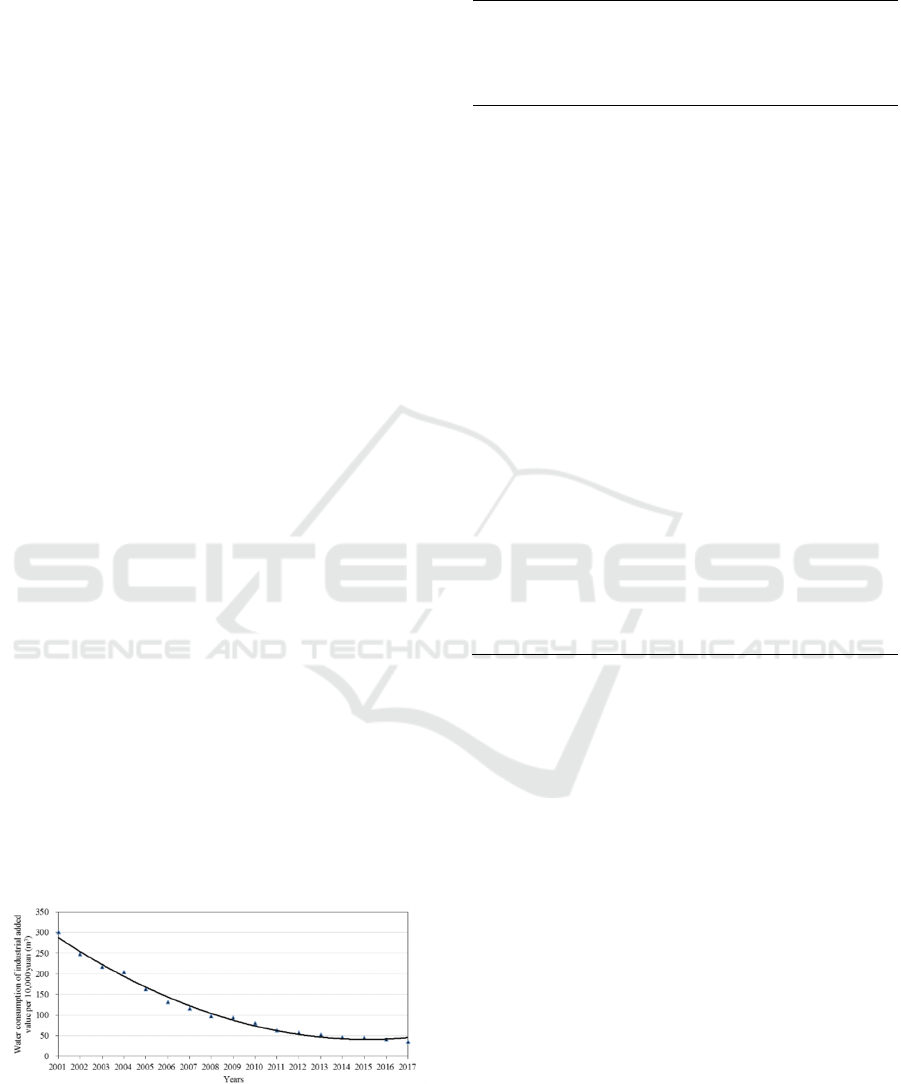
10,000 yuan in the Pearl River Area from 2001 to
2017 is shown in figure 5. The specific statistics are
shown in table 9.
Judging from the situation of the secondary water
resources areas, the water consumption of industrial
added value per 10,000 yuan has been greatly
reduced. The water consumption of industrial added
value per 10,000 yuan in DJ area, Pearl River Delta
area, and GGCRs area has been reduced to less than
40 m
3
in 2017. Although the indicators in HLJ area
and YJ area have also been greatly reduced, the water
consumption of industrial added value per 10,000
yuan in 2017 is still around 70 m
3
, which has not yet
fallen to the average level of the basin area in 2011.
Relevant areas should strengthen industrial policy
guidance, adjust regional industrial structure,
strengthen technological transformation, improve
water use efficiency and reduce water consumption
intensity.
From the perspective of provincial administrative
regions, in 2017, the water consumption of industrial
added value per 10,000 yuan in Guangdong Province
has fallen below 40 m
3
, and the efficiency of
industrial water use is relatively high; while in Fujian,
Guizhou, Guangxi and other provinces, the water
consumption of industrial added value per 10,000
yuan is still in a relatively high range, which means
that there is greater water-saving space and potential.
From the indicators of 2017, among the secondary
water resources areas, the water consumption of
industrial added value per 10,000 yuan in HLJ area
and YJ area is relatively high, while the water
consumption of industrial added value per 10,000
yuan in DJ area, Pearl River Delta area, and GGCRs
area is lower. From the perspective of provincial
administrative regions, Fujian, Guizhou, Guangxi and
other provinces have higher water consumption of
industrial added value per 10,000 yuan, while the
water consumption of industrial added value per
10,000 yuan in Guangdong Province and Yunnan
Province is lower.
Figure 5: Schematic diagram of the changing trend of water
consumption of industrial added value per 10,000 yuan in
the Pearl River Area from 2001 to 2017.
Table 9: Changes in the water consumption of industrial
added value per 10,000 yuan in the Pearl River Area (m
3
).
Water resources
areas or
administrative
regions
2001 2005 2010 2015 2017
NSPJ 520 533 360 359 357
HLJ 849 922 757 728 691
YJ 921 949 838 793 721
XJ 973 1003 966 864 825
BJ 809 777 709 689 708
DJ 972 825 740 756 747
Pearl River Delta 800 815 632 724 741
HGRs 893 841 793 749 752
GGCRs 897 868 818 818 786
SCIRs 1033 618 552 995 1000
The Pearl River
Area
862
832
730
738
717
Yunnan 241 125 74 39 41
Guizhou 226 351 263 88 68
Guangxi 667 356 148 88 59
Guangdong 202 135 64 35 28
Hainan 378 203 101 67 57
Fujian 520 478 227 102 57
Hunan 510 280 173 66 55
Jiangxi 471 164 78 60 40
5 CONCLUSION
Based on the basic data of the Pearl River Water
Resources Bulletin from 2001 to 2017, this paper
analyses the precipitation and water resources
situation in the basin area in the past 17 years, and the
changes of the total water use and some water use
efficiency indicators in the secondary water resources
areas and provincial administrative regions. This
paper summarizes the changing trend of indicators in
different areas of the river basin area, which has a
certain reference value for better promoting the
implementation of the most stringent water resources
management system and the improvement of
assessment indicators of water resources
management in relevant areas.
ISWEE 2022 - International Symposium on Water, Ecology and Environment
142

ACKNOWLEDGMENTS
This research was supported by the Special
Foundation for National Science and
Technology Basic Research Program of China
(2019FY101900), the National Natural Science
Foundation of China (5170929) and the Key
R&D Program of Guangxi Zhuang Autonomous
Region (902229136010).
REFERENCES
Xiaojun Wang, Jianyun Zhang, Shamsuddin Shahid, et al
2015 Demand Control and Quota Management Strategy
for Sustainable Water Use in China Environ Earth Sci
73 7403–7413
Jianguo Liu and Wu Yang 2012 Water Sustainability for
China and Beyond Science, 337 649-650.
Baohui Men and Huanlong Liu 2018 Evaluation of
Sustainable Use of Water Resources in the Beijing-
Tianjin-Hebei Region Based on S-Type Functions and
Set Pair Analysis Water 10(7) 925.
Yan Yong 2015 Implementing the Priority Policy of Water-
saving and Promoting the Construction of Water-saving
Society in an All-round Way Water Resources
Development Research 3(2) 3-6. (in Chinese)
Qiting Zuo, Runfang Jin, Junxia Ma, et al 2014 China
Pursues a Strict Water Resources Management System
Environ Earth Sci 72 2219–2222
Analysis on the Trend of Total Water Use and Water Use Efficiency in the Pearl River Basin During 2001-2017
143
