
Graphic-Analytical Method for Detecting the Relay Protection
False Tripping Zones
Pavel Pinchukov
a
and Svetlana Makasheva
b
Power Engineering Institute, Far East State Transport University, Seryshev Street, Khabarovsk, Russia
Keywords: Traction Power Supply System, Catenary Feeder, Relay Protection, R-X Diagram.
Abstract: The relay protection devices of a traction power supply system should work correctly and steadily to provide
uninterrupted traffic. High intensity of heavy haul traffic significantly increases a load on all elements of the
traction power supply system. Heavy haul traffic causes several problems in catenary feeder’s relay protection
operation. Increased currents values while the heavy haul traffic can reach values of short-circuit currents. In
this case, the relay protection devices will tripping false and switch off a supply line without any damages.
Unnecessary relay protection false tripping leads to a pause in heavy haul traffic and brings significant
financial loses. Experimental long-term observation suggests that the current relay protection detuning
technology is not well optimized and needs to be improved. Identification of operating conditions of the relay
protection devices at the particular railway section was clarified by current research. Proposed the graphic-
analytical method allows simplifying the relay protection detuning from the traction load characteristics. That
makes it possible to reduce the number of cases of the relay protection false operation. The method based on
the comparison between the real load areas and the installed relay protection characteristics. Examples of the
successful correction of protection parameters in order to tune out from the load zone are shown in details.
1 INTRODUCTION
It is difficult to overestimate that electricity is
critically important for a modern person’s life. The
electricity is an irreplaceable resource for human’s
needs for almost all types of activity. It is worth to
noting that a presence of electricity in modern
production processes is natural and familiar to all
consumers. In this regard it is of interest that, if the
consumers assess any prospects for development of a
production processes, they usually take as granted the
electricity existence and do not think about such
possibility problems with a power supply like a power
interruption or a poor power quality. At the same
time, power outages are perceived by consumers as
something out of the ordinary (Makasheva et al.,
2020).
Nevertheless, reliability and uninterrupted power
supply are two major conditions for economy and
efficient of production processes (Esen and Bayrak,
2017; Makasheva and Pinchukov, 2016). When an
emergency situation appears in a power supply
a
https://orcid.org/0000-0001-9461-6620
b
https://orcid.org/0000-0002-0329-3836
system, it is necessary to quickly eliminate an
accident and then restore the power supply.
Currently, a responsibility for timely
disconnection of a damaged part of an electrical
system is assigned to the relay protection (RP)
devices. In turn, the automatic reclosing devices are
in charge of the inclusion the undamaged part of
power supply system (Alstom, 2011; Ciufo and
Cooperberg, 2021; Hill, 1994; IEEE, 2016; Ma and
Wang, 2018). RP should respond only to a damage
that occurs in the protected area. To do this, relay
protection devices are assigned a strictly defined
algorithm and trigger conditions.
Also, it is important the RP devices to satisfy two
major requirements (Alstom, 2011; IEEE, 2016; Saha
et al., 2010):
Should trigger only while the emergency
modes, and disconnect only an area with a
damage;
Should not trigger in the load modes.
If the RP triggers in the load mode, the
undamaged area of the power supply system
Pinchukov, P. and Makasheva, S.
Graphic-Analytical Method for Detecting the Relay Protection False Tripping Zones.
DOI: 10.5220/0011947800003612
In Proceedings of the 3rd International Symposium on Automation, Information and Computing (ISAIC 2022), pages 397-404
ISBN: 978-989-758-622-4; ISSN: 2975-9463
Copyright
c
2023 by SCITEPRESS – Science and Technology Publications, Lda. Under CC license (CC BY-NC-ND 4.0)
397

disconnects and a forced consumers interruption
occurs up to the moment of automatic reclosing
operation. In some cases the power supply
interruption leads to power outages and a violation of
the operating conditions of electrical consumers.
Such a RP functioning is regarded as a false operation
and named as a false tripping (Alstom, 2011; IEEE,
2016; Saha et al., 2010).
Responsible consumers suffer from power
outages because even a short interruption in the
power supply can lead to the technological process
destroying, can associate with a risk tohuman life and
health, and can bring significant material losses
(Alstom, 2011; Mason, 1956; Saha et al., 2010). The
electric rolling stock of the AC electrified railways is
a very good example of the responsible consumer
which needs an uninterrupted power supply for a non-
stop transportation process. Taking into account
technical needs and importance of the railway
transport, the RP false tripping is unacceptable.
Concern for the PR false tripping was prompted
by increasing of incorrect RP functioning cases while
heavy hauling especially for Far Eastern Railways of
Russia (Pinchukov and Makasheva, 2019). It is
tempting to consider RP functioning in view of new
data from railway observation practice based on
automated monitoring systems (Andrusca et al.,
2021; Makasheva, 2016; Mariscotti, 2022).
Many researchers studied problems of
determining parameters of the RP devices as follows:
A wealth of information about the RP basic
theory and main principles of operating are
available now. For example, main calculations
of tripping zones parameters and relay settings
are given in (Ciufo and Cooperberg, 2021; Hill,
1994; IEEE, 2016);
New adaptive RP parameters for nowadays are
given in (Moyo et al., 2019; Sezi and Menter,
1999);
application examples of RP operation
algorithms for AC railway lines are shown in
(Han et al., 2012; Makasheva et al., 2020;
Pinchukov and Makasheva, 2019);
Protection aspects are described in (Andrusca
et al., 2021; Moyo et al., 2019) for the traction
power supply system operation under present
conditions for a normal mode and a short
circuit mode;
There is some intresting, but scanty
information, that the modern feeder distance
protection and overcurrent protection can not
successfully protect from short circuits, that is
discussed in (Andrusca et al., 2021; Han et al.,
2012).
There is no doubt that the RP devices
characteristics determinate by standard methods of
calculation and tuning. The methods do not take into
account the increased currents while the heavy haul
traffic, therefore, the RP devices with parameters
selected in such a calculated way, do not work
correctly. Thus, it was found from the mentioned
literary analysis, that most previously
recommendations are given in general terms and
cannot take into account the influence of the local
characteristics of the real railway lines, especially due
heavy haul traffic. As a result, there is no method for
identification the reasons of the RP false tripping. It
would be interesting to consider ways for identifying
the RP false tripping zones for reducing the number
of the RP incorrect operation.
The present study is aimed at the complex analis
of the RP false tripping problem and finding possible
ways to detuning the parameters of the RP devises
from the load mode especially due the heavy hauling.
To begin with, the causes leading to the RP false
tripping cases need to be investigated. Then, it can be
possible to exclude incorrect functioning leading to
disruption of the transportation process and power
supply interruptions. There is a definite possibility
that creation a method can be used in RP parameters
detuning.
The results of monitoring system's database
analisis offer a unique opportunity to apply this data
to the RP detuning process. Data processing from the
monitoring systems set at real railway sections will
allow taking into account the regional local
specificity. So, now it is possible to take into account
the regional component while RP detuning and to
propose a quite simple and understandable detuning
method
Finally, the method to identify zones of RP false
operation and to eliminate false tripping by adjusting
the RP parameters can be proposed. Also,the findings
can be useful for the RP developers who interested in
creating of new algorithms for RP operating under
overload conditions.
2 METHODOLOGY
The motivation of this research is to define a
framework and conditions for correct detuning the
AC catenary feeder’s RP devices from the load mode
due the heavy hauling. This encourages to reduce the
number of cases of the AC catenary feeder’s RP
devices due to a better choice of their parameters.
ISAIC 2022 - International Symposium on Automation, Information and Computing
398
The core of the research is the development of
method for graphic analysis of RP device parameters
and load parameters of a real railway section. The
facts of the existing theory were used as a basis for
testing the hypothesis that proposed technique for
analysis is suitable for the complex engineering task.
The detecting of the RP false tripping zones was
carry out by means of graphical analysis for the AC
railways power supply system. To begin with, one of
the inter-substation zones between the AC traction
substations was choosen. Then, the operation of RP
devices at 25 kV feeders catenary network at freight
direction was examined.
Statistic data from the monitoring systems
installed on the particular railway section have been
accumulated during the 2021-2022 years. During this
period, the intensity of heavy haul traffic increased by
by 1.25 times. Also, lots of cases when the well-
known algorithms for RP devices cease to work were
detected (Pinchukov and Makasheva, 2019).
The proposed methodology for decreasing the
amount of the RP false tripping at the AC catenary is
based on a five-step approach as follows:
Accumulation measured data from monitoring
system and their representing in the R-X
diagram;
Determination load characteristics of catenary
feeders for a particular inter-substation zone
while increasing traffic volumes and train
weights in the R-X diagram;
Representation the set RP characteristics for
particular feeder in the R-X diagram including
simulation results;
Identification areas of overlapping of
retractable RP parameters in the load zones
characteristics;
Detuning RP parameters from the load zones
characteristics.
The first step of the process refers to the
monitoring system data acquisition and analysis.
Based on the analysis of the feeder’s current and
voltage data with heavy hauling conditions it can be
possible to perform an initial step of analysis to
extract meaningful insights and transform into the
graphical view. Next, each step of the proposed
technique was expounded in the sections that follow.
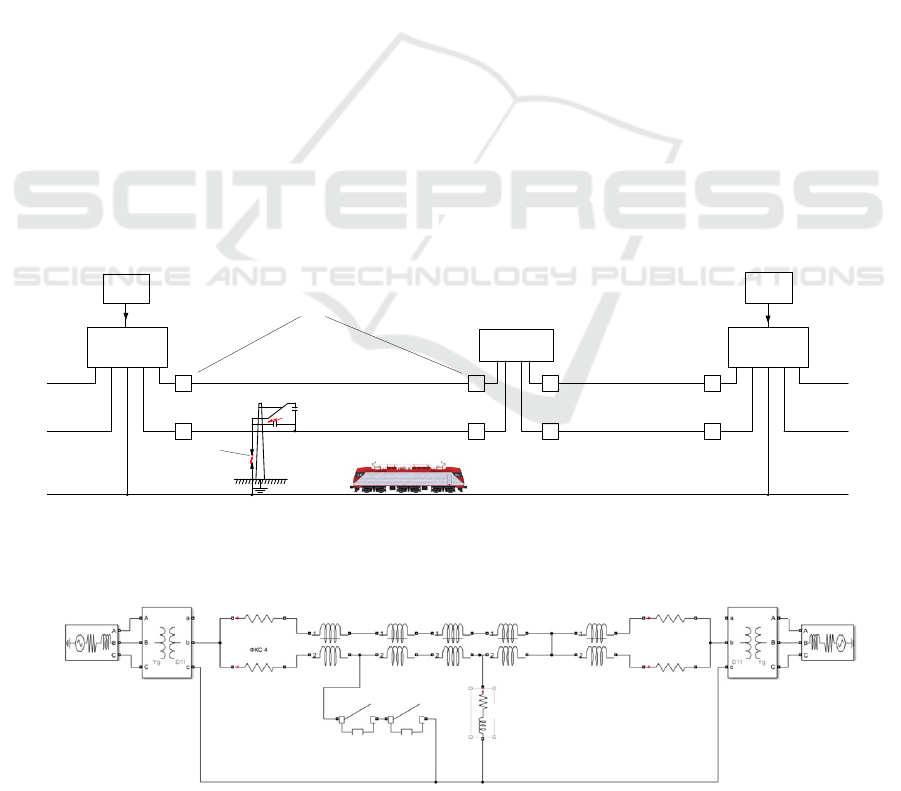
2.1 Research Object Structure
A particular section of the AC railway with installed
distance relay protection devices, as depicted in
Figure 1, was taken for further consideration as the
research object. The section is located on the eastern
freight direction of the Russian AC 25 kV electrified
railways.
Numbers from 1 to 8 in Figure 1 correspond to the
serial numbers of the protective set of relay protection
devices for the AC catenary feeders.
Traction
Substation 1
Traction
Substation 2
Sectioning
post
1
2
5
6
3
4
7
8
Power
System 1
Power
System 2
Second track’s catenary
Rail Circuit
Spark Gap
High-voltage breaker
First track’s catenary
Rail Circuit
Figure 1: AC 25 kV Electrified Railway Section.
Spark GapInsulator
Catenary Fider
(Track 1)
Catenary Fider
(Track 2)
Catenary Fider
(Track 1)
Catenary Fider
(Track 2)
Electric
rolling
stock
Traction
Substation 1
Traction
Substation 2
Power
System 2
Power
System 1
Figure 2: Simulation Model Scheme
Graphic-Analytical Method for Detecting the Relay Protection False Tripping Zones
399

2.2 Simulation Model
The simulation model of power supply system for AC
25 kV railway section ander consideration was
created by MATLAB-based graphical programming
environment Simulink 9.8 as shown in Figure 2.
As depicted in Figure 1 and 2 the section contains
AC traction network between two traction
substations. The model includes the equivalents of
two energy systems of limited capacity, two traction
substations, catenaries the first and second tracks, and
a rail circuit. The catenary pole is integrated into the
model for a short circuit simulation. It is possible to
simulate the breakdown of the cantilever insulator.
Also the model has the possibility to change the
operating mode of the spark gap. Simulation of
electric rolling stock is also provided. The model
allows to change both the location and power of the
electric rolling stock.
The model provides changing the parameters of
power systems and traction transformers at
substations. The results of the short-circuit mode
calculation are given for the power of 40 MVA
traction transformers at both traction substations. This
is the most common transformation power for traction
substations of AC electrified railways. The output
power of the power systems was setting in the range
from 1500 MVA to 2000 MVA that is closest to the
output power at a voltage of 110-220 kV nominal
level.
2.3 Data Acquisition and Analysis
The considered section has a automated system for
monitoring the parameters of normal and emergency
modes. All feeder’s measured data like voltage,
current and phase angle between them, are written to
the database in real-time mode (Makasheva, 2016).
The results full-scale measured and calculated
characteristics of the operating modes were put on the
R-X complex diagram. Thus, a data base from field
measurements in operating conditions for a load
mode was collected.
After that, the input resistances measured by RP
in short circuits mode were calculated. Then, data
were put on the R-X diagram as dots. Thus, the areas
at the R-X diagram that correspond to every single
measurement were completed. Next, the angular
characteristics of the distance protection zones while
RP tripping on the R-X diagram were put. After that,
the parameters of possible short circuits were
calculated based on simulation model and also put on
the same R-X diagram. Each time, step by step, new
data was gradually applied to the R-X diagram,
forming the so-called surface layers.
Finally, obtained three-layers R-X diagram makes
it possible to study the conditions of the RP
functioning and detect the RP false tripping causes.
3 RESULTS
Currently, the RP devices used at the considered
section of the AC railway contain four zones of
distance protection (DP) (Andrusca et al., 2021;
Moyo et al., 2019; Pinchukov and Makasheva, 2019).
Three of them react to metal short circuits at a
catenary feeder and have the pie-shape. The forth DP
zone has a quadrilateral shape. The forth zone reacts
to short circuits that occurs through a large contact
resistance. That can arise, for example, while a short
circuit occurs through a catenary pole body (Alstom,
2011; Saha et al., 2010). First and second zones are
used as main protections for the catenary feeder and
the third one reserves the adjacent protection in case
of their failure. An example of the step-by-step
constructing of R-X diagram with comprehensive
characteristic as a graph with several layers are
described below in details.
3.1 Two-Layer Diagram
Load parameters of the 25 kV catenary feeder were
measured experimentally in real operation conditions
for AC railway section at the most freight track. The
RP characteristics was calculated and analysed based
on the measured data. Based on the measured
characteristics of current, voltage and the phase angle
between them, the characteristics of the feeder’s relay
protection were calculated in a well-known way by
means of the classical method for calculating DP
characteristics as shown in (Alstom, 2011; IEEE.
2016; Saha et al., 2010).
RP input resistances in load mode are shown for
one of feeders in Figure 3. The field of red dots in
Figure 3 is consists of the values R-X characteristics
of the DP in the operating load mode. They are
obtained on the basis of the measured parameters. The
field forms the first layer of the R-X diagram, in other
words, the layer of the measured RP characteristics.
The second layer is formed by the angular
characteristics of the DP from the first to the fourth
zones, named in Figure 3 as ‘DP 1st zone’, ‘DP 2nd
zone’, etc. The protection zones were recommended
by manufacturers of RP terminals. Graphically, these
areas are shown as sectors bounded by colourful lines
in Figure 3.
ISAIC 2022 - International Symposium on Automation, Information and Computing
400
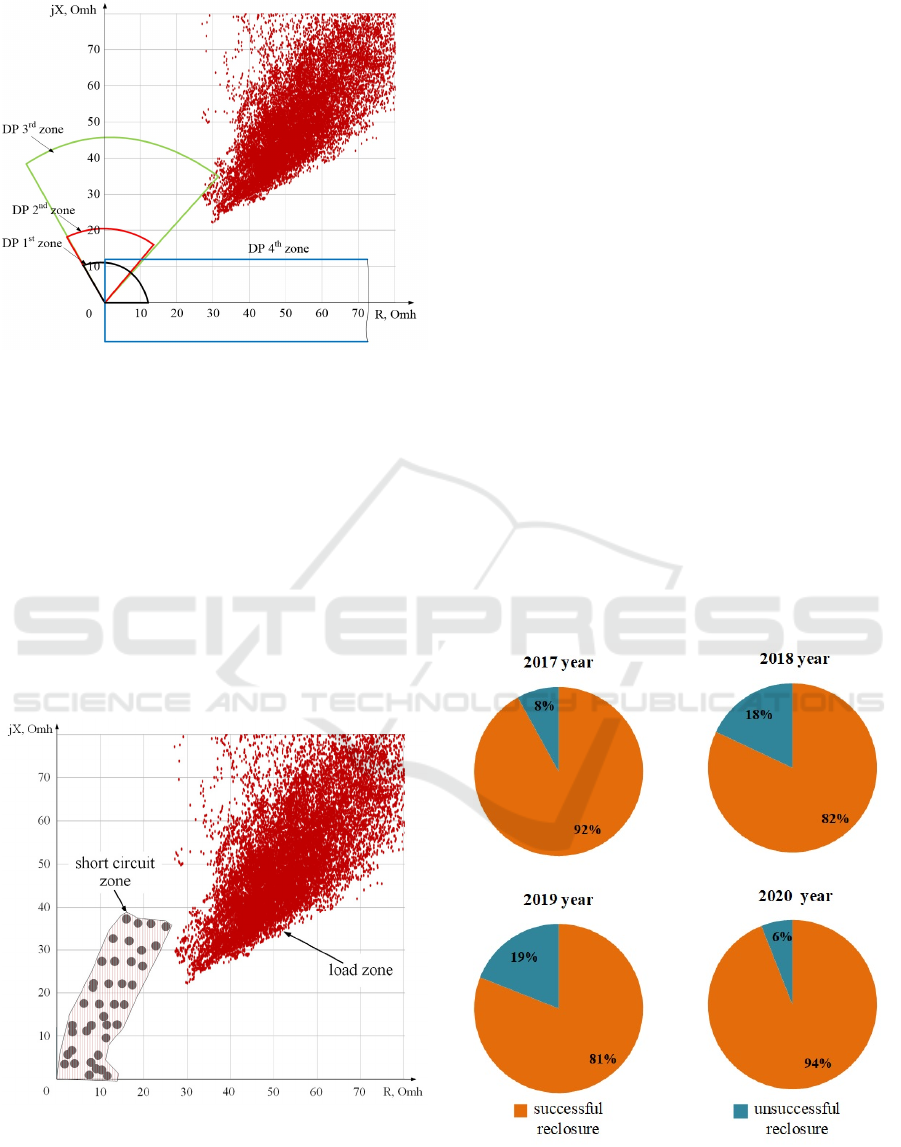
Figure 3: R-X Diagram for AC Catenary Feeder.
Thus, there are two layers were applied in Figure
3 as below:
The first layer is the measured characteristics
(as the area of red dots);
The second layer is the set distance protection
parameters adopted in operation (as the colored
pie sectors named DP).
In order to find out whether the DP was correctly
tuned from the load mode, it was needed to plot both
the load area and the short circuit area on the same R-
X diagram. As shown in Figure 4, there are two zones
in the R-X diagram.
Figure 4: Calculated Short Circuit and Measured Load
Mode Parameters.
The red dots area is named as the ‘load zone’.
Each red dot was measured by DP in the load mode
and then plotted to R-X diagram as the DP input
resistance value. The grey dots area is named as the
‘short circuit zone’. Each grey dot was calculated for
DP in the short circuits mode by means of simulation
modeling and the classical well-known calculation
method for the DP parameters (Alstom, 2011; IEEE.
2016; Saha et al., 2010).
Summary, both areas form the two-layer
superimposition at the same R-X diagram. As shown
in Figure 3 and 4, the short circuit zones and the load
zone do not overlap. Thus, the distance protection
should work correctly. Meanwhile, several cases of
the DP false operation have been recorded at the
feeder during the observation period. Operating
experience shows that the DP was tripped false not
once. Thereby, such analysis of Figures 3 and 4 does
not give a clear answer to the question why the RP
false operation still occurs. Further, to find out the
answer, it will be also necessary to analyze the
operation of automatic reclosing devices.
3.2 Number and Causes of Automatic
Reclosing Trips
The statistics facts of automatic reclosing (AR) in
cases of RP devices tripping for the feeder under
consideration for last 4 years were collected and
analyzed. The results are shown as pie chart-
diagrams in Figure 5.
Figure 5: Number of Automatic Reclosing Trips.
The pie chart diagrams in Figure 5 allow
interpreting the actions of the AR and the RP devices
Graphic-Analytical Method for Detecting the Relay Protection False Tripping Zones
401

in relation to load and emergency modes. In order to
find out the causes of false tripping, it is necessary to
consider a number of characteristics that can be
probably added as the third layer to the previously
constructed two-layer R-X diagram.
3.3 Three-Layer Diagram
The third layer was formed from the angular
characteristics of the DP zones, shown in Figure 6 as
colored lines.
The green line in Figure 6 is indicated the angular
characteristic of the DP 3th zone, which is currently
being operated on the feeder under consideration. The
red line is indicated the characteristic that is
recommended by manufacturers of RP terminals to
increase the efficiency and stability of their setting.
Figure 6 shows two angular characteristics of the
DP third zone. The green sector in Figure 6 is a DP
characteristic which is used on the catenary feeder.
Figure 6: Three-Layer Diagram.
This type of distance protection is used on the
entire Russian AC railway network. As shown in
Figure 6 there is practically no margin between the
zone of red dots and the zone limited by the green
sector. It means that there is no DP detuning from the
load zone. Thus, the common third DP zone’s
characteristic does not provide DP detuning from the
load zone.
So, when the third layer was applied to the R-X
diagram, it can be possible to finally identify the zone
of RP false tripping. It is shown in Figure 6 as the
purple oval. Also, the sector circled in red in Figure 6
is the DP characteristic which could provide detuning
from the load area.
Such a quadrangular characteristic is one of the
types of distance protection, which is used in power
systems. There are no devices in Russia with such
characteristics for catenary feeders. Therefore, their
development for areas with high load currents is
extremely important especially due heavy hauling.
4 DISCUSSION
Using the full-scale measurements and simulation
results as input data, it is possible to graphically
evaluate the RP characteristics for their better
detuning from the load modes.
The findings gave reason to suggest that the two-
layer R-X diagram does not able to qualitatively
figure out the relay protection parameters for
detuning from the load area. Therefore, the
assumption of the third layer applying’s advisability
gave a positive effect.
As Figures 1, 2 and 3 show, the main part of the
resistance values is concentrated in the first quarter of
the Cartesian coordinate system. They form areas
with the angles from 30 to 50 degrees. Therefore, the
first quadrant of the complex resistance plane was
limited for better clarity and understanding.
Notoriously, that automatic reclosure is used to
recover the original status of the network. Obtained
data point to facts, that after the successful automatic
reclosure, the voltage is reapplied to the contact
network both in the event of unstable short circuits
and in the event of a false tripping of the relay
protection. In most cases, the main reason for false
RP operation is the RP response to a significant
current load in normal mode.
As follows from Figure 5, the percentage of cases
of successful automatic reclosure for the investigated
feeder was over 80 percent during all four years. The
specified share of the successful automatic reclosure
is not typical for similar sections of AC railways that
have lower load intensity as described in (Han et al,
2012; Hill,1994.).
A significant percentage of successful automatic
reclosure indicates that automatic reclosing does not
occur in emergency mode, but in load mode. That
proves the absence of RP detuning from the load
mode. Accordingly, our findings clearly show the
existing problem in the mechanisms of detuning the
RP parameters from the load characteristics of inter-
substation zones with heavy haul traffic at the 25 kV
power supply system of the railway transport. Thus,
the observation of lots of successful AR cases also
constitutes the evidence that the reason of big
percentage is the RP false tripping.
Next, it was proposed to use the graph-analytical
method to analyse the reasons for the RP false
tripping. After preparation and selection of
measurement data, the two-layer R-X diagram was
ISAIC 2022 - International Symposium on Automation, Information and Computing
402

created, but it was found, that the two-layer diagram
does not allows immediately identify the reason of the
RP false tripping.
Thus, the problem was solved by simultaneously
considering all characteristics on unified R-X
diagram. Consequently, the shortcoming in the
currently used DP characteristic at catenary feeders
was identified. It was clearly proved that with the
heavy traffic and a further loads increasing, it is
almost impossible to ensure reliable DP detuning
from the load area.
As a result, the proposed graphic-analytical
method for detecting the relay protection false
tripping zones makes it possible to evaluate the
efficiency of the form of the DP angular
characteristic. The described method’s application
can be recommended on heavy haul traffic AC
railways areas of with AC/DC electric locomotives.
At the same time, the described method can be
also used for the RP detuning for power supply lines
of industrial or agricultural enterprises with similar
problems. To continue and develop research in this
direction it is advisable to use the considered
mechanisms to reduce the amount of RP false tripping
in the long term.
5 CONCLUSIONS
The results obtained in the present research
demonstrate that visualization and graphical analytics
can be applying for solving the specific engineering
task. Current results proposed a framework for
analyzing PR detuning and elimination of the RP
false tripping.
The obtained results lead to the following
conclusions:
The electrical characteristics of catenary
feeders from monitoring systems databases and
revealed an increase in loads during heavy haul
traffic were collected and analyzed
From the automatic reclosing cases analysis it
was confirmed that the automatic reclosing
does not occur in emergency mode, but in load
mode;
Shortcomings of the applied DP type while the
heavy haul traffic were highlighted and
explained by visual means with a high
probability;
New method for visually determination zones
of the load, the short circuit and the DP angular
characteristics was proposed and described in
details;
It was found out that the existing DP devices
are almost impossible to detuning from the load
area in the conditions of the heavy traffic
increasing, therefore, an urgent need has been
identified for the development of new RP types
for the catenary feeders as soon as it possible.
The practical benefit of the proposed method lies
in its application to tasks of analyses the AC railway
catenary feeder protection. The proposed method will
further develop in the direction of improving the
distance relay protection detuning from the load
zones in relation to the existing and planned AC
railways’ sections.
ACKNOWLEDGEMENTS
This paper was made possible by Russian Railways
JSC as grant No.4663593 dated December 27, 2021.
The statements made herein are solely the
responsibility of the authors.
REFERENCES
Alstom, 2011. Network protection & automation guide:
Protective relays, measurement & control. Stafford,
England, 2
nd
edition.
Andrusca, M., Adam, M., Dragomir, A., Lunca, E. 2021.
Innovative integrated solution for monitoring and
protection of power supply system from railway
infrastructure. Sensors, No. 21(23):7858.
https://doi.org/10.3390/s21237858
Ciufo, J., Cooperberg, A. 2021. Power system protection:
fundamentals and applications. John Wiley & Sons,
Ltd. https://doi.org/10.1002/9781119847397
Esen. Ö., Bayrak, M., 2017. Does more energy
consumption support economic growth in net energy-
importing countries? Journal of Economics, Finance
and Administrative Science. Vol. 22 No. 42, pages 75-
98. Emerald Publishing Limited.
Han, Z., Dong, Z., Gao, S., Bo, Z. 2012. Protection scheme
for out-of-phase short-circuit fault of traction feeding
network. 11th IET International Conference on
Developments in Power Systems Protection (DPSP
2012), pages 1-4.
https://doi.org/10.1049/cp.2012.0133https://doi.org/10
.1108/JEFAS-01-2017-0015
Hill, R. 1994. Electric railway traction. Part 3. Traction
power supplies. Power Engineering Journal. No.8(6):
275–286. https://doi.org/10.1049/pe:19940604
IEEE, 2016. Guide for protective relay applications to
transmission lines. (Revision of IEEE Std. C37.113-
1999), pages 1-141.
https://doi.org/10.1109/IEEESTD.2016.7502047
Graphic-Analytical Method for Detecting the Relay Protection False Tripping Zones
403
Ma, J., Wang, Z. 2018. Basic theories of power system relay
protection. Hierarchical protection for smart grids.
John Wiley & Sons, Ltd.
https://doi.org/10.1002/9781119304814.ch1
Makasheva, S. 2016. An automated monitoring system as
an instrument of lean production of a traction power
supply system. Russ. Electr. Engin. No.87, pages 107-
109. https://doi.org/10.3103/S1068371216020139
Makasheva, S., Pinchukov, P., 2016. Cost reduction ability
by electricity tariff selection for construction facilities
located in non-price areas. MATEC Web Conf., 86:
05025.
https://doi.org/10.1051/matecconf/20168605025
Makasheva, S., Pinchukov, P., Kostin, A. 2020. Increasing
the functional stability of distance relay protection for
various types of catenary support grounding. In:
Popovic, Z., Manakov, A., Breskich, V. (eds) VIII
International Scientific Siberian Transport Forum.
TransSiberia 2019. Advances in Intelligent Systems and
Computing, Vol. 1115. Springer, Cham.
https://doi.org/10.1007/978-3-030-37916-2_17
Makasheva, S., Pinchukov, P. Szoltysek, J. 2020. The
power quality as a pretext for developing smart city
concepts. In 2020 International Multi-Conference on
Industrial Engineering and Modern Technologies
(FarEastCon), pages 1-7,
https://doi.org/10.1109/FarEastCon50210.2020.92714
62
Mariscotti, A. 2022 Non-intrusive load monitoring applied
to AC railways. Energies, No.15: 4141
https://doi.org/10.3390/en15114141
Mason, C. 1956. The art and science of protective relaying.
Wiley, New York, 1
st
edition.
Moyo, N., Bansla, R., Naidoo, R., Sprong, W. 2019. Line
impedance measurement to improve power systems
protection of the Gautrain 25 kV autotransformer
traction power supply system. IEEE Access No.7, pages
136962–136974.
https://doi.org/10.1109/ACCESS.2019.2940894
Pinchukov, P., Makasheva, S. 2019. Research of AC
traction network's relay protection operating under
heavy haul traffic conditions. IOP Conf. Ser.: Earth
Environ. Sci. No. 272: 022069
https://doi.org/10.1088/1755-1315/272/2/022069
Saha, M., Izykowski, J., Rosolowski, E. 2010. Fault
location on power networks, Springer, London
https://doi.org/10.1007/978-1-84882-886-5
Sezi, T., Menter, F. 1999. Protection scheme for a new AC
railway traction power system. In 1999 IEEE
Transmission and Distribution Conference (Cat. No.
99CH36333) No.1 pages 388-393.
https://doi.org/10.1109/TDC.1999.755383
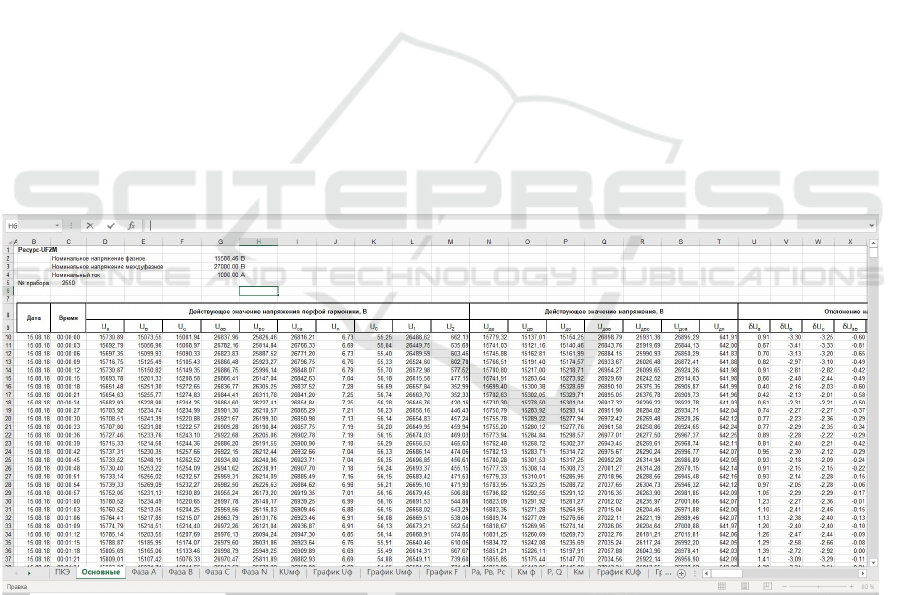
APPENDIX
Figure: Fragment of measurements electrical parameters’ database for the catenary feeder by the automatic monitoring
system.
ISAIC 2022 - International Symposium on Automation, Information and Computing
404
