
Research of Inflation Processes in Ukraine in Crisis Conditions
Volodymyr M. Shinkarenko
1 a
, Alexey M. Hostryk
1 b
and Larysa V. Shynkarenko
2 c
1
Odessa National Economic University, 8 Preobrazenska Str., Odessa, 65000, Ukraine
2
International Humanitarian University, 33 Fontanskaya Rd., Odessa, 65000, Ukraine
Keywords:
Consumer Price Index, Multiple Regression Equation, Inflation Rate.
Abstract:
The purpose of the article is a research of the level of inflation in Ukraine based on the analysis of the dynamics
of the annual consumer price index. In connection with the crisis phenomena in the economy, which are
the consequences of the COVID-19 pandemic and Russian military aggression, the problem of restraining
excessive price growth becomes the most important condition for the implementation of the socio-economic
and monetary policy of the state. The impact of macroeconomic indicators such as gross domestic product,
the hryvnia exchange rate against the US dollar, and the average wage in Ukraine on the growth of consumer
prices is studied. With the use of application packages, it is substantiated that the dynamics of the consumer
price index is characterized by a random component and cannot be approximated by elementary functions that
depend only on time. With the help of MS Excel spreadsheets, a mathematical model of the dependence of
the consumer price index on the rates of growth and decline of the main macroeconomic indicators was built
in the form of a multiple regression equation and its adequacy was proven. Based on the constructed model,
it was concluded that the exchange rate of the national currency has the greatest influence on the consumer
price index. The results of the study can be used in forecasting the annual inflation rate for the next period.
Forecasting of the consumer price index for 2022 was made based on the constructed model.
1 INTRODUCTION
The coronavirus pandemic and the quarantine restric-
tions aimed at containing it have had a negative im-
pact on the global and domestic economy. The begin-
ning of 2022 shocked the whole world with the open
military aggression of the Russian regime, which led
to crisis phenomena in Ukraine and the world. At the
current stage, one of the most urgent problems is the
prevention of excessive price growth. In macroeco-
nomics, the situation in Ukraine is called stagflation.
Stagflation is characterized by rising prices during cri-
sis phenomena in the economy. The implementation
of measures to support a stable level of inflation be-
comes the most important condition for the imple-
mentation of the monetary policy of the state.
In the research, inflationary processes are stud-
ied on the basis of the annual consumer price index
(CPI) in Ukraine for the period from 2002 to 2021
according to the official website of the State Statis-
tics Service (SSSU, 2022). The consumer price in-
a
https://orcid.org/0000-0002-4388-3494
b
https://orcid.org/0000-0001-6143-6797
c
https://orcid.org/0000-0003-3819-9003
dex demonstrates the general level of inflation in the
economy and is an indicator of the population’s stan-
dard of living and social-economic development. The
CPI takes place in a center of the indicators of price
statistics system and is calculated in Ukraine, starting
from August 1991, as part of the program for devel-
oping a number of macroeconomic indicators based
on international standards. The CPI has become an
important economic indicator since its introduction.
The value of the CPI is difficult to overestimate, as it
directly or indirectly affects the standard of living of
the country’s population (State Statistics Service of
Ukraine, 2022). To curb excessive price growth, the
mathematical modeling of the level of inflation based
on a scientific analysis of the dynamics of the cost of
goods and services, the volume of GDP, the exchange
rate of the domestic currency, the level of wages and
other macroeconomic factors are needed.
156
Shinkarenko, V., Hostryk, A. and Shynkarenko, L.
Research of Inflation Processes in Ukraine in Crisis Conditions.
DOI: 10.5220/0011932200003432
In Proceedings of 10th International Conference on Monitoring, Modeling Management of Emergent Economy (M3E2 2022), pages 156-162
ISBN: 978-989-758-640-8; ISSN: 2975-9234
Copyright
c
2023 by SCITEPRESS – Science and Technology Publications, Lda. Under CC license (CC BY-NC-ND 4.0)

2 PROBLEM STATEMENT AND
SOLUTIONS
Considering the impact of inflation on socio-political
and economic life, various aspects of its research are
presented in the works of many domestic and foreign
scientists. The mutual influence of the growth of con-
sumer prices and inflationary expectations in Ukraine
was studied in the work of Khokhych (Khokhych,
2020). In the work of Gitis et al. (Gitis et al., 2020),
the problem of the impact of rising consumer prices
on the level of income of the population is raised. In
the article by Kuzheliev et al. (Kuzheliev et al., 2020),
the impact of inflation and other monetary policy in-
struments on key economic indicators in Ukraine dur-
ing periods of stability and crisis is considered.
Sarel (Sarel, 1996) analyzed the possibility of a
nonlinear impact of the CPI on economic growth,
when this indicator is critical – 108. Below this value,
the CPI does not affect growth, or may even have a
slightly positive effect.
In the works of Macovei and Scutaru (Macovei
and Scutaru, 2016; Macovei, 2020), the influence of
the consumer price index on the economic growth of
Romania was investigated on the basis of annual data
from 1991 to 2018 and it was proposed to use a non-
linear regression model. The results of the study show
a close relationship between the consumer price index
(CPI) and the gross domestic product (GDP).
The analysis of the use of the value unit index for
curbing inflation in Latin American countries was car-
ried out by Yereshko and Hafarov (Yereshko and Ha-
farov, 2020).
Shinkarenko et al. (Shinkarenko et al., 2021) ex-
amines the behavior of the consumer price index in
Ukraine for the period from January 2010 to Septem-
ber 2020 by month. The characteristics of the ini-
tial time series, the analysis of auto-correlation func-
tions made it possible to reveal the trend of their
development and the presence of annual seasonality.
To simulate the behavior of the consumer price in-
dex and forecast for the following months, 2 types
of models were used: the additive ARIMA*ARIMAS
model, better known as the Box-Jenkins model (Box
et al., 2015) and the exponential smoothing model
with Holt-Winters seasonality estimation (Gardner
Jr., 1985). As a result of using the STATISTICA pack-
age, the most adequate models reflecting the monthly
dynamics of the consumer price index in Ukraine
were built. However, the rapid deterioration of the
economic situation in Ukraine in connection with
open Russian military aggression does not allow the
application of these models.
3 MAIN RESULTS
Inflationary processes are studied on the basis of
the following macroeconomic indicators: the annual
consumer price index in Ukraine (CPI), the annual
gross domestic product (GDP) calculated in US dol-
lars, the exchange rate of the hryvnia against the US
dollar (HR) and the level of average wages (AW),
converted in US dollars for the period from 2002
to 2021. The array of data was compiled on the
basis of the reports of the State Statistics Service
of Ukraine (SSSU, 2022) and the National Bank of
Ukraine (NBU, 2022). The resulting array of data is
shown in table 1.
To build a model and forecast the level of inflation,
we first find the main statistical characteristics of the
dynamic series under investigation. They are shown
in table 2.
Numerical characteristics of the CPI range show
that the consumer price index fluctuated in the interval
from 99,4% to 143,3% during the studied period. The
mean square deviation of 6,63 shows that the variation
of the consumer price index for the studied period is
quite small.
The characteristics of the GDP series show that
during the studied period the volume of the gross do-
mestic product gradually increased from 50 133 mil-
lion US dollars to 183 310 million US dollars. The
mean square deviation of 32130,572 indicates the ab-
sence of anomalous values of the indicator except for
certain years.
The statistics of the HR series show a gradual de-
preciation of the national currency from 5,05 to 27,2
per US dollar. The mean square deviation of 8,344
shows that hryvnia exchange rate jumps in some years
were quite insidious.
Numerical characteristics of a number of wage
earners show that the average wage in Ukraine grad-
ually increased from USD 70,59 to USD 430,21. The
mean square deviation of 83,025 indicates that the
growth of the indicator occurred gradually.
In order to clearly display the dynamics of the
consumer price index in Ukraine during 2002-2021,
a diagram of the indicator was constructed (figure 1).
The constructed trend equation shows that CPI
forecasting using standard time series forecasting
methods is not possible, as the correlation coefficient
is very small. The series has neither a trend nor a
seasonal component, therefore, in order to make an
adequate forecast, it is necessary to identify the fac-
tors that have the greatest influence on the dynamics
of the CPI.
Since the indicators chosen for the model have
fundamentally different dimensions, it is impossible
Research of Inflation Processes in Ukraine in Crisis Conditions
157

Table 1: Some macroeconomic indicators in Ukraine for 2002-2021.
Years CPI GDP HR AW CPI GDP HR AW
2002 99,4 59286 5,29 70,59 - - - -
2003 108,2 50133 5,33 86,74 1,082 1,183 0,992 1,229
2004 112,3 64883 5,32 111,02 1,123 1,294 0,997 1,280
2005 110,3 86142 5,12 157,3 1,103 1,328 0,963 1,417
2006 111,6 107753 5,05 206,51 1,116 1,251 0,985 1,313
2007 116,6 142719 5,05 267,87 1,166 1,325 1,000 1,297
2008 122,3 179992 5,27 343,43 1,223 1,261 1,043 1,282
2009 112,3 117228 7,79 245,05 1,123 0,651 1,479 0,714
2010 109,1 136419 7,94 283,12 1,091 1,164 1,019 1,155
2011 104,6 163160 7,97 331,24 1,046 1,196 1,004 1,170
2012 99,8 175781 7,99 379,42 0,998 1,077 1,003 1,145
2013 100,5 183310 7,99 409,59 1,005 1,043 1,000 1,080
2014 124,9 131805 11,89 292,32 1,249 0,719 1,487 0,714
2015 143,3 90615 21,84 162,60 1,433 0,687 1,838 0,556
2016 112,4 93270 25,55 203,02 1,124 1,029 1,170 1,249
2017 113,7 112154 26,60 267,16 1,137 1,202 1,041 1,316
2018 109,8 130832 27,20 325,99 1,098 1,167 1,023 1,220
2019 104,1 153781 25,85 406,40 1,041 1,175 0,950 1,247
2020 105,0 155568 26,96 430,21 1,050 1,012 1,043 1,059
2021 110,0 200090 28,78 506,42 1,100 1,286 1,068 1,177
Table 2: Characteristics of dynamic series for 2002-2021.
Indicator Average value Average deviation Minimal value Maximal value
CPI 112,3 6,630 99,4 143,3
GDP 126419,1 32130,572 50133 183310
HR 13,2 8,344 5,05 27,20
AW 272,7 83,025 70,59 430,21
to build a function that will accurately reflect the im-
pact of GDP, HR and SP on the CPI. In such cases, it
is necessary to standardize the data. Methods of stan-
dardization of research factors are described in detail
in works (Shinkarenko et al., 2019; Matskul et al.,
2020). The method of eliminating different dimen-
sions is also used, which is based on the comparison
of growth rates of time series (for example, (Kozak
et al., 2017)). This is what we used in our work to
analyze inflationary processes.
When modeling relationships in dynamic series,
relative values are widely used. This is due to their
greater elasticity in time compared to absolute val-
ues. In addition, it helps eliminate multicollinearity
and autocorrelation of the residuals. We will assume
that the CPI is modeled by a function of the Cobb-
Douglas-Tinbergen type (Yankovoy and Yankovoy,
2019):
I = γ · Q
α
· G
β
· K
λ
· e
µt
. (1)
where I is the consumer price index (%), Q is GDP
(millions of US dollars),G is the hryvnia exchange
rate (US dollars), K is the average wage (US dollars).
Parameters α, β, γ and µ are elasticity coefficients: α
characterizes the increase in the CPI per unit of GDP
growth at unchanged HR and SP, β is the increase in
CPI per unit of increase in HR at unchanged GDP and
SP, Λ is the increase in CPI per unit of increase in SP
at unchanged GDP and HR, µ — CPI growth due to
factors not included in the model.
Applying logarithmic differentiation to the Cobb-
Douglas-Tinbergen function, taking into account that
each factor depends on time, we obtain a linear model
that describes the relationship between growth rates:
i = µ + α · q + β · g + λ · k. (2)
where i, q, g, k are the growth rates of CPI, GDP, HR
and AW, respectively. In the future, the rate of growth
of the indicator will be understood as the ratio of its
next level to the previous one. Note that this approach
avoids reducing the indicators to one dimension. Ta-
ble 1 shows the growth rates of each of the studied
indicators.
To determine the general trend of the behavior of
the time series, a diagram was constructed that reflects
the dynamics of the growth rates of the consumer
M3E2 2022 - International Conference on Monitoring, Modeling Management of Emergent Economy
158
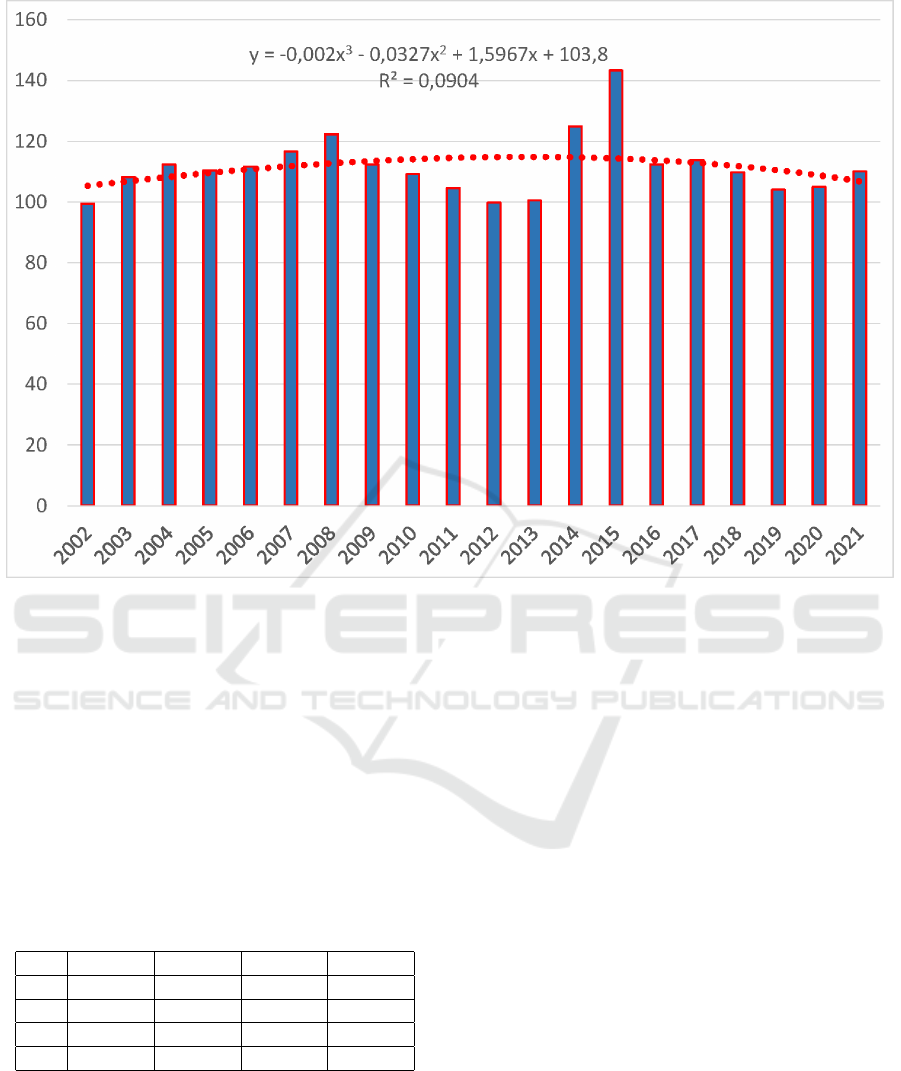
Figure 1: Dynamics of the consumer price index in Ukraine for 2002-2021.
price index, the gross domestic product, the hryvnia
exchange rate, and the average wage (figure 2).
The analysis of the constructed trend lines shows
that fluctuations in the level of the consumer price in-
dex are closely related to the behavior of the volume
of the gross domestic product, the hryvnia exchange
rate, and the average wage. To confirm the hypothesis
about the presence of a close relationship between the
specified factors, the correlation coefficients between
the indicators were calculated. The obtained coeffi-
cients are shown in table 3.
Table 3: Correlation matrix of CPI, GDP, HR and AW.
CPI GDP HR AW
CPI 1 -0,43485 0,790091 -0,54429
GDP -0,43485 1 -0,87949 0,954285
HR 0,790091 -0,87949 1 -0,91172
AW -0,54429 0,954285 -0,91172 1
The calculated coefficients allow us to conclude
that the rate of growth of the consumer price index is
most affected by fluctuations in the hryvnia exchange
rate (a 1% devaluation of the hryvnia leads to an in-
crease in the CPI by 0,79%). The influence of the
growth rates of the gross domestic product and av-
erage wages is moderate and negative, that is, an in-
crease in the GDP growth rate by 1% will lead to a
decrease in the CPI by 0,43%, the consequence of an
increase in the growth rate of GDP by 1% is a de-
crease in the CPI by 0,54%.
A regression equation was built using the MS Ex-
cel:
i = −0,335 + 0,545 · q + 0,764 · g + 0,007 · k. (3)
where i, q, g, k are the growth rates of CPI, GDP, HR
and AW, respectively (figure 3).
The equation has good statistical indicators of cor-
relation and regression analysis. The multiple corre-
lation coefficient R = 0,961 shows that the volume
of GDP, the hryvnia exchange rate and the average
salary directly affect the change in the CPI (cover-
ing about 9% of the influencing factors). The stan-
dard error of the regression S
y
= 0,031 is quite small,
which indicates that the model corresponds to the eco-
nomic process. The calculated value of the F-criterion
is F = 55,766, its significance is F = 4,97 · 10
−8
. The
calculated value is significantly less than 0,01, there-
fore, with a 99% level of reliability, it is possible to
assert, according to Fisher’s test, that the constructed
model is adequate to the empirical data.
Let’s check the reliability of each of the coeffi-
cients of the constructed equation: for the first coeffi-
cient
t
1
= 4,564, p
1
= 0,0004 < 0,005,
Research of Inflation Processes in Ukraine in Crisis Conditions
159
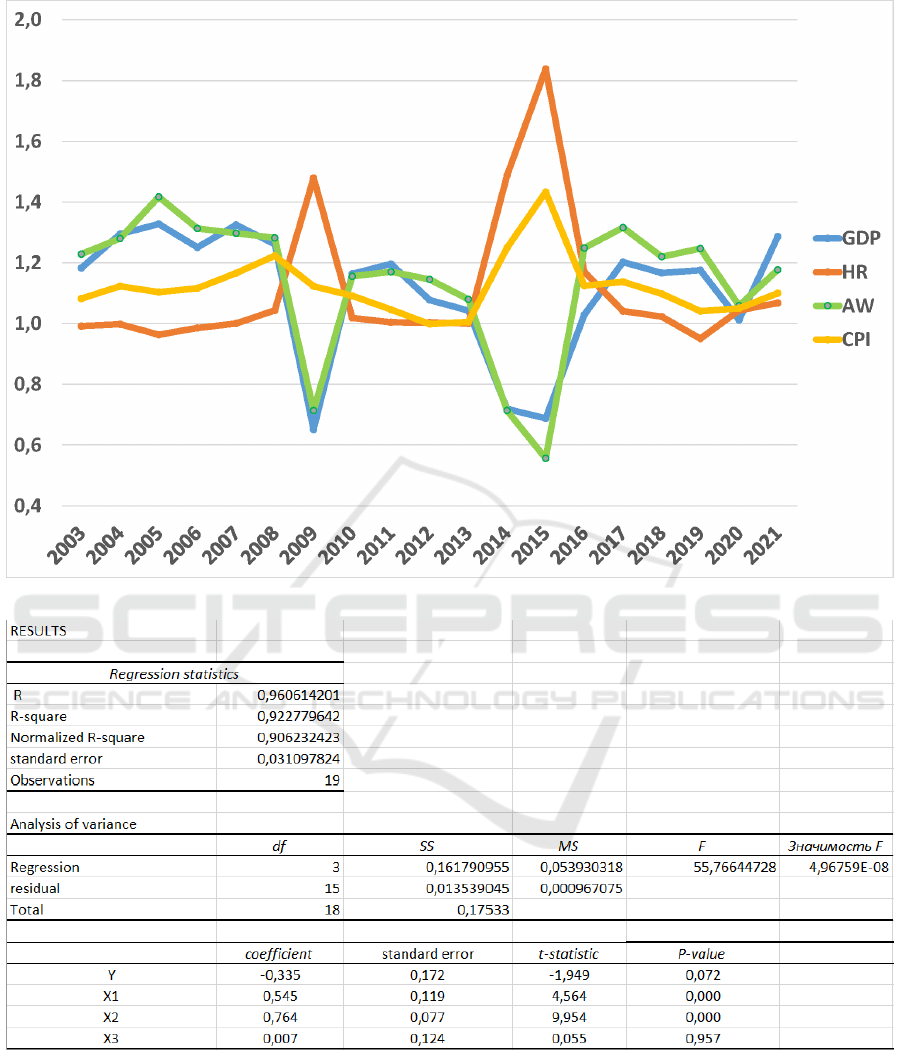
Figure 2: Growth rates of the CPI, GDP, HR and AW in Ukraine for 2003-2021.
Figure 3: Results of Regression statistics and Analysis of variance.
therefore, according to the Student’s criterion, the co-
efficient is statistically reliable with a level of 99%,
for the second coefficient
t
2
= 0,077, p
2
= 9,89 · 10
−8
< 0,005,
therefore, according to the Student’s test, the coeffi-
cient is statistically reliable at the 99% level, for the
third coefficient the value
t
3
= 0,124, p
3
= 0,957 > 0,005,
therefore the coefficient is not statistically reliable at
the 99% level. It is more likely that the problem arose
as a result of the close connection between the factors
of GDP and AW.
M3E2 2022 - International Conference on Monitoring, Modeling Management of Emergent Economy
160

To check the reliability of the built model, we will
calculate the forecast value of the consumer price in-
dex for the end of 2022, using the data on the gross
domestic product, the hryvnia exchange rate and the
average salary, which are given on the websites of the
Cabinet of Ministers of Ukraine (Ministry of Finance
of Ukraine, 2022) and the National Bank of Ukraine
(NBU, 2022). According to the given data, a decrease
in GDP is expected by 40%. The hryvnia exchange
rate is set at UAH 40,0 per USD, up 38,7% from the
previous period. The average salary at the end of 2022
is forecast to be UAH 18,535, which at the exchange
rate of UAH 40,0 is 440,48 USD, the growth until
2021 is 12,9%. Let’s calculate the predicted value of
the CPI:
i = −0,335 + 0,545 · 0,6 + 0,764 · 1,39+
0,007 · 0,87 = 1,417.
(4)
The calculated value shows that the consumer
price index in 2022 will increase by 41,7% compared
to 2021.
4 CONCLUSION
The built mathematical model of the dependence of
the growth of the index of social prices on the growth
of the annual volume of the gross domestic product,
the exchange rate of the hryvnia and the level of the
average salary is adequate and reliable. Using the re-
gression equation, it is possible to estimate the influ-
ence of factors on the change in the CPI and calculate
the predicted values of the social price index.
The processing of the array of the consumer price
index with the help of application programs proved
that the indicator is characterized by a random com-
ponent and cannot be approximated by elementary
functions.
The forecast of the indicator for the end of 2022
showed that, taking into account the crisis in the econ-
omy associated with the Russian military aggression,
a significant increase in the level of inflation is ex-
pected in Ukraine.
For a more detailed study of the causes and rates
of growth of the consumer price index, one should
consider the change in the value of its individual com-
ponents (food, non-food, services and other groups of
goods), the relationship of the indicator with a sim-
ilar indicator in neighboring countries (price growth
on the world market), the influence of the state debt
to the level of inflation in the country.
REFERENCES
Box, G. E. P., Jenkins, G. M., Reinsel, G. C., and Ljung,
G. M. (2015). Time Series Analysis, Forecasting and
Control. Wiley, 5 edition.
Gardner Jr., E. S. (1985). Exponential smoothing: The state
of the art. Journal of Forecasting, 4(1):1–26. https:
//doi.org/10.1002/for.3980040103.
Gitis, T. P., Chemerys, Y. T., Antonova, V. I., and Nosany-
ova, A. S. (2020). Study of the current level of so-
cial protection of the population in ukraine. Economic
Bulletin of Donbass, 1(59):64–81. https://doi.org/10.
12958/1817-3772-2020-(59)-116-122.
Khokhych, D. (2020). Interaction of consumer prices
growth dynamics and inflation expectations in
ukraine. Finance of Ukraine, (4):64–81. https://doi.
org/10.33763/finukr2020.04.064.
Kozak, Y., Matskul, V., and Shengelia, T. (2017). Mathe-
matical methods and models for master of economics.
Practical applications.
Kuzheliev, M., Zherlitsyn, D., Rekunenko, I., Nechy-
porenko, A., and Nemsadze, G. (2020). The im-
pact of inflation targeting on macroeconomic indica-
tors in ukraine. Banks and Bank Systems, 15(2):94–
104. https://doi.org/10.21511/bbs.15(2).2020.09.
Macovei, A.-G. (2020). Impact of the consumer price in-
dex on gross domestic product in romania. Ecofo-
rum, (XXX). http://www.ecoforumjournal.ro/index.
php/eco/article/downloadSuppFile/1053/605.
Macovei, A. G. and Scutaru, L. (2016). The impact of in-
ward fdi on trade: evidence from romania. Academic
Research International, 7(4):95–105.
Matskul, V., Okara, D., and Podvalna, N. (2020). The
ukraine and eu trade balance: prediction via various
models of time series. 73. https://doi.org/10.1051/
shsconf/20207301020.
Ministry of Finance of Ukraine (2022). Official web-site of
the ministry of finance of ukraine. https://mof.gov.ua.
NBU (2022). National bank of ukraine. https://bank.gov.
ua/ua/news/all/rishennya-oblikova-stavka.
Sarel, M. (1996). Nonlinear effects of inflation on economic
growth. IMF Staff Papers, 43(1):199–215. https://doi.
org/10.2307/3867357.
Shinkarenko, V., Hostryk, A., Shynkarenko, L., and Dolin-
skyi, L. (2021). A forecasting the consumer price
index using time series model. SHS Web of Con-
ferences, 107:10002. https://doi.org/10.1051/shsconf/
202110710002.
Shinkarenko, V., Matskul, M., and Linok, D. (2019). In-
vestment attractiveness modeling using multidimen-
sional statistical analysis. In Kiv, A., Semerikov, S.,
Soloviev, V. N., Kibalnyk, L., Danylchuk, H., and
Matviychuk, A., editors, Proceedings of the Selected
Papers of the 8th International Conference on Moni-
toring, Modeling & Management of Emergent Econ-
omy, M3E2-EEMLPEED 2019, Odessa, Ukraine,
May 22-24, 2019, volume 2422 of CEUR Workshop
Proceedings, pages 147–156. CEUR-WS.org. http:
//ceur-ws.org/Vol-2422/paper12.pdf.
Research of Inflation Processes in Ukraine in Crisis Conditions
161

SSSU (2022). State statistics service of ukraine. http://
www.ukrstat.gov.ua.
State Statistics Service of Ukraine (2022). Consumer price
index: perception and reality. https://www.lv.ukrstat.
gov.ua/ukr/themes/13/.
Yankovoy, A. and Yankovoy, V. (2019). Optimization of the
capital-labor ratio of industrial enterprises using pro-
duction functions. Ekonomika Ukrainy, (11-12):34–
48.
Yereshko, J. and Hafarov, E. (2020). Indexed unit of ac-
count. Efektyvna ekonomika, (5). https://doi.org/10.
32702/2307-2105-2020.5.91.
M3E2 2022 - International Conference on Monitoring, Modeling Management of Emergent Economy
162
