
Application of Multidimensional Statistical Analysis Technology for
Grouping Regions by the Investment Attractiveness Level
Pavlo M. Hryhoruk
1 a
, Nila A. Khrushch
1 b
, Svitlana S. Grygoruk
1 c
and Olena R. Ovchynnikova
1,2 d
1
Khmelnytskyi National University, 11 Instytutska Str., Khmelnytskyi, 29016, Ukraine
2
Center of Migration Research, University of Warsaw, 7 Pasteura Str., Warsaw, 02-093, Poland
Keywords:
Socio-Economic Development, Region, Investment Attractiveness, Clustering, K-Means Method, Principal
Component Method, Quartimax Technique.
Abstract:
The paper is devoted to studying multidimensional statistical analysis tools for grouping regions by the level
of their investment attractiveness and identifying changes in the structure of regions in the context of the con-
tinued destructive impact of the COVID-19 pandemic. An analysis of approaches to assessing investment
attractiveness identified their strengths. Insufficient attention to the application of methods of multidimen-
sional statistical analysis to a grouping of regions is stated. The authors consider the clustering of regions of
Ukraine in the context of their level of investment attractiveness by the method of k-means and identify their
structure according to the level of investment attractiveness in 2019 and 2020 in the context of the COVID-19
pandemic. To verify the correctness of the conclusions, the method of principal components with the rota-
tion of the space of the selected factors by the quartimax technique. Further grouping of regions in the space
of selected principal components showed results identical to the application of the cluster analysis method.
Potential investors can use the research results to determine priority areas of investment. Also, the results
are useful for local self-government bodies, as they provide information on the relative level of investment
attractiveness of a specific region compared to other territorial units and also allow identifying weak points in
specific areas of activity.
1 INTRODUCTION
Sustainable socio-economic development of territo-
ries is associated with the need to intensify investment
activities. It is primarily aimed at forming the finan-
cial basis for improving the efficiency and effective-
ness of enterprises, creating new jobs, and achieving
high social standards of living. Achieving this goal
requires using analytical tools as part of appropriate
mechanisms for managing regional development. An
essential component of such tools is economical and
mathematical modeling. Using relevant data and fit-
ting models provides quantitative and qualitative as-
sessments of the state and socio-economic develop-
ment trajectories. One of the ways to create an ana-
lytical basis for determining the strategy of regional
a
https://orcid.org/0000-0002-2732-5038
b
https://orcid.org/0000-0002-9930-7023
c
https://orcid.org/0000-0003-3047-2271
d
https://orcid.org/0000-0002-7751-2923
policy in the context of financial support for socio-
economic development is to assess the investment at-
tractiveness of regions.
Significant structural and technological economic
changes caused by globalization, increasing compe-
tition in foreign and domestic markets, and the con-
sequences of the COVID-19 pandemic require in-
creased investment, which is limited financial re-
sources and a critical task. Therefore, ensuring the re-
gion’s investment attractiveness is a strategic task for
developing business structures, which will help attract
investment, primarily from foreign investors.
Therefore, in the current conditions of produc-
tion and economic activities, issues related to assess-
ing the investment attractiveness of regions and their
grouping to determine areas for intensification of in-
vestment processes, search and use of reserves to im-
prove the efficiency of regional investment are of pri-
ority importance.
Hryhoruk, P., Khrushch, N., Grygoruk, S. and Ovchynnikova, O.
Application of Multidimensional Statistical Analysis Technology for Grouping Regions by the Investment Attractiveness Level.
DOI: 10.5220/0011932000003432
In Proceedings of 10th International Conference on Monitoring, Modeling Management of Emergent Economy (M3E2 2022), pages 145-155
ISBN: 978-989-758-640-8; ISSN: 2975-9234
Copyright
c
2023 by SCITEPRESS – Science and Technology Publications, Lda. Under CC license (CC BY-NC-ND 4.0)
145

2 LITERATURE REVIEW
ssessing the region’s investment attractiveness is es-
sential in developing a strategy for innovation at re-
gional and national levels. Note that the investment
volume isn’t always directly determined by the high
level of investment attractiveness. This is due to
many other factors that determine investor decision-
making. In particular, such factors are various in-
dices and ratings regularly published by international
institutions and characterize the business environ-
ment, business conditions, actual investment activ-
ities, and the attractiveness of countries for invest-
ment. In particular, it can be used such evalua-
tions like the World Bank Ranking “Doing Business”
(World Bank, 2021); Index of Economic Freedom,
provided by the Heritage Foundation (Heritage Foun-
dation, 2020); Corruption Perceptions Index (CPI),
compiled by the international anti-corruption orga-
nization ”Transparency International” (Transparency
International, 2020); Foreign Direct Investment Con-
fidence Index (Kearney, 2020); Global Innovation
Index (WIPO, 2020); European Business Associa-
tion Investment Attractiveness Index (EBA, 2020);
Credit rating developed by Moody’s Investors Ser-
vice (Moody’s, 2020); World Countries’ Ranking on
the Global Competitiveness Index, provided by the
World Economic Forum (WEF, 2020); World Com-
petitiveness Ranking, provided by the International
Institute for Management Development (IMDWCC,
2020); The KOF Globalization Index, published by
the KOF Swiss Economic Institute, reflects the scale
of the country’s integration into the world (KOF,
2020) and many others.
These ratings provide the necessary information
for potential investors on the characteristics of the
country’s business environment and possible invest-
ment risks. Naturally, countries with high ratings are
more attractive regarding return on investment. On
the other hand, countries with low ratings may also
be attractive to investors, particularly for short-term
investments, resulting from competition for coverage
of developing countries.
These ratings should be noted that characterize the
country’s business environment. At the same time, in-
vestors are usually interested in specific areas, territo-
rial units, markets, sectors of the economy, and busi-
ness entities. Such assessments of the investment at-
tractiveness of certain regions of Ukraine are provided
by the State Statistics Service of Ukraine (SSCU,
2003) and the Ministry of Development of Commu-
nities and Territories of Ukraine (MCTDU, 2021).
The issue of investment attractiveness is also the
focus of research. The formation of the theoretical ba-
sis for the study of the category of investment attrac-
tiveness in the context of its relationship with the in-
vestment climate, and investment risks, taking into ac-
count current trends in economic development, is re-
flected in the works (Kaminskyi et al., 2019; Stadnyk
et al., 2020; Korenyuk and Kopil, 2018; Kyshakevych
et al., 2020; Godlewska-Majkowska, 2018; Jac and
Vondrackova, 2018). Researchers presented a mod-
ern understanding of the category of investment at-
tractiveness, its content and essential characteristics,
and the impact on the socio-economic development
of individual regions and the country as a whole.
An important issue in modeling investment at-
tractiveness is forming an information base for cal-
culating various estimates of the studied character-
istics. The solution to such problems is considered
in (Kyshakevych et al., 2020; Jac and Vondrackova,
2018; Bushynskyi, 2020; Leshchuk, 2020; Lagler,
2020; Swidynska and De Jesus, 2020). It should be
noted that the results of scholars’ investigations in this
field are differed both in the number of indicators and
their focus in the context of reflecting certain aspects
of investment activities. At the same time, the au-
thors’ positions coincide with the views that the indi-
cators should reflect the economic, financial, and so-
cial aspects of regional development.
Modeling the investment attractiveness of regions
is mainly based on statistical methods. Their ap-
plication is based on quantitatively measurable indi-
cators that reflect social, economic, environmental,
and investment development components. This ap-
proach uses regression models, that presented in pa-
pers (Windhyastiti et al., 2020; Blahun et al., 2017;
Vartsaba and Leshuk, 2017; Kikkas and Krasnozhen-
ova, 2018); correlation analysis techniques (Blaschke,
2022; Dorozynski and Kuna-Marszałek, 2016); mod-
els based on neural networks (Bruneckiene et al.,
2019). At the same time, the issue of identifying the
level of investment attractiveness and comparing re-
gions on this indicator is out of the attention of re-
searchers. The approach based on comprehensive in-
dex assessment technology is quite common. It is
successfully used in solving the problems of ranking
regions by socio-economic development (Hryhoruk
et al., 2019b,a; Mazziotta and Pareto, 2014; Meyer
et al., 2016). The application of this approach to as-
sessing investment attractiveness is reflected in stud-
ies (Swidynska and De Jesus, 2020; Kyshakevcyh
and Nakhaeva, 2021; Yelnikova, 2020; Sizova et al.,
2017).
Among the shortcomings of the comprehensive
index assessment technology application presented in
these investigations, it should be noted that they use
a fairly large set of initial indicators. This makes it
M3E2 2022 - International Conference on Monitoring, Modeling Management of Emergent Economy
146

difficult to identify the significance of their impact on
the final result and eliminates the differentiating abil-
ity of the designed composite index. These shortcom-
ings negatively affect the ability to group the set of
studied objects due to the high density of values on
the composite index scale. Also out of consideration
is the definition of the level of investment attractive-
ness of regions, which complicates the assessment of
differences between regions on the calculated index.
The problems of rating regions can also be solved
with the application of multidimensional statistical
analysis technology, that described, in particular, in
papers (Tenreiro Machado and Mata, 2015a,b; Meyer
and De Jongh, 2018; De Jongh and Meyer, 2019;
Walesiak, 2017; Gorbatiuk et al., 2019; Hryhoruk
et al., 2020b,a; Andrusiak et al., 2022). Adaptation of
multidimensional analysis methods to assess invest-
ment attractiveness is considered in studies (Cheba,
2017; Danylchuk et al., 2019; Shinkarenko et al.,
2019; Musolino and Volget, 2020; Roszko-W
´
ojtowicz
and Grzelak, 2021).
At the same time, applying these methods is fo-
cused mainly on solving the problem of grouping re-
gions in terms of investment attractiveness. The anal-
ysis of structural shifts within the constructed homo-
geneous groups remains out of the attention of sci-
entists, as well as the comparison of grouping results
obtained by different techniques.
According to the results of the analysis of pub-
lications, it can be concluded that there is significant
diversity in approaches to assessing the investment at-
tractiveness of regions. Among the disadvantages, we
can note that the calculations are carried out without
considering the dynamic and qualitative changes in
the environment.
Also, the use of a large number of baseline par-
tial indicators, to some extent, blurs the study’s re-
sults and gives only a general description of the socio-
economic condition of the region and the characteris-
tics of investment activities.
The significant variety of calculated estimates and
the lack of clear conclusions and recommendations
for their practical application necessitates the further
study of the problem of assessing the investment at-
tractiveness of regions in the context of their group-
ing by using different techniques to solve this prob-
lem with the further comparison of grouping results
and structural changes within groups.
The solution to these problems has led to the di-
rection of research in this study.
3 PROBLEM DESCRIPTION AND
METHODOLOGY
A large number of different indicators characterize
modern investment processes. This multidimension-
ality of the description makes it difficult to solve
problems of assessing the various characteristics of
these processes, particularly the grouping of regions
by the level of investment attractiveness. As noted
earlier, one way to solve classification problems is
using cluster analysis techniques. Unlike combina-
tional grouping, this approach allows you to create
groups of similar objects of observation, considering
all the features at once. The degree of similarity, in
this case, is usually the Euclidean distance between
objects in the multidimensional space of primary in-
dicators. One of the cluster analysis methods is the
k-means method, which belongs to the group of itera-
tive clustering ones.
Consider a brief description of the mathematical
model of the k-means method (Hryhoruk et al., 2021).
Suppose there are m observations, each characterized
by n indicators X
1
, X
2
, . . . , X
n
.
We need to divide these observations into k clus-
ters that do not intersect. At the initial stage, we
choose k points-objects that will act as centers of
clusters. Denote them by C
(0)
1
, C
(0)
2
, . . . , C
k
(0)
. The
weight of each cluster will initially be equal to one:
w
(0)
1
= 1, w
(0)
2
= 1, . . . , w
k
(0)
= 1. The index of the
corresponding center will be considered the index of
the corresponding cluster. Although the selected cen-
ters may move to other clusters during the subsequent
iterative procedure, the indexing of the clusters will
not change.
In the first step, each of the (n − k) objects that
are not the clusters’ centers is included in one of the
formed clusters. The criterion for such movement is
the minimum distance to the cluster’s center. The cen-
ter of the cluster and its weight are recalculated. For
example, for a point M
k+1
with coordinates (X
k+1,1
;
X
k+1,2
;. . . ; X
k+1,n
) the recalculation is performed ac-
cording to the formulas:
C
(0)
j
=
w
(0)
j
c
(0)
j
+ M
k+1
w
(0)
j
+ 1
, (1)
w
(0)
j
= w
(0)
j
+ 1. (2)
In the case of equality of two or more distances
to the centers of clusters, the point-object joins the
cluster with a smaller sequence number. Note that in
practice, such a situation is unlikely.
The resulting centers and corresponding cluster
weights are taken as the initial values of the related
characteristics for the next iteration.
Application of Multidimensional Statistical Analysis Technology for Grouping Regions by the Investment Attractiveness Level
147

All stages of the further iterative process use for-
mulas (1) and (2) and the whole set of initial data
M
1
, M
2
, ..., M
m
. At the same time, the weight of clus-
ters continues to increase.
The objects can also be grouped by expanding
them in some new space of latent scales, which re-
flect the generalizing characteristics. In particular, the
principal components method can be constructed in
such a space.
In matrix form, the model of the method is de-
scribed by the formula:
Z
T
= W · F
T
, (3)
where Z is an initial standardized indicators matrix;
W – factor loadings matrix; it reflects relations be-
tween initial indicators and principal components;
F – principal components matrix.
Factor loadings matrix is calculated using eigen-
values and appropriate eigenvectors of R – initial in-
dicators correlation matrix:
W = V · Λ
(−1)
, (4)
where W – factor loadings matrix;
V – normalized eigenvectors matrix;
Λ – eigenvalues matrix.
The rule obtains the initial indicators correlation
matrix:
R =
Z
T
· Z
m − 1
, (5)
where R – correlation matrix;
Z – initial standardized indicators matrix.
The standardization procedure for initial indica-
tors uses a formula:
Z
i j
=
X
i j
−
¯
X
j
s
j
, (6)
where Z
i j
– initial standardized indicators values;
X
i j
– initial indicators values;
¯
X
j
– average sample value of the indicator X
j
;
s
j
– sample standard deviation of the indicator X
j
;
i = 1..m; j = 1..n.
The formula obtains the principal components ma-
trix:
F = Z · W · Λ
−1
. (7)
This matrix contains the coordinates of objects un-
der study in a principal components space.
Not all the principal components are selected for
practical application, but only the most essential part
in explaining the variance of the initial indicators (in-
formation contained in the initial indicators). Given
that the eigenvalues of the correlation matrix are con-
sidered to be ordered in descending their values in the
calculation procedure, the weight of each subsequent
principal component is reduced. Usually, the first two
principal components are sufficient to achieve an “ac-
ceptable” level of explanation of the information con-
tained in the set of initial indicators, at least 70 %.
Meaningful interpretation of the selected principal
components (search for names for them) is carried out
by considering the absolute values of the respective
factor loads. The initial indicators that will be used to
interpret the appropriate principal component include
those for which the factor loadings absolute value be-
tween them and the corresponding principal compo-
nent is not less than 0.75. The factor load reflects
the correlation between the principal component and
the related indicator. To improve the procedure of in-
terpretation of the principal components by the prob-
lem’s content, the constructed factor space is rotated
with a corresponding change in both factor loadings
and values of the principal components. The result is
a “simple structure” space where the principal com-
ponents are closely related to some initial indicators
and weak to others.
4 RESULTS AND DISCUSSIONS
Consider the application of cluster analysis of the
grouping of Ukraine’s regions by indicators that re-
flect their investment attractiveness. The choice of the
initial indicators set will be made based on the follow-
ing considerations:
• indicators should reflect both the characteristics of
investment activities of the region’s business enti-
ties and the socio-economic development of the
region;
• indicators should be comparable by the values for
different regions;
• the indicators must be standardized, i.e., have a
sample mean equal to zero and a sample stan-
dard deviation equal to one. This procedure is
needed because clustering is based on a matrix
of differences between the studied points-regions
in the multidimensional space of the initial indi-
cators, which is essentially a matrix of Euclidean
distances between them. Therefore, for the objec-
tivity of the calculations, it is necessary to remove
the measurement units’ influence on estimates of
distances between objects.
Based on the recommendations of scholars pre-
sented in studies (Korenyuk and Kopil, 2018;
Kyshakevych et al., 2020; Godlewska-Majkowska,
2018; Jac and Vondrackova, 2018; Bushynskyi, 2020;
Leshchuk, 2020; Lagler, 2020; Vartsaba and Leshuk,
2017; Dorozynski and Kuna-Marszałek, 2016) and
taking into account the above considerations, we have
M3E2 2022 - International Conference on Monitoring, Modeling Management of Emergent Economy
148

formed the following set of initial indicators for cal-
culations:
X
1
– Volume of capital investments per capita,
UAH;
X
2
– Volume of foreign direct investment per
capita, USD;
X
3
– Gross regional product (at actual prices) per
capita, UAH;
X
4
– Disposable income per capita, UAH;
X
5
– Volume of exports of goods per capita, USD;
X
6
– Volume of sold industrial products per capita,
UAH;
X
7
– Total of construction work per capita, UAH;
X
8
– Employment rate of the population aged 15-
70, in percent;
X
9
– Unemployment rate of the population aged
15-70 years (according to the methodology of the
ILO), in percent.
We use data for 2019 and 2020 from the materi-
als of the State Statistics Service of Ukraine (SSSU,
2022) and the Ministry of Development of Commu-
nities and Territories of Ukraine (MCTDU, 2021) for
calculations. Obtained results will also be compared
to assess changes in regions’ position in the groups in
which the regions are located. To present the region’s
names conveniently and briefly, we point out the cor-
respondence between each region’s name and the ap-
propriate code (table 1). Initial data for calculations
are written in table 2 and table 3.
Table 1: The relationships between the quantitative values
of the desirability scale and qualitative development levels
of group.
Code Region Code Region
C 1 Vinnytsia C 13 Mykolaiv
C 2 Volyn C 14 Odesa
C 3 Dnipro C 15 Poltava
C 4 Donetsk C 16 Rivne
C 5 Zhytomyr C 17 Sumy
C 6 Zakarpattia C 18 Ternopil
C 7 Zaporizhzhia C 19 Kharkiv
C 8 Ivano-Frankivsk C 20 Kherson
C 9 Kyiv C 21 Khmelnytskyi
C 10 Kyrovohrad C 22 Cherkasy
C 11 Luhansk C 23 Chernivtsi
C 12 Lviv C 24 Chernihiv
Let us cluster Ukraine’s regions according to the
selected set of indicators using the k-means method.
Define the number of clusters for grouping regions as
equal to three: a cluster of regions with a high level
of investment attractiveness, a cluster of regions with
a medium level of investment attractiveness, and a
cluster of regions with a low level of investment at-
tractiveness. We make calculations using “Statistica”
software. The results of clustering are shown in fig-
ure 1 and figure 2. The numbering of clusters, in this
case, is determined by the used software arbitrarily.
Let us provide a meaningful description of each clus-
ter according to 2019 data.
Cluster number 1 contains 6 regions: Volyn,
Donetsk, Zakarpattia, Kyrovohrad, Luhansk and
Ternopil. In our opinion, this cluster can be called
a group of regions with a low level of investment at-
tractiveness. Note that the regions of this cluster are
not industrially developed, which negatively affects
their attractiveness for investment. In addition, the
effects of the COVID-19 pandemic have had a sig-
nificant negative impact on the development of these
regions. Cluster number 2 contains regions with an
average level of investment attractiveness. It is the
most complete and consists of 14 points, which is
quite natural in compliance with the essence of the di-
vision of the typical characteristics. The cluster with a
high level of investment attractiveness includes clus-
ter number 3, which includes Dnipro, Kyiv, Zapor-
izhzhia, and Poltava regions. For these regions, there
are high values of the indicators presented in table 2,
particularly the volume of foreign direct investment
and relatively high employment rate, which allowed
to give the cluster just such an interpretation. In addi-
tion, these regions have developed industries, which
is also reflected in the indicator’s values.
Comparing the cluster’s structure obtained from
2020 data (figure 2), we can conclude that the full-
ness of clusters has not changed compared to the pre-
vious year. This indicates that there have been no
significant changes in the investment attractiveness of
Ukraine’s regions in 2020. Although several norma-
tive acts have been adopted at the legislative level to
facilitate attracting investments into Ukraine’s econ-
omy, their positive impact has not yet manifested it-
self. On the other hand, it is possible to state a certain
stabilization of indicators of socio-economic develop-
ment of Ukraine’s regions during the COVID-19 pan-
demic.
Let us consider the data of application of the prin-
cipal components method for grouping Ukraine’s re-
gions by the level of investment attractiveness. We
create the two-dimensional space of latent indicators
obtained by applying this method and project points-
regions on this space. To construct latent indicators,
we use the quartimax method for rotations of factor
space, which will contribute to an adequate represen-
tation of points in the new space and the identification
of meaningful interpretation of new axes.
Calculations also are performed using Statistica
software. The calculations’ results of factor loadings
are presented in table 4, and the values of points-
Application of Multidimensional Statistical Analysis Technology for Grouping Regions by the Investment Attractiveness Level
149
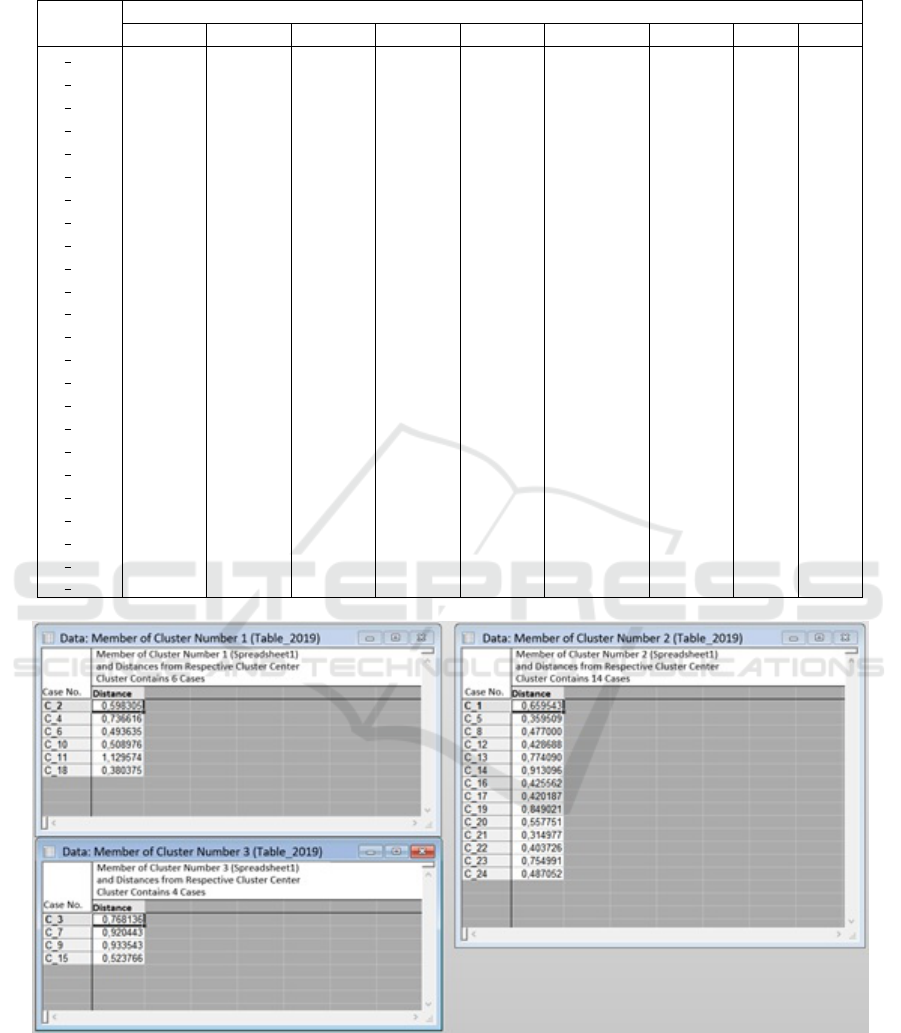
Table 2: Initial data for calculation for 2019 (MCTDU, 2021; SSSU, 2022).
Code
Values
X
1
X
2
X
3
X
4
X
5
X
6
X
7
X
8
X
9
C 1 9196.8 153.2 71104 64729 937.3 52478.4 6650.5 58.0 9.4
C 2 11800.5 297.5 58297 52879 671.6 30585.3 2259.4 50.9 10.6
C 3 19841.6 1191.1 114784 87130 2477.8 142289.0 6291.1 59.5 7.7
C 4 6789.2 338.4 45959 39141 1116.8 68439.6 1691.2 50.9 13.6
C 5 6095.3 202.7 62911 61961 592.3 37457.1 2227.8 58.5 9.6
C 6 7010.9 288.1 41706 47495 1186.9 19086.0 1770.8 55.4 9.1
C 7 8246.3 538.3 85784 75407 1815.8 114981.1 2270.5 58.1 9.5
C 8 5969.9 529.3 57033 55537 665.1 48750.1 2701.6 56.6 7.2
C 9 27299.0 930.2 112521 75146 1098.1 68058.8 5833.2 59.3 5.9
C 10 7536.1 80.0 67763 58290 752.7 34338.9 2194.2 55.6 11.0
C 11 1303.0 209.0 16301 24477 71.3 10219.1 310.2 58.8 13.7
C 12 10137.4 446.8 70173 65691 874.9 41829.4 4391.2 57.8 6.5
C 13 10394.4 271.6 70336 63685 1912.6 55148.1 3864.1 59.1 9.3
C 14 8372.1 540.3 72738 72805 581.9 25815.1 7557.4 58.3 5.9
C 15 15316.4 841.3 123763 71627 1508.9 120922.5 5472.7 56.6 10.6
C 16 5225.1 116.7 49044 54183 381.1 37058.2 2872.8 58.4 8.3
C 17 6399.4 184.6 62955 65310 821.9 44941.0 1448.5 59.8 7.7
C 18 8016.4 47.7 46833 49843 416.7 19914.5 2325.0 53.8 10.0
C 19 7953.8 287.6 86904 65534 530.6 69605.2 5603.2 62.1 5.0
C 20 11420.8 237.9 52922 57110 259.6 29604.1 1777.3 58.9 9.6
C 21 6812.2 161.6 59583 58008 509.9 34392.0 3061.2 57.0 8.0
C 22 8143.2 298.7 76904 58808 720.1 61514.6 1732.7 59.3 8.3
C 23 3716.9 58.9 37441 48255 236.8 15093.2 2347.4 59.0 6.9
C 24 7965.9 447.4 69725 58904 808.6 34334.3 1907.2 58.9 10.2
Figure 1: Clustering results of Ukraine‘s regions for data 2019.
objects in the new space – are in table 5. Note that in
this case, the degree of explanation of the variance of
the initial indicators by selected factors (degree of la-
tent indicators informativeness) is 77 % for 2019 and
79 % for 2020 data. These indicators indicate the
sufficiency of allocating exactly two principal com-
ponents as latent indicators for further analysis.
Table 4 analysis allows us to provide such an inter-
pretation of the selected principal components. Com-
ponent F
1
has high factor loadings values for the ini-
tial indicators X
1
− X
6
, and low for X
8
and X
9
. There-
fore, we can conclude that F
1
is an economic compo-
M3E2 2022 - International Conference on Monitoring, Modeling Management of Emergent Economy
150
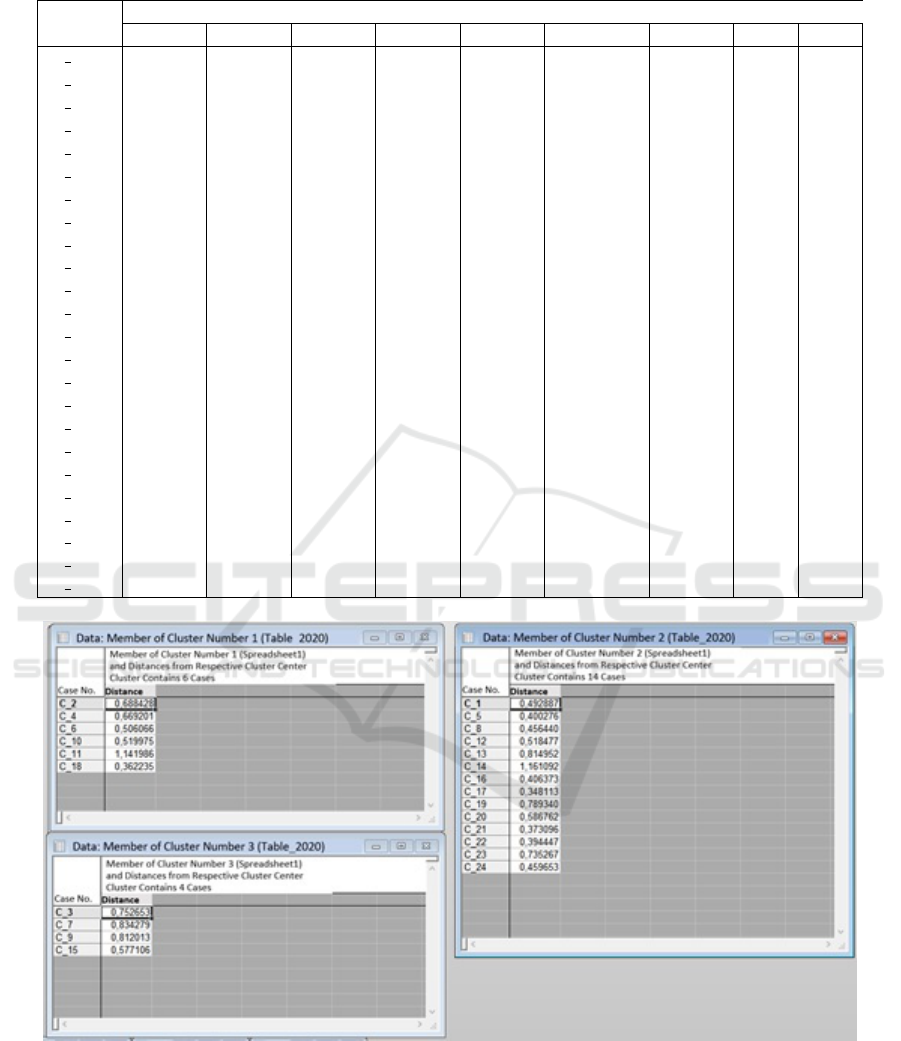
Table 3: Initial data for calculation for 2020 (MCTDU, 2021; SSSU, 2022).
Code
Values
X
1
X
2
X
3
X
4
X
5
X
6
X
7
X
8
X
9
C 1 6226.8 249.9 83175 70691 896.3 50771.9 7042.7 56.2 10.7
C 2 9319.5 240.8 73215 56603 624.7 31231.1 2465.0 48.9 12.5
C 3 15208.9 1426.0 122379 92083 2403.0 135366.4 5723.9 58.0 8.6
C 4 5355.9 424.0 49422 41662 956.0 62158.9 2470.6 49.2 14.9
C 5 5615.5 266.6 70247 67187 567.0 39163.6 1783.2 55.3 10.9
C 6 3192.3 193.3 48861 51073 1078.1 19249.3 1546.7 53.7 10.6
C 7 5864.6 851.4 91498 81949 1743.8 111716.8 1871.0 56.0 10.7
C 8 3630.9 402.0 63254 60276 555.3 45016.0 2822.3 54.1 8.4
C 9 12929.1 735.8 123267 79263 1102.6 70505.2 7089.9 57.8 6.9
C 10 5562.3 188.4 77816 63472 985.0 37684.9 1486.2 53.1 12.7
C 11 1086.3 74.4 18798 26714 60.9 8904.5 339.1 56.4 15.4
C 12 5880.9 639.3 85198 71150 927.4 44425.4 5709.3 56.0 7.6
C 13 5422.3 318.8 82149 68289 2018.3 55878.6 3017.5 57.3 10.7
C 14 6757.9 470.7 82903 80164 573.4 29687.1 12078.5 56.8 7.1
C 15 11829.0 1411.6 134449 77547 1680.3 115483.4 5940.1 54.8 12.0
C 16 3165.9 229.4 58332 58814 408.0 38908.7 2862.1 56.1 9.3
C 17 4763.8 321.9 70576 71117 918.7 43165.9 1612.1 56.8 9.4
C 18 5510.9 47.5 54833 55570 433.2 20508.6 2511.5 51.6 11.5
C 19 6178.4 344.0 92864 73218 556.1 66393.8 5509.5 59.9 6.2
C 20 3536.8 155.6 59987 63073 275.3 32008.3 1279.4 56.8 11.3
C 21 5784.0 94.8 65916 64824 531.1 37850.9 5301.7 54.8 9.9
C 22 4627.2 176.7 86319 64254 684.1 64414.0 2171.5 57.0 9.5
C 23 2533.5 61.8 46136 53875 187.5 15525.8 2428.7 56.5 8.9
C 24 5599.5 455.0 78118 64933 905.4 35004.1 2501.6 56.4 11.9
Figure 2: Clustering results of Ukraine‘s regions for data 2020.
nent of investment attractiveness, as the correspond-
ing indicators X
1
− X
6
are characteristics of economic
activity. For indicators X
8
and X
9
there are high val-
ues of factor loadings for component F
2
and low for
F
1
. Based on the essence of indicators X
8
and X
9
,
we can conclude that F
2
can be interpreted as a social
component of investment attractiveness. For indicator
X
7
, the value of factor loadings for the principal com-
ponent F
1
in 2019 exceeds the corresponding value
for component F
2
, although this excess is insignifi-
Application of Multidimensional Statistical Analysis Technology for Grouping Regions by the Investment Attractiveness Level
151

cant. In 2020, the situation was reversed. Based on
the essence of indicator X
7
, we can conclude that it
can characterize both the economic and social com-
ponents of regional development; that is, the interpre-
tation of the results is not essentially affected by this
indicator.
Table 4: Principal components’ factor loadings values for
data 2019 and 2020.
Principal components
2019 2020
Indicators
F
1
F
2
F
1
F
2
X
1
0.82 0.08 0.89 0.07
X
2
0.89 0.01 0.93 0.01
X
3
0.93 0.22 0.90 0.31
X
4
0.83 0.44 0.77 0.53
X
5
0.84 -0.25 0.87 -0.15
X
6
0.89 -0.13 0.93 -0.02
X
7
0.65 0.49 0.41 0.64
X
8
0.14 0.78 0.16 0.75
X
9
-0.25 -0.88 -0.21 -0.90
Table 5: Principal components’ values for data 2019 and
2020.
2019 2020
Code
F
1
F
2
F
1
F
2
C 1 -0.55 0.49 0.04 0.53
C 2 1.31 -1.74 -0.02 -1.46
C 3 -6.03 -1.21 2.75 0.02
C 4 1.94 -3.29 -0.03 -2.32
C 5 0.90 0.38 -0.32 -0.11
C 6 1.59 -0.61 -0.70 -0.56
C 7 -1.98 -1.24 1.23 -0.58
C 8 0.42 0.29 -0.46 0.20
C 9 -4.30 0.56 1.13 1.24
C 10 1.25 -0.69 -0.10 -0.94
C 11 4.42 -0.63 -1.68 -1.16
C 12 -0.75 0.91 0.14 0.87
C 13 -0.92 -0.33 0.42 -0.16
C 14 -1.30 1.93 -0.08 2.09
C 15 -3.60 -1.78 2.25 -0.85
C 16 1.44 0.93 -0.75 0.42
C 17 0.47 0.92 -0.22 0.31
C 18 2.19 -0.49 -0.73 -0.67
C 19 -1.36 2.47 -0.07 1.84
C 20 1.14 0.51 -0.79 0.11
C 21 0.96 0.65 -0.47 0.42
C 22 0.09 0.40 -0.20 0.35
C 23 2.22 1.68 -1.28 0.65
C 24 0.44 -0.10 -0.07 -0.23
Graphic representations of the regions in the space
of the identified principal components according to
the data of 2019 and 2020 are respectively presented
in figures 3 and 4.
Figure 3: Grouping results of Ukraine‘s regions in the latent
scale space for data 2019.
Figure 4: Grouping results of Ukraine‘s regions in the latent
scale space for data 2020.
Figure 3 analysis allows us to conclude that we
can also identify three clusters of regions. The re-
sulting clusters in terms of content correspond to the
formed clusters obtained by the k-means method. A
similar situation occurs in figure 4. The results of a
grouping of regions obtained using the principal com-
ponents method are identical to those obtained from
the clustering method.
However, it is worth noting. Figure 3 shows that
cluster number 1 can be divided into at least two
smaller clusters, including points C 7 (Zaporizhzhia
region) and C 15 (Poltava region) to one of them and
points C 3 (Dnipro region ) and C 9 (Kyiv region)
to the other. Similarly, points C 7 and C 15 can be
allocated from cluster number 2 to a separate clus-
ter. In the third cluster, we can distinguish points C 4
(Donetsk region) and C 11 (Luhansk region), which
form two different clusters. So, the cluster structure
may be more complex and require a more complex in-
terpretation of the results. A similar situation occurs
in figure 4.
However, according to the task, our study pro-
ceeded from a predetermined number of clusters. And
the methods used in the study gave identical results.
M3E2 2022 - International Conference on Monitoring, Modeling Management of Emergent Economy
152

5 CONCLUSIONS
Investment activity is always associated with a spe-
cific risk. Decision-making by potential investors
requires a comprehensive study of the object of in-
vestment, mainly through the various assessments of
the investment climate, business environment, and
business conditions provided by multiple institutions.
However, such estimates characterize the business en-
vironment of countries as a whole, while investors
are usually interested in the separate territories and
business units that are located there. Therefore, it is
necessary to conduct a comprehensive analysis of the
investment object to reduce the potential risks when
investing. One of the approaches is to assess its in-
vestment attractiveness. For individual territorial en-
tities, which are regions, it is advisable to determine
the quantitative measures of the level of investment
attractiveness and group them according to this in-
dicator. This will identify regions with roughly the
same investment climate. Given the significant multi-
dimensionality of the description of the studied phe-
nomenon, the solution of the grouping problem can
be solved by applying the methods of multidimen-
sional statistical analysis. In our study, we used the
k-means method of clustering, which allowed us to
divide the regions of Ukraine into relatively homo-
geneous groups according to the level of investment
attractiveness.
Data for 2019 and 2020 were chosen for the study.
These periods are characterized by the fact that at
this time, the economy of Ukraine, like most other
countries, came under the destructive influence of the
COVID-19 pandemic. We limited ourselves to the se-
lection of three clusters, which were given a meaning-
ful interpretation: the first one is a cluster with regions
that have a high level of investment attractiveness, the
second cluster contains regions with a medium level
of investment attractiveness, and the third cluster in-
cludes regions with a low level of investment attrac-
tiveness. Comparing clustering results for selected
periods showed that the cluster structure of Ukrainian
regions has not changed. To verify the correctness
of the obtained grouping of regions, the regions of
Ukraine were deployed in the space of latent indica-
tors, which were calculated on the same data set by
the method of principal components. A meaningful
analysis of factor loads showed that one latent axis
of the new space characterizes the economic compo-
nent of investment attractiveness, and the other - is the
social component. The results of grouping Ukraine’s
regions turned out to be identical to those obtained
by the k-means method. It was also concluded that it
would be more appropriate to allocate more clusters,
which would provide a more accurate picture of the
grouping of regions by the level of investment attrac-
tiveness. Such an assessment can be helpful for local
governments, as they provide information on the rel-
ative level of investment attractiveness of a particular
region compared to other territorial units and identify
weaknesses in the areas of activity on which the as-
sessment was based. Such results can be used to cre-
ate and adjust regional socio-economic development
programs, particularly in terms of planning to attract
investment into the region’s economy.
ACKNOWLEDGEMENTS
This study was supported by the State budget project
of Khmelnytskyi National University “Modeling the
strategies for safe development of innovation-oriented
socio-economic systems”, project’s registration num-
ber 0122U001212.
REFERENCES
Andrusiak, N. O., Andrusiak, V. M., and Danylchuk, H. B.
(2022). Assessment of ecological and economic
competitiveness of regions using factor analysis.
1049(1):012084. https://doi.org/10.1088/1755-1315/
1049/1/012084.
Blahun, I., L., D., and H., L. (2017). Simulative model
for evaluation of investment processes in the regions
of Ukraine. Investment Management and Financial
Innovations, 14(3):322–329. https://cutt.ly/UVTu9zE.
Blaschke, P. (2022). Investment incentives in the environ-
ment of the Czech Republic. E+M Economics and
Management, 25(1):4–23. https://doi.org/10.15240/
tul/001/2022-1-001.
Bruneckiene, J., Jucevicius, R., Zykiene, I., Rapsikevicius,
J., and Lukauskas, M. (2019). Assessment of invest-
ment attractiveness in european countries by artificial
neural networks: What competences are needed to
make a decision on collective well-being. Sustain-
ability, 11:6892. https://www.mdpi.com/2071-1050/
11/24/6892/htm.
Bushynskyi, Y. (2020). Kontsept faktoriv, shcho vyz-
nachaiut investytsiinu pryvablyvist rehionu [The con-
cept of factors determining the investment attrac-
tiveness of the region]. Herald of Khmelnytskyi
National University Economic sciences, 2(6):185–
190. http://journals.khnu.km.ua/vestnik/wp-content/
uploads/2021/03/38.pdf.
Cheba, K. (2017). Multidimensional analysis of invest-
ments attractiveness of selected european countries
from japanese investors’ perspective. In Proceedings
of Carpathian Logistics Congress - CLC 2017, pages
204–209, Ostrava Slovakia. TANGER Ltd. https:
//cutt.ly/mU2xq8p.
Application of Multidimensional Statistical Analysis Technology for Grouping Regions by the Investment Attractiveness Level
153

Danylchuk, H., Chebanova, N., Reznik, N., and Vitkovskyi,
Y. (2019). Modeling of investment attractiveness
of countries using entropy analysis of regional stock
markets. Global J. Environ. Sci. Manage, 5:227–235.
De Jongh, J. J. and Meyer, D. F. (2019). The mul-
tidimensional regional economic development index
(MREDI) applied in the north-west province: A
rural regional application. Administratio Publica,
27(3):162–185. https://cutt.ly/EVTaGVA.
Dorozynski, T. and Kuna-Marszałek, A. (2016). Invest-
ment attractiveness. The case of the Visegrad Group
countries. Comparative Economic Research. Central
and Eastern Europe, 19(1):117–138. https://doi.org/
10.1515/cer-2016-0007.
EBA (2020). Indeks investytsiinoi pryvablyvosti Ukrainy
2020 [Investment attractiveness index of Ukraine
2020]. https://cutt.ly/MU2j5w5.
Godlewska-Majkowska, H. (2018). Investment attrac-
tiveness of polish municipalities in relation to lo-
cal entrepreneurship. Olsztyn Economic Journal,
13(2):103–122. https://doi.org/10.31648/oej.2764.
Gorbatiuk, K., Mantalyuk, O., Proskurovych, O., and
Valkov, O. (2019). Analysis of regional develop-
ment disparities in ukraine using fuzzy clustering. In
Kiv, A., Semerikov, S., Soloviev, V. N., Kibalnyk,
L., Danylchuk, H., and Matviychuk, A., editors, Pro-
ceedings of the Selected Papers of the 8th Interna-
tional Conference on Monitoring, Modeling & Man-
agement of Emergent Economy, M3E2-EEMLPEED
2019, Odessa, Ukraine, May 22-24, 2019, volume
2422 of CEUR Workshop Proceedings, pages 194–
210. CEUR-WS.org. http://ceur-ws.org/Vol-2422/
paper16.pdf.
Heritage Foundation (2020). Index of Economic Freedom
2020. https://www.heritage.org/index/ranking.
Hryhoruk, P., Grygoruk, S., Khrushch, N., and Hov-
orushchenko, T. (2020a). Using non-metric multidi-
mensional scaling for assessment of regions’ econ-
omy in the context of their sustainable development.
In Kiv, A., editor, Proceedings of the Selected Papers
of the Special Edition of International Conference on
Monitoring, Modeling & Management of Emergent
Economy (M3E2-MLPEED 2020), Odessa, Ukraine,
July 13-18, 2020, volume 2713 of CEUR Workshop
Proceedings, pages 315–333. CEUR-WS.org. http:
//ceur-ws.org/Vol-2713/paper35.pdf.
Hryhoruk, P., Khrushch, N., and Grygoruk, S. (2019a). An
approach to design a composite index of economic
development and identifying the bounds of its levels.
In Proceedings of the 2019 9th International Confer-
ence on Advanced computer information technologies
ASIT’2019, pages 48–51, Ceske Budejovice Czech
Republic.
Hryhoruk, P., Khrushch, N., and Grygoruk, S. (2019b). The
rating model of Ukraine’s regions according to the
level of economic development. Periodicals of En-
gineering and Natural Sciences, 7(2):712–722. https:
//cutt.ly/BjAgnAL.
Hryhoruk, P., Khrushch, N., and Grygoruk, S. (2020b).
Using multidimensional scaling for assessment eco-
nomic development of regions. Journal of Industrial
Engineering & Production Research, 31(4):597–607.
https://cutt.ly/hVTsxRJ.
Hryhoruk, P., Khrushch, N., and Grygoruk, S. (2021).
Environmental safety assessment: a regional dimen-
sion. IOP Conference Series: Earth and Environ-
mental Science, 628:012026. https://doi.org/10.1088/
1755-1315/628/1/012026.
IMDWCC (2020). IMD World Competitiveness Cen-
ter. World Competitiveness Ranking. https://cutt.ly/
RU2kryT.
Jac, I. and Vondrackova, M. (2018). The perception
of selected aspects of investment attractiveness by
businesses making investments in the Czech Repub-
lic. E+M Ekonomie a Management, 20(3):103–
122. https://dspace.tul.cz/bitstream/handle/15240/
20918/EM
3 2017 08.pdf.
Kaminskyi, A., Miroshnychenko, I., and Pysanets, K.
(2019). Risk and return for cryptocurrencies as alter-
native investment: Kohonen maps clustering. Neiro-
Nechitki Tekhnolohii Modelyuvannya v Ekonomitsi,
2019(8):175–193.
Kearney (2020). Kearney Foreign Direct Investment
(FDI) Confidence Index. https://www.kearney.com/
foreign-direct-investment-confidence-index.
Kikkas, X. N. and Krasnozhenova, E. (2018). Modeling
investment attractiveness of Germany. In Proceed-
ings of the 5th International Multidisciplinary Scien-
tific Conference on Social Sciences and Arts SGEM
2018, pages 515–522, Sofia Bulgaria.
KOF (2020). KOF Globalization Index. https://cutt.ly/
DU2kuCW.
Korenyuk, P. and Kopil, E. (2018). Conceptual approaches
and methods for determining the investment attrac-
tiveness of the national economy. Economic Jour-
nal of Lesya Ukrainka Eastern European National
University, 2(14):56–62. https://doi.org/10.29038/
2411-4014-2018-02-56-62.
Kyshakevcyh, B. and Nakhaeva, M. (2021). Intehralna
otsinka investytsiinoi pryvablyvosti rehioniv Ukrainy
[Integrated assessment of investment attractiveness of
regions in Ukraine]. Herald of Khmelnytskyi Na-
tional University Economic sciences, (4):51–58. https:
//cutt.ly/MVTpdJ3.
Kyshakevych, B., Nahayeva, M., and Kry
´
nski, A. (2020).
The economic essence of the investment attractiveness
of the regions. Scientific Journal of Polonia Univer-
sity, 37(6):46–53. https://doi.org/10.23856/3704.
Lagler, K. (2020). Use of world experience in increasing
investment attractiveness of Ukraine regions. Eco-
nomics, Finance And Management Review, 2:63–70.
Leshchuk, H. (2020). Systematyzatsiia pidkhodiv do otsini-
uvannia investytsiinoi pryvablyvosti rehionu [System-
atization of the approaches to estimating the invest-
ment attractiveness of a region]. Uzhorod National
University Herald. International Economic Relations
and World Economy, (29):93–98. https://doi.org/10.
32782/2413-9971/2020-29-18.
Mazziotta, M. and Pareto, A. A. (2014). Composite index
for measuring Italian regions’ development over time.
M3E2 2022 - International Conference on Monitoring, Modeling Management of Emergent Economy
154

Rivista Italiana di Economia Demografia e Statistica,
LXVIII(3/4):127–134. https://cutt.ly/UVTo3op.
MCTDU (2021). Reitynhova otsinka rehioniv [Rating as-
sessment of regions]. https://cutt.ly/olpWxkF.
Meyer, D. F. and De Jongh, J. (2018). An alternative
multi-dimensional regional economic development in-
dex: a provincial application in South Africa. Interna-
tional Journal of eBusiness and eGovernment Studies,
10(1):97–113. https://cutt.ly/VVTaO7l.
Meyer, D. F., De Jongh, J., and Meyer, N. (2016). The
formulation of a composite regional development in-
dex. International Journal of Business and Manage-
ment Studies, 8(1):100–116. https://cutt.ly/cf5q8J2.
Moody’s (2020). Credit rating. https://www.moodys.com/.
Musolino, D. and Volget, S. (2020). Towards a multidimen-
sional approach to the study of territorial attractive-
ness. https://hal.archives-ouvertes.fr/hal-02501582.
Roszko-W
´
ojtowicz, E. and Grzelak, M. M. (2021). Multi-
dimensional analysis of regional investment attrac-
tiveness in Poland. Equilibrium. Quarterly Journal
of Economics and Economic Policy, 16(1):103–138.
https://cutt.ly/yVTdK70.
Shinkarenko, V., Matskul, M., and Linok, D. (2019). In-
vestment attractiveness modeling using multidimen-
sional statistical analysis methods. SHS Web of Con-
ferences, 65:04007. https://doi.org/10.1051/shsconf/
20196504007.
Sizova, N. D., Petrova, O. O., Solodovnik, G. V., and Perun,
M. U. (2017). Otsinka investytsiinoi pryvablyvosti
z vykorystanniam informatsiinoi systemy [Evalua-
tion of investment attractiveness using information
system]. Young Scientist, 4.4(44.4):90–93. http://
molodyvcheny.in.ua/files/journal/2017/4.4/21.pdf.
SSCU (2003). Pro zatverdzhennia Metodyky rozrakhunku
intehralnykh rehionalnykh indeksiv ekonomichnoho
rozvytku. Nakaz Derzhavnoho komitetu statystyky
Ukrainy 114 vid 15.04.2003 r. [On approval
of the Methodology for calculating integrated re-
gional indices of economic development. Order of
the State Statistics Committee of Ukraine 114 of
April 15, 2003]. https://zakon.rada.gov.ua/rada/show/
v0114202-03#Text.
SSSU (2022). Derzhavna sluzhba statystyky Ukrainy [State
Statistics Service of Ukraine]. http://www.ukrstat.gv.
ua.
Stadnyk, V., Izhevskiy, P., Khrushch, N., Lysenko, S.,
Sokoliuk, G., and Tomalja, T. (2020). Strategic pri-
orities of innovation and investment development of
the ukraine’s economy industrial sector. In Kiv, A.,
editor, Proceedings of the Selected Papers of the Spe-
cial Edition of International Conference on Monitor-
ing, Modeling & Management of Emergent Economy
(M3E2-MLPEED 2020), Odessa, Ukraine, July 13-
18, 2020, volume 2713 of CEUR Workshop Proceed-
ings, pages 145–166. CEUR-WS.org. http://ceur-ws.
org/Vol-2713/paper12.pdf.
Swidynska, N. and De Jesus, I. (2020). Determi-
nants of potential investment attractiveness of a
commune. Olsztyn Economic Journal, 15(2):129–
140. https://czasopisma.uwm.edu.pl/index.php/oej/
article/view/5836/4421.
Tenreiro Machado, J. A. and Mata, M. E. (2015a). Analysis
of world economic variables using multidimensional
scaling. PLoS ONE, 10(3):e0121277. https://cutt.ly/
nH4a5HP.
Tenreiro Machado, J. A. and Mata, M. E. (2015b). Mul-
tidimensional scaling analysis of the world economy
during the period 1972-2012. Acta Polytechnica Hun-
garica, 12(1):67–82. https://cutt.ly/4VTsSjT.
Transparency International (2020). Corruption Percep-
tions Index 2020. https://www.transparency.org/en/
cpi/2020.
Vartsaba, V. and Leshuk, H. (2017). Evaluation of invest-
ment attractiveness indicators of regions in Ukraine.
Baltic Journal of Economic Studies, 3(5):38–44.
https://doi.org/10.30525/2256-0742/2017-3-5-38-44.
Walesiak, M. (2017). The application of multidimensional
scaling to measure and assess changes in the level of
social cohesion of the Lower Silesia region in the pe-
riod 2005-2015. Econometrics, 3(57):9–25. https:
//cutt.ly/OVTaMeB.
WEF (2020). World Countries’ Ranking on the Global
Competitiveness Index. https://cutt.ly/rVR9tLo.
Windhyastiti, I., Hidayatullah, S., and Khouroh, U. (2020).
Investment attractiveness rating and factors affect-
ing. Accounting, pages 161–166. http://www.
growingscience.com/ac/Vol7/ac 2020 143.pdf.
WIPO (2020). Global Innovation Index. https://cutt.ly/
dU2kqQw.
World Bank (2021). The World Bank. Doing business 2020.
https://cutt.ly/qU2j9bN.
Yelnikova, Y. (2020). Reitynhuvannia rehioniv Ukrainy
za rivnem pryvablyvosti dlia vidpovidalnykh investyt-
sii [Ranking of the Ukraine regions by the level
of responsible investments attractiveness]. Investyt-
siyi: praktyka ta dosvid, (17-18):63–68. http://www.
investplan.com.ua/?n=17-18&y=2020.
Application of Multidimensional Statistical Analysis Technology for Grouping Regions by the Investment Attractiveness Level
155
