
Recurrence Measures of Complexity in Energy Market Dynamics
Andrii O. Bielinskyi
1,5 a
, Vladimir N. Soloviev
1,4 b
, Viktoria V. Solovieva
5 c
,
Serhiy O. Semerikov
1,2,3 d
and Michael Radin
6 e
1
Kryvyi Rih State Pedagogical University, 54 Gagarin Ave., Kryvyi Rih, 50086, Ukraine
2
Kryvyi Rih National University, 11 Vitalii Matusevych Str., Kryvyi Rih, 50027, Ukraine
3
Institute for Digitalisation of Education of the National Academy of Educational Sciences of Ukraine,
9 M. Berlynskoho Str., Kyiv, 04060, Ukraine
4
Kyiv National Economic University Named After Vadym Hetman, 54/1 Peremogy Ave., Kyiv, 03680, Ukraine
5
State University of Economics and Technology, 16 Medychna Str., Kryvyi Rih, 50005, Ukraine
6
Rochester Institute of Technology, 1 Lomb Memorial Dr, Rochester, NY 14623, U.S.A.
Keywords:
Crude Oil, Natural Gas, Recurrence Plot, Recurrence Quantification Analysis, Crash, Indicator-Precursor.
Abstract:
The instability of the price dynamics of the energy market from a theoretical point of view indicates the
inadequacy of the dominant paradigm of the quantitative description of pricing processes, and from a practical
point of view, it leads to abnormal shocks and crashes. Through the recurrence quantification analysis, we
analyze and construct indicators of intermittent events in energy indices, where periods of regular behavior
are replaced by periods of chaotic behavior, which could explain the emergence of crisis events. For further
analysis, we have chosen daily data of Henry Hub natural gas spot prices, WTI spot prices, and Europe Brent
spot prices. Our empirical results present that all of the presented recurrence measures respond in a particular
way during crashes and can be effectively implemented for risk management strategies.
1 INTRODUCTION
Global economic and financial systems rely on crude
oil to maintain stability, making it a strategic resource
for national economic development (Zhang and Wu,
2019; Dong et al., 2018). The importance of exam-
ining various factors that may affect crude oil prices
is therefore critical to investors, government agen-
cies, and other stakeholders. Many factors contribute
to crude oil price fluctuations, including fundamen-
tal factors (such as supply and demand of crude oil)
(Wu and Zhang, 2014) and non-fundamental factors
(such as speculations and investor sentiment) (Ji et al.,
2019). Specifically, the global economic environ-
ment, political security between oil-producing coun-
tries and their neighbors, and economic policy uncer-
tainty prove to have a significant impact on crude oil
prices.
a
https://orcid.org/0000-0002-2821-2895
b
https://orcid.org/0000-0002-4945-202X
c
https://orcid.org/0000-0002-8090-9569
d
https://orcid.org/0000-0003-0789-0272
e
https://orcid.org/0000-0001-9951-7955
Regarding the strategic role of crude oil in eco-
nomic progress, the market volatility of crude oil
prices has had a substantial negative effect on the
economy, specifically in those countries that are de-
pendent on imports of crude oil. The impact of many
drivers on crude oil price volatility has thus been in-
vestigated in a variety of publications, and crude oil
market mechanism has become a controversial topic
in academia (Coleman, 2012; Sari et al., 2011; D
´
ees
et al., 2007). While this was going on, some studies
underlined the substantial risks associated with crude
oil price changes, as well as their complexity and
stochastic nature (Zhang and Wang, 2015; Shahzad
et al., 2022; Yin and Wang, 2022; Zhang et al., 2023).
Oil prices are generally referred to as benchmark
prices by both WTI and Brent contracts. Hedge funds
and traders typically select one or the other contract.
Consequently, there is considerable interest in the
WTI-Brent pricing structure, including the shapes of
the futures curves, the absolute price differences be-
tween the two benchmarks, and the degree of integra-
tion between the two markets. Hedge funds and finan-
cial institutions heavily trade these markets (directly
and indirectly). As a result, the prices of jet fuel, heat-
122
Bielinskyi, A., Soloviev, V., Solovieva, V., Semerikov, S. and Radin, M.
Recurrence Measures of Complexity in Energy Market Dynamics.
DOI: 10.5220/0011931800003432
In Proceedings of 10th International Conference on Monitoring, Modeling Management of Emergent Economy (M3E2 2022), pages 122-133
ISBN: 978-989-758-640-8; ISSN: 2975-9234
Copyright
c
2023 by SCITEPRESS – Science and Technology Publications, Lda. Under CC license (CC BY-NC-ND 4.0)

ing oil, diesel, and gasoline are highly influenced by
these markets. The price spread between WTI and
Brent is also used as the basis for a number of deriva-
tive financial products, such as swaps and options.
The microeconomic theory states that the supply
and demand condition determines the fundamental
value of crude oil price assets. The financialization of
crude oil in the past decade, however, has increased
the role of speculation in crude oil prices, making the
process of determining crude oil prices more difficult
(Kilian, 2009; Flood and Hodrick, 1990).
The natural gas industry has achieved strong
growth in recent years because of the large demand
market, sufficient low-cost supply, and active global
natural gas trade. The forecasting of natural gas prices
is one of the most crucial topics in finance since
this resource is important for trading, electric power
production planning, and regulatory decision-making.
Nowadays, Henry Hub in the U.S., NBP in the U.K.,
and LNG in Japan represent major international trad-
ing centers of natural gas. These three centers have
become an important reference point for determining
the international level of natural gas prices. Among
them, Henry Hub has the highest market liquidity, the
largest influence, and the best reflection of the market
supply and demand. On the other hand, in addition to
the basic factors of supply and demand, the price of
natural gas is driven by multiple factors such as ex-
treme weather, wars, and geopolitics (Li et al., 2021).
Considering the highly nonlinear and non-
stationary characteristics of crude oil and natural gas
markets under the influence of complex factors, it is of
great research significance to improve the accuracy of
early identification of crisis phenomena in those mar-
kets. In this paper, we present indicators (indicators-
precursors) based on recurrence analysis.
2 METHODOLOGY OF
RECURRENCE ANALYSIS
In 1890 Poincar
´
e introduced Poincar
´
e recurrence the-
orem (Poincar
´
e, 2017), which states that certain sys-
tems return to their arbitrarily close, or exactly the
same initial states after a sufficiently long but finite
time. Such property in the case of deterministic be-
havior of the system allows us to make conclusions
regarding its future development.
2.1 Time Delay Method
The state of the system can be described by the set
of variables. Its observational state can be expressed
through a d-dimensional vector or matrix, where each
of its components refers to a single variable that rep-
resents a property of the system. After a while, the
variables change, resulting in different system states.
Usually, not all relevant variables can be captured
from our observations. Often, only a single variable
may be observed. Thakens’ theorem (Takens, 1981)
that was mentioned in previous sections ensures that
it‘s possible to reconstruct the topological structure of
the trajectory formed by the state vectors, as the data
collected for this single variable contains information
about the dynamics of the whole system.
For an approximate reconstruction of the origi-
nal dynamics of the observed system, we project the
time series onto a Reconstructed Phase Space (Eck-
mann and Ruelle, 1985; Kantz and Schreiber, 2003;
Ott et al., 1994) with the commonly used time delay
method (Kantz and Schreiber, 2003) which relied on
the embedding dimension and time delay.
The embedding dimension is being the dimension-
ality of the reconstructed system (corresponds to the
number of relevant variables that may differ from one
system to another. The time delay parameter specifies
the temporal components of the vector components.
2.2 Recurrence Plot
Recurrence plot (RP) have been introduced to study
dynamics and recurrence states of complex systems.
When we create RP, at first, from recorded time se-
ries we reconstruct phase-space trajectory. Then, ac-
cording to Eckmann et al. (Eckmann et al., 1987), we
consider a trajectory
⃗
X(i) on the reconstructed trajec-
tory. The recurrence plot is an array of dots in a N ×N
matrix, where dot is placed at (i, j) whenever
⃗
X( j) is
sufficiently close to
⃗
X(i), and both axes are time axes
which mathematically can be expressed as
R
i j
= Θ(ε−
⃗
X(i) −
⃗
X( j)
),
for i, j = 1, ...,N,
(1)
where ∥ ∥ is a norm (representing the spatial distance
between the states at times i and j); ε is a predefined
recurrence threshold, and Θ (·) is the Heaviside func-
tion. As a result, the matrix captures a total of N
2
binary similarity values.
Typically, L
p
-norm is applied to determine the
pairwise similarity between two vectors. According
to Webber and Zbilut (Webber and Zbilut, 2005), the
L
1
-norm (Taxicab metric), the L
2
-norm (Euclidean
metric), and the L
∞
-norm (Chebyshev metric) can
serve as candidates for measuring distance between
trajectories in phase space.
Also, as it can be seen from equation (1), the sim-
ilarity between vectors is determined by a threshold
Recurrence Measures of Complexity in Energy Market Dynamics
123

ε. The choice of ε > 0 ensures that all vectors that
lie within this radius are similar to each other, and
that dissimilarity up to a certain error is permitted
(Poincar
´
e, 2017).
The fixed radius for recurrent states is the com-
monly used condition, which leads to equally sized
ε-neighborhoods. The shape in which neighborhoods
lie is determined by the distance metric. Applying the
fixed threshold with the distance metric, we define re-
currence matrices that are symmetric along the middle
diagonal. The self-similarity of the multi-dimensional
vectors reflects in the middle diagonal, which is com-
monly referred to as the line of identity (LOI). In
contrast, it is not guaranteed that a recurrence ma-
trix is symmetric if the condition of the fixed number
of nearest neighbors is applied. For specific purposes
(e.g., quantification of recurrences), it can be useful to
exclude the LOI from the RP, as the trivial recurrence
of a state with itself might not be of interest (Charles
et al., 2015).
2.2.1 Recurrence Plots and their Structures
The main purpose of RP is the visualization of tra-
jectories and hidden patterns of the systems (Marwan
et al., 2007; Charles et al., 2015).
The dots within RP, representing the time evolu-
tion of the trajectories, exhibit characteristic large-
scale and small-scale patterns. Large-scale patterns
of RP can be classified as
• homogeneous – autonomous and stationary sys-
tems, which consist of many recurrence points
that are homogeneously distributed (relaxation
times are short);
• periodic – long, uninterrupted, and diagonally
oriented structures that represent which indicate
periodic behavior. These lines are usually dis-
tributed regularly;
• drift – systems with patterns paling or darkening
from the LOI to the outer corners of RP;
• disrupted – systems with drastic changes as well
as extreme events in the system dynamics.
The small-scale clusters can represent a combina-
tion of isolated dots (abrupt events). Similar evolu-
tion at different periods in time or in reverse temporal
order will present diagonal lines (deterministic struc-
tures) as well as vertical/horizontal lines to inscribe
laminar states (intermittency) or systems that paused
at singularities. For the quantitative description of the
system, such small-scale clusters serve the base of the
recurrence quantification analysis (RQA).
2.3 Recurrence Quantification Analysis
The graphic representation of the system suits per-
fectly for a qualitative description. However, the
main disadvantage of graphical representation is that
it forces users to subjectively intuit and interpret pat-
terns and structures presented within the recurrence
plot. Also, with the increasing size of RP, they can be
hardly depicted on graphical display as a whole. As
a result, we need to work with separated parts of the
original plot. Analysis in such a way may create new
defects, which should distort objectivity of the ob-
served patterns and lead to incorrect interpretations.
To overcome such limitation and spread an objective
assessment among observers, in the early 1990s by
Webber and Zbilut (Webber and Zbilut, 1994; Zbilut
and Webber, 1992) were introduced definitions and
procedures to quantify RP’s complexity, and later, it
has been extended by Marwan et al. (Marwan et al.,
2002).
The first known measure of the RQA is recurrence
rate, which measures the probability that the studied
process will recur (RR):
RR =
1
N
2
N
∑
i, j=1
R
i, j
. (2)
Another measure is based on frequency distribu-
tion of line structures in the RP. First, we consider the
histogram of the length of the diagonal structures in
the RP
P(l) =
N
∑
i, j=1
(1 − R
i−1, j−1
)
× (1 − R
i+l, j+l
)
l−1
∏
k=0
R
i+k, j+k
.
(3)
The percentage of recurrence points that form di-
agonal segments of minimal length l
min
parallel to the
main diagonal is the measure of determinism (DET ):
DET =
N
∑
l=l
min
lP(l)
,
N
∑
l=1
lP(l). (4)
Systems that are characterized by long diagonal
lines are presented to be periodic. From chaotic
signals, we would expect short diagonal lines, and
stochastic processes would not present any diagonal
lines. Performing the RQA, typically, we rely on the
lines with minimal length, which excludes the shorter
lines, which may be spurious for characterizing deter-
ministic processes. In our case, l
min
= 2 is considered.
In case when l
min
= 1, DET and RR are identical.
Considering diagonal line segments, we can em-
phasize the longest one – L
max
. This indicator mea-
sures the maximum time that two trajectories remain
M3E2 2022 - International Conference on Monitoring, Modeling Management of Emergent Economy
124

close to each other and can be interpreted as the max-
imum prediction time:
L
max
= max(
{
l
i
|i = 1, .. .,N
l
}
), (5)
where N
l
=
∑
l⩾l
min
P(l) is the total number of diago-
nal lines.
Divergence (DIV ) is the inverse of L
max
charac-
terizes the exponential divergence of the phase space
trajectory (Goldberger et al., 2000; Kirchner et al.,
2014):
DIV = 1
.
L
max
. (6)
For longer diagonal lines system is more deter-
ministic and, therefore, the measure of divergence is
also lower. The smaller L
max
, the more divergent are
trajectories and more chaotic the studied system. Ac-
cording to Eckmann et al. (Eckmann et al., 1987),
DIV can be used to estimate the largest positive Lya-
punov exponent.
Another measure which is related to the diago-
nal line segments is the average diagonal line length
(L
mean
):
L
mean
=
∑
N
l=l
min
lP(l)
.
∑
N
l=l
min
P(l) (7)
It can be interpreted as the mean prediction hori-
zon of the system, and it measures average time that
two trajectories remain close to each other.
Using the classic Shannon entropy, we can mea-
sure the hidden complexity of recurrence structures
in the RP. In accordance with this study, the entropy
of diagonal line histogram (DLEn) is of the greatest
interest. It can be defined as:
DLEn = −
N
∑
l=l
min
p(l) ln p(l) (8)
and
p(l) = P(l)
.
N
∑
l=l
min
P(l), (9)
where p(l) captures the probability that a diagonal
line has exactly length l, and DLEn reflects the com-
plexity of deterministic structure in the system. The
more uniform is the frequency distribution of diago-
nal lines, the higher the value of DLEn. If there is
predominant deterministic behavior with a particular
period l, then DLEn becomes lower.
As it was mentioned, the RP structure consists
of vertical (horizontal lines). For them Marwan and
Webber (Marwan and Webber, 2015) proposed addi-
tional recurrence measures. The first of them is the
laminarity (LAM) Analogously to the equation (4),
which measures the percentage of diagonal lines with
minimal length l
min
in the RP, we can calculate the
fraction of recurrence points forming vertical struc-
tures of minimal length v
min
:
LAM =
N
∑
v=v
min
vP(v)
.
N
∑
v=1
vP(v) (10)
with
P(v) =
N
∑
i, j=1
(1 − R
i, j−1
)
× (1 − R
i, j+v
)
v−1
∏
k=0
R
i, j+k
(11)
as the histogram of lengths of vertical lines.
Since it measures the overall amount of vertical
lines, it characterizes the percentage of laminar states
within the system. If LAM increases, then there are
more vertical or diagonal structures than isolated re-
current points.
Similarly to L
max
, we can define the measure
which will indicate the maximum time that a system
holds an unchangeable pattern – the maximal vertical
lines length (V
max
):
V
max
= max(
{
v
i
|i = 1, .. .,N
v
}
), (12)
where N
v
=
∑
v⩾v
min
P(v) is the total number of verti-
cal lines.
Vertical line divergence (V DIV ) is the analogous
to (6), which can be related to the rate of divergence
from laminar state:
V DIV = 1
.
V
max
. (13)
Consequently, we can define the average time that
two trajectories remain at a specific state – trapping
time (T T ):
T T =
∑
N
v=v
min
vP(v)
.
∑
N
v=v
min
P(v). (14)
For high T T values we would expect the system to
consist of more laminar states, whereas low T T val-
ues would indicate abrupt changes in the system’s dy-
namics.
The variability of laminar states with different du-
ration time can be measured in the same way as for
diagonal lines – using Shannon entropy. The com-
plexity of vertical lines can be measures according to
the following equation:
V LEn = −
N
∑
v=v
min
p(v)ln p(v) (15)
with
p(v) = P(v)
.
N
∑
v=v
min
P(v) (16)
Recurrence Measures of Complexity in Energy Market Dynamics
125
indicating the probability of a vertical line to have
length v ⩾ v
min
.
In the same manner, we can quantify the variation
(complexity) of abrupt changes during the studied pe-
riods in the energy markets. Regarding equation (7),
we can quantify the average time of divergence when
two trajectories in the phase-space remain out of re-
currence threshold ε. This measure can be called as
average white vertical line length (WV L
mean
):
WV L
mean
=
N
∑
w=w
min
wP(w)
.
N
∑
w=w
min
P(w), (17)
where P(w) is the frequency of white vertical lines in
the RP. This measure can be interpreted as the mean
horizon of unpredictability of the system.
This kind of complexity is associated with the
white vertical lines in the RP and can be quantified
in the following way:
WV LEn = −
N
∑
w=w
min
p(w)ln p(w) (18)
with
p(w) = P(w)
.
N
∑
w=w
min
P(w) (19)
indicating the probability of a white vertical line to
have length w ⩾ w
min
.
The further measure is based on the ration be-
tween DET and RR, and known as ratio (DET /RR):
DET /RR = N
2
∑
l=l
min
P(l)
.
N
∑
l=1
lP(l)
!
2
(20)
In the same manner, we can define another mea-
sure which is based on the ratio between LAM and
DET :
LAM/DET =
N
∑
v=v
min
vP(v) ·
N
∑
l=1
lP(l)
.
N
∑
v=1
vP(v) ·
N
∑
l=l
min
lP(l).
(21)
This measures can be used to uncover hidden tran-
sitions in the dynamics of the system (Webber and
Zbilut, 1994).
3 RESULTS AND ANALYSIS
Regarding previous studies, we present additional
analysis on co-movement between 3 energy-related
indices and construct indicators or indicators-
precursors based on the using recurrence analysis.
The presented work uses daily data of Henry Hub
natural gas spot prices (US$/MMBTU) ranged from
7 February 1997 to 18 October 2022; Cushing, OK
WTI spot prices FOB (US$/BBL) ranged from 20
May 1987 to 17 October 2022; Europe Brent spot
prices FOB (US$/BBL) ranged from 20 May 1987 to
17 October 2022 (U.S. Energy Information Adminis-
tration, 1997, 1986).
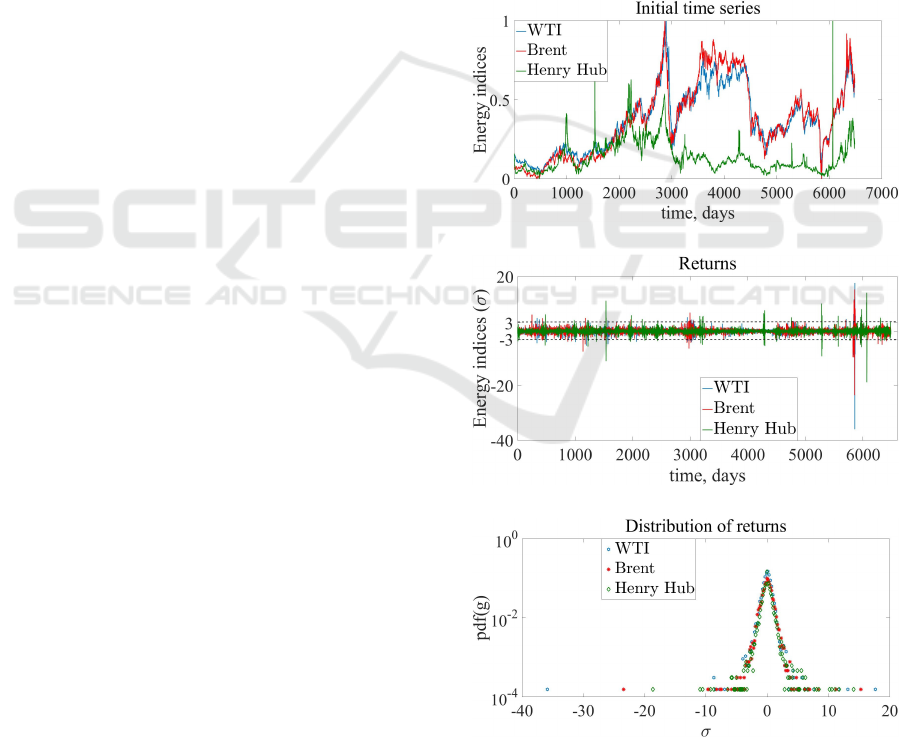
In figure 1 are presented:
• the dynamics of the initial time series;
• standardized returns, where returns can be calcu-
lated as G(t) = [x(t + ∆t) − x(t)]/x(t) and their
standardized version as g(t) = [G(t) − ⟨G⟩]/σ;
• probability density function of the standardized
returns.
(a)
(b)
(c)
Figure 1: Initial time series (a), standardized returns (b),
and pdf of standardized returns of WTI spot prices (WTI),
Europe Brent spot prices (Brent), and Henry Hub natural
gas spot prices (Henry Hub).
M3E2 2022 - International Conference on Monitoring, Modeling Management of Emergent Economy
126
We can see that most periods in energy markets
are defined by events that exceed ±3σ. Both WTI and
Brent returns are characterized by much more exten-
sive crashes. Previous studies pointed out that such
events are located in fat-tails of the probability dis-
tribution. Such crashes are the main source of high
complexity and non-linearity in the studied systems.
Most of our results are based on the sliding win-
dow approach. The idea here is to take a sub-window
of a predefined length w. For that sub-window, we
perform recurrence quantification analysis, get neces-
sary indicators that are appended to the array. Then,
the window is shifted by a predefined time step h, and
the procedure is repeated until the time series is com-
pletely exhausted.
We have performed RQA under sliding window
procedure for standardized returns and standardized
initial time series (Soloviev et al., 2020; Bielinskyi
and Soloviev, 2018; Bielinskyi et al., 2022, 2021c,b,
2020). We have found that standardized initial time
series better expresses internal complexity and recur-
rent properties of the energy market indices.
RQA was performed for the following parameters:
• embedding dimension d
E
= 1;
• time delay τ = 1;
• recurrence threshold ε = 0.3;
• L
2
-norm as a candidate for measuring distance be-
tween trajectories in phase space;
• minimum diagonal line length l
min=2
;
• minimum vertical line length v
min
= 2;
• minimum white vertical line length w
min
= 2;
• sliding window length w = 500 days;
• sliding window time step h = 1 day.
Worth to mention that the experiments were per-
formed for sliding window lengths of 250 days and
500 days. We have chosen the second option since it
represents a more reliable and smoother dynamics of
all the presented indicators. All described measures
result into highly volatile variation with the sliding
window of 250 days that difficult to interpret.
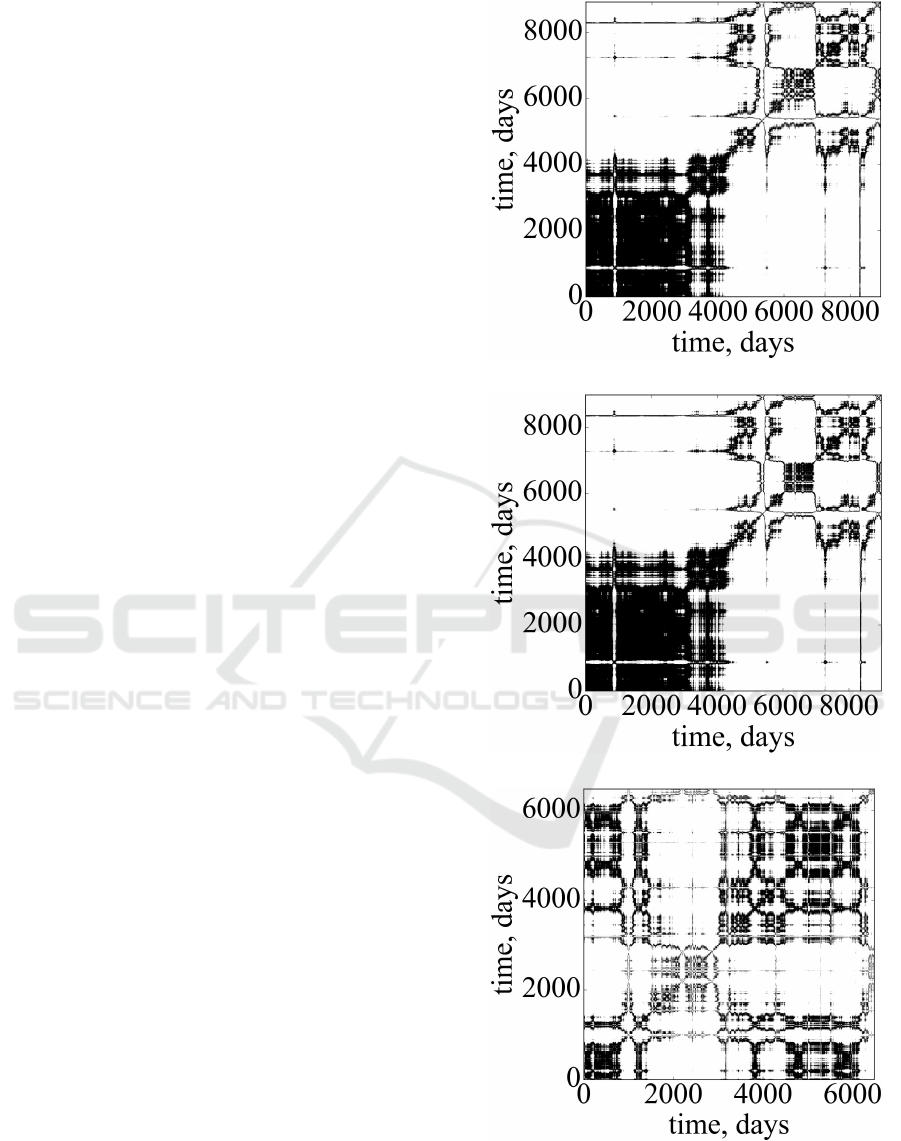
In figure 2 are presented RPs for the studied series.
Recurrence plots in figure 2 represent that the
studied energy markets are highly inhomogeneous.
As it was expected, nonlinear structure of WTI and
Brent is presented to be very similar, comparing to
Henry Hub. Recurrence structure of all indices varies
across time. They do not follow a certain pattern, pre-
sented to be non-periodic, and there are differences
in the patterns that concern the frequency of their ap-
pearance, shape, and size. It should be noticed that
for the oil markets first 4000 days are presented to be
(a)
(b)
(c)
Figure 2: Recurrence plots calculated for WTI (a), Brent
(b), and Henry Hub (c) standardized time series.
Recurrence Measures of Complexity in Energy Market Dynamics
127
highly recurrent, while the remaining days seem to be
more volatile, which is indicated by high proportion
of white regions. The recurrence structure of Henry
Hub index is presented to be more uniformly dis-
tributed. The variations of recurrence patterns should
be more noticeable during crashes. Recurrence quan-
titative indicators should give a more accurate repre-
sentation of the complex, chaotic structure of the stud-
ied markets.
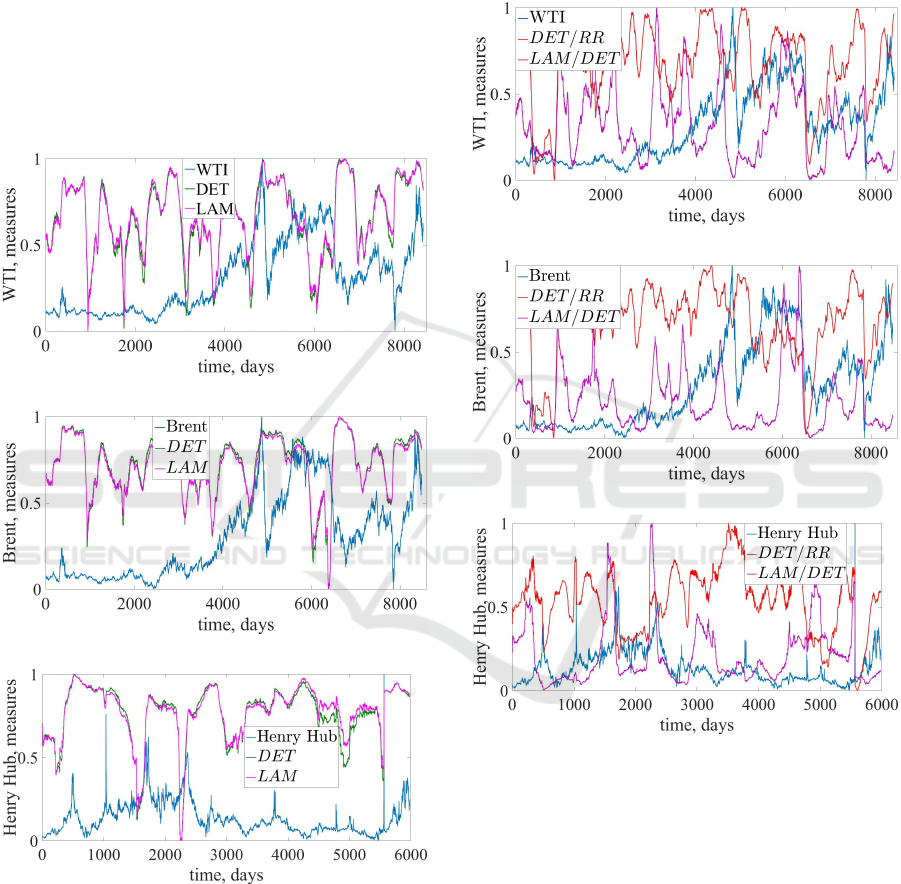
Figure 3 represents recurrence measures of deter-
minism (DET ) and laminarity (LAM).
(a)
(b)
(c)
Figure 3: Recurrence measures of determinism (DET ) and
laminarity (LAM) calculated for WTI (a), Europe Brent (b),
and Henry Hub (c) indices.
In figure 3 we see that DET and LAM increase
during crisis events of all markets. We may conclude
that those critical states are characterized by high de-
gree of laminarity and determinism. Crashes are pre-
sented to be highly complex and deterministic. Their
degree of predictability becomes higher, and corre-
sponding recurrence measures seem to be indicators
or even indicators-precursors of such changes.
Figure 4 represents recurrence measures of ratios
DET /RR and LAM/DET .
(a)
(b)
(c)
Figure 4: Recurrence measures (DET /RR) and
(LAM/DET ) calculated for WTI (a), Europe Brent
(b), and Henry Hub (c) indices.
From figure 4 we can see that both measures de-
crease during crisis events of energy indices. For ratio
DET /RR we may say that the overall percentage of
recurrence points in RP becomes higher than the per-
centage of only diagonal structures in RP. For ratio
LAM/DET we see precisely the same behavior dur-
ing crashes, i.e., it starts to decline during crisis or
even in advance. Thus, it can be seen that the over-
all determinism of the system during crashes is much
higher than the degree of laminarity.
Figure 5 shows recurrence measures of diagonal
M3E2 2022 - International Conference on Monitoring, Modeling Management of Emergent Economy
128
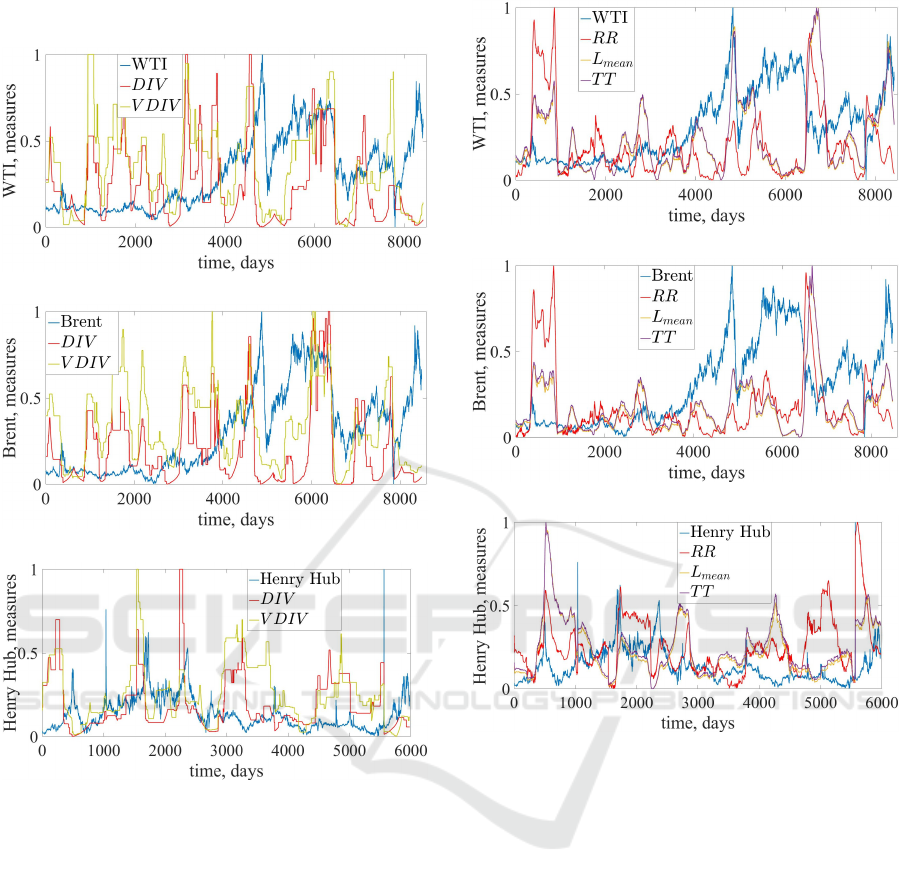
(DIV ) and vertical line (V DIV ) divergences.
(a)
(b)
(c)
Figure 5: Recurrence measures of diagonal line divergence
(DIV ) and vertical line divergence (V DIV ) calculated for
WTI (a), Europe Brent (b), and Henry Hub (c) indices.
Figure 5 demonstrates that the divergence of deter-
ministic and laminar structure of energy-related mar-
kets becomes lower during critical states. Since both
measures are inverse quantities to maximum diagonal
and vertical line length (L
max
and V
max
), such behav-
ior has to be obvious. Previous measures have made
it clear to us that the crisis phenomena of energy in-
dices are characterized by a high degree of determin-
ism and laminarity. In this case, the lengths of diag-
onal and vertical lines should also increase, which in-
dicate an increase in the horizon of predictability and
immutability.
Figure 6 represents recurrence measures of recur-
rence rate (RR), average diagonal line length (L
mean
),
and trapping time (T T ).
(a)
(b)
(c)
Figure 6: Recurrence measures of recurrence rate (RR), av-
erage diagonal line length (L
mean
), and trapping time (T T )
calculated for WTI (a), Europe Brent (b), and Henry Hub
(c) indices.
In figure 6 we see that recurrence rate increases
during crisis phenomena. This means that the total
number of trajectories in the phase space that are close
enough to each other becomes larger on the eve of a
crisis or at the moment of its onset. Thus, the proba-
bility of recurrence state increases during crash. Re-
garding previous measures, RR and L
mean
, we see that
the average degree of predictability during crisis in-
creases. The same can be seen for trapping time: aver-
age degree of changeability increases during crashes.
Based on this indicator, we may conclude that the sys-
tem is ‘trapped’ in a state of crisis.
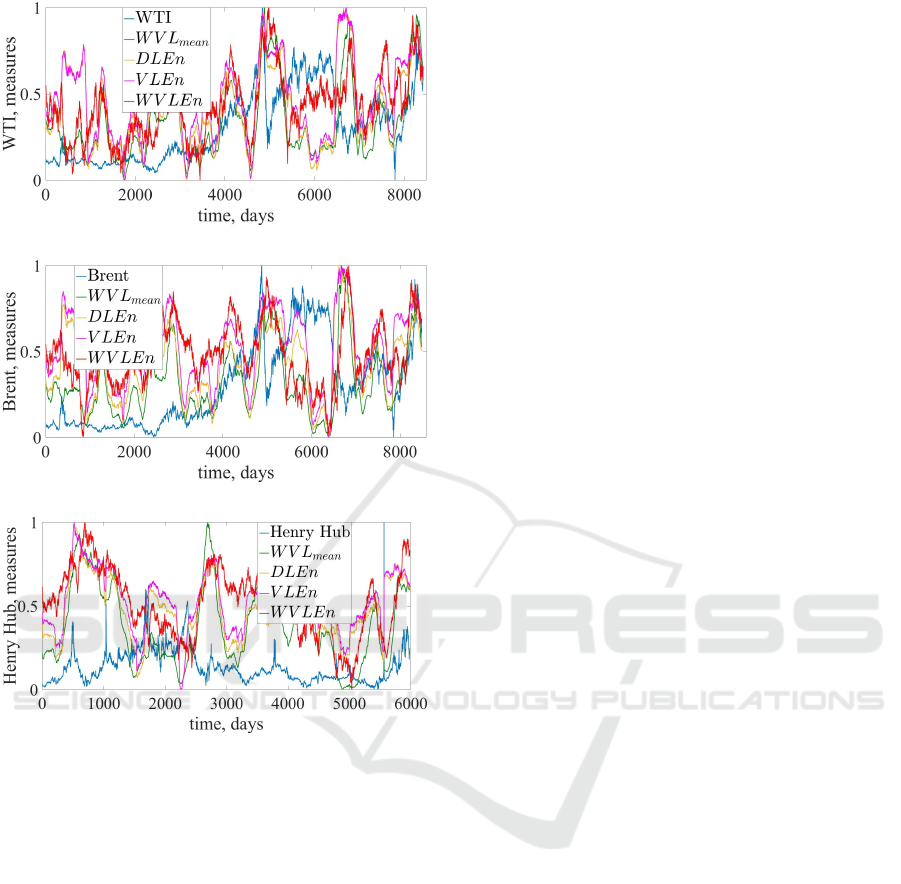
Figure 7 presents recurrence measures of aver-
age white vertical line length (WV L
mean
), and diago-
nal, vertical and white vertical line entropies (DLEn,
V LEn, and WV LEn).
From figure 7 we can see that all the presented
Recurrence Measures of Complexity in Energy Market Dynamics
129
(a)
(b)
(c)
Figure 7: Recurrence measures of average white vertical
line length (WV L
mean
), diagonal line entropy (DLEn), ver-
tical line entropy (V LEn), and white vertical line entropy
(WV LEn) calculated for WTI (a), Europe Brent (b), and
Henry Hub (c) indices.
quantitative measures of recurrence begin to increase
during crises, indicating a special state of the market
at these points in time. The average white vertical
line length shows that crisis events are characterized
not only by the determinism of the dynamics of mar-
ket movement, but also by the dissimilarity of these
events to many previous ones, since the length of the
white vertical lines is becoming an increasing trend.
It can also be said that the market represents a much
more deterministic structure than a laminar one. Also,
the degree of volatility of these events can knock the
market dynamics out of the limits of the epsilon value.
The diagonal line entropy also shows an increas-
ing trend. Since the Shannon entropy is maximal with
a uniform distribution, it can be concluded that the
collapse events of energy indices are characterized by
different horizons of predictability. That is, in the pre-
crisis dynamics there is no black diagonal line of the
same length, which is the dominant one. During a cri-
sis, horizons of determinism appear, which gain even
more weight if compared with the rest.
The vertical line entropy increases similarly to
DLEn. We may assume that similarly to diagonal
lines laminar states have different horizons of invari-
ability during crash events, and these horizons of in-
variability have greater tendency to uniform distribu-
tion.
The white vertical line entropy increases similarly
to other entropies. This dynamics is consistent with
the WV L
mean
measure.
4 CONCLUSIONS
In this paper, we have studied highly nonlinear and
nonstationary dynamics of oil and gas markets from
the perspective of the recurrence analysis. Taking
into account daily data of Henry Hub natural gas spot
prices from 7 February 1997 to 18 October 2022, WTI
spot prices from 20 May 1987 to 17 October 2022,
and Europe Brent spot prices for the same period as
WTI, we have drown some conclusions from the em-
pirical results.
Firstly, recurrence plots presented that the stud-
ied markets demonstrate highly inhomogeneous. As
it was expected, nonlinear structure of WTI and Brent
is presented to be very similar, comparing to Henry
Hub. Recurrence structure of all indices varies across
time. They do not follow a certain pattern, and there
are differences in frequency, shape, and size of black-
and white-dot patterns that appear across time.
From quantitative measures of complexity, we
have drawn the following conclusions:
1. Crash events of energy-related indices are charac-
terized by high degree of laminarity and determin-
ism. Crashes are presented to be highly complex
and deterministic.
2. The overall percentage of recurrence points in RP
becomes higher than the percentage of only diag-
onal structures in RP. At the same time, the per-
centage of diagonal lines in RP during crises is
much higher than the percentage of vertical lines.
Thus, the overall degree of determinism is larger
than laminarity.
3. The divergence of deterministic and laminar
structure of WTI, Brent, and Henry Hub becomes
lower during critical states that indicate higher de-
gree of repeatability in the dynamics of the stud-
ied systems. Also, it gives understanding that
M3E2 2022 - International Conference on Monitoring, Modeling Management of Emergent Economy
130

the phase-space trajectories become close to each
other during critical phenomena of financial sys-
tems.
4. Such measures as recurrence rate, mean diagonal
line length, and trapping time also increase dur-
ing crisis phenomena. This means that the total
number of trajectories in the phase space that are
close enough to each other becomes larger before
or during crash. Therefore, the probability of re-
currence state increases, and the average degree of
predictability becomes higher. A larger portion of
vertical lines indicates that the system is ‘trapped’
in a state of crisis for a particular period of time.
5. Entropy-based measures and, particularly, white
vertical line measures show that energy-related in-
dices represent complex nonlinear patterns that
combine not only horizons of determinism and
laminarity, but also some dissimilarity patterns re-
flected into white lines.
The applied approach to WTI, Brent, and Henry
Hub indices approve that the energy market is an
open, highly complex, chaotic, and nonlinear sys-
tem that depends on different technical and funda-
mental factors. Although RPs and RQA give promis-
ing results for crisis prediction and the construction
of early-warning indicators, it needs further develop-
ment to give applicable trading strategies relying on
recurrence indicators and further development of au-
tonomous trading bots.
Also, since the proposed recurrence measures are
only indicators (indicators-precursors) that give the
possibility to monitor crisis phenomena at a particular
moment of the market’s existence, forecasting of such
events requires integration of the proposed indicators
with the particular forecasting models (Yin and Wang,
2022; Fang et al., 2023; Li et al., 2021; Zhang et al.,
2023; Zou et al., 2023; Guliyev and Mustafayev,
2022; Kiv et al., 2021). It seems a promising direction
at the junction of artificial intelligence and fuzzy logic
methods (Bielinskyi et al., 2021a; Bondarenko, 2021;
Kmytiuk and Majore, 2021; Kobets and Novak, 2021;
Kucherova et al., 2021; Lukianenko and Strelchenko,
2021; Miroshnychenko et al., 2021).
At the same time, we intend to investigate cross-
recurrences between energy indices and different
technical and fundamental indicators using such ap-
proaches as cross- and joint-recurrence quantification
analysis (Ashe and Egan, 2023; He and Huang, 2020;
Romano et al., 2004).
ACKNOWLEDGMENTS
This work was supported by the Ministry of
Education and Science of Ukraine (project No.
0122U001694).
REFERENCES
Ashe, S. and Egan, P. (2023). Examining financial and
business cycle interaction using cross recurrence plot
analysis. Finance Research Letters, 51:103461. https:
//doi.org/10.1016/j.frl.2022.103461.
Bielinskyi, A., Semerikov, S., Serdyuk, O., Solovieva,
V., Soloviev, V. N., and Pichl, L. (2020). Econo-
physics of sustainability indices. In Kiv, A., edi-
tor, Proceedings of the Selected Papers of the Spe-
cial Edition of International Conference on Monitor-
ing, Modeling & Management of Emergent Economy
(M3E2-MLPEED 2020), Odessa, Ukraine, July 13-
18, 2020, vol. 2713 of CEUR Workshop Proceedings,
pages 372–392. CEUR-WS.org. https://ceur-ws.org/
Vol-2713/paper41.pdf.
Bielinskyi, A., Soloviev, V., Semerikov, S., and Solovieva,
V. (2021a). Identifying stock market crashes by fuzzy
measures of complexity. Neiro-Nechitki Tekhnolohii
Modelyuvannya v Ekonomitsi, 2021(10):3–45. https:
//doi.org/10.33111/nfmte.2021.003.
Bielinskyi, A. O., Hushko, S. V., Matviychuk, A. V.,
Serdyuk, O. A., Semerikov, S. O., and Soloviev, V. N.
(2021b). Irreversibility of financial time series: a case
of crisis. In Kiv, A. E., Soloviev, V. N., and Se-
merikov, S. O., editors, Proceedings of the Selected
and Revised Papers of 9th International Conference
on Monitoring, Modeling & Management of Emergent
Economy (M3E2-MLPEED 2021), Odessa, Ukraine,
May 26-28, 2021, volume 3048 of CEUR Workshop
Proceedings, pages 134–150. CEUR-WS.org. https:
//ceur-ws.org/Vol-3048/paper04.pdf.
Bielinskyi, A. O., Matviychuk, A. V., Serdyuk, O. A.,
Semerikov, S. O., Solovieva, V. V., and Soloviev,
V. N. (2022). Correlational and non-extensive na-
ture of carbon dioxide pricing market. In Ignatenko,
O., Kharchenko, V., Kobets, V., Kravtsov, H., Tara-
sich, Y., Ermolayev, V., Esteban, D., Yakovyna, V.,
and Spivakovsky, A., editors, ICTERI 2021 Work-
shops, volume 1635 CCIS of Communications in
Computer and Information Science, pages 183–199,
Cham. Springer International Publishing. https://doi.
org/10.1007/978-3-031-14841-5 12.
Bielinskyi, A. O., Serdyuk, O. A., Semerikov, S. O., and
Soloviev, V. N. (2021c). Econophysics of cryptocur-
rency crashes: a systematic review. In Kiv, A. E.,
Soloviev, V. N., and Semerikov, S. O., editors, Pro-
ceedings of the Selected and Revised Papers of 9th
International Conference on Monitoring, Modeling &
Management of Emergent Economy (M3E2-MLPEED
2021), Odessa, Ukraine, May 26-28, 2021, volume
3048 of CEUR Workshop Proceedings, pages 31–
Recurrence Measures of Complexity in Energy Market Dynamics
131

133. CEUR-WS.org. https://ceur-ws.org/Vol-3048/
paper03.pdf.
Bielinskyi, A. O. and Soloviev, V. N. (2018). Complex
network precursors of crashes and critical events in
the cryptocurrency market. CEUR Workshop Pro-
ceedings, 2292:37 – 45. https://ceur-ws.org/Vol-2292/
paper02.pdf.
Bondarenko, M. (2021). Modeling relation between at-
the-money local volatility and realized volatility of
stocks. Neiro-Nechitki Tekhnolohii Modelyuvannya
v Ekonomitsi, 2021(10):46–66. https://doi.org/10.
33111/nfmte.2021.046.
Charles, L., Webber, J., Cornel, I., and Norbert, M., edi-
tors (2015). Recurrence Plots and Their Quantifica-
tions: Expanding Horizons, vol.180 of Springer Pro-
ceedings in Physics. Springer. https://doi.org/10.1007/
978-3-319-29922-8.
Coleman, L. (2012). Explaining crude oil prices using
fundamental measures. Energy Policy, 40:318–324.
https://doi.org/10.1016/j.enpol.2011.10.012.
Dong, Y., Zhang, M., and Zhou, R. (2018). Classification
of network game traffic using machine learning. In
Yuan, H., Geng, J., Liu, C., Bian, F., and Surapunt,
T., editors, Geo-Spatial Knowledge and Intelligence,
pages 134–145, Singapore. Springer Singapore. https:
//doi.org/10.1007/978-981-13-0893-2 15.
D
´
ees, S., Karadeloglou, P., Kaufmann, R. K., and S
´
anchez,
M. (2007). Modelling the world oil market: Assess-
ment of a quarterly econometric model. Energy Pol-
icy, 35(1):178–191. https://doi.org/10.1016/j.enpol.
2005.10.017.
Eckmann, J.-P., Kamphorst, S. O., and Ruelle, D. (1987).
Recurrence plots of dynamical systems. Europhysics
Letters (EPL), 4(9):973–977. https://dx.doi.org/10.
1209/0295-5075/4/9/004.
Eckmann, J.-P. and Ruelle, D. (1985). Ergodic theory of
chaos and strange attractors. Rev. Mod. Phys., 57:617–
656. https://doi.org/10.1103/RevModPhys.57.617.
Fang, T., Zheng, C., and Wang, D. (2023). Forecasting the
crude oil prices with an emd-isbm-fnn model. En-
ergy, 263:125407. https://doi.org/10.1016/j.energy.
2022.125407.
Flood, R. P. and Hodrick, R. J. (1990). On testing for spec-
ulative bubbles. Journal of Economic Perspectives,
4(2):85–101. https://www.aeaweb.org/articles?id=10.
1257/jep.4.2.85.
Goldberger, A. L., Amaral, L. A. N., Glass, L., Haus-
dorff, J. M., Ivanov, P. C., Mark, R. G., Mietus,
J. E., Moody, G. B., Peng, C.-K., and Stanley, H. E.
(2000). Physiobank, physiotoolkit, and physionet:
components of a new research resource for complex
physiologic signals. Circulation, 101(23):e215–e220.
https://doi.org/10.1161/01.cir.101.23.e215.
Guliyev, H. and Mustafayev, E. (2022). Predicting the
changes in the wti crude oil price dynamics using ma-
chine learning models. Resources Policy, 77:102664.
https://doi.org/10.1016/j.resourpol.2022.102664.
He, Q. and Huang, J. (2020). A method for analyz-
ing correlation between multiscale and multivari-
ate systems—multiscale multidimensional cross re-
currence quantification (mmdcrqa). Chaos, Solitons
& Fractals, 139:110066. https://doi.org/10.1016/j.
chaos.2020.110066.
Ji, Q., Bouri, E., Roubaud, D., and Kristoufek, L. (2019).
Information interdependence among energy, cryp-
tocurrency and major commodity markets. Energy
Economics, 81:1042–1055. https://doi.org/10.1016/j.
eneco.2019.06.005.
Kantz, H. and Schreiber, T. (2003). Nonlinear Time Se-
ries Analysis. Cambridge University Press, 2 edition.
https://doi.org/10.1017/CBO9780511755798.
Kilian, L. (2009). Not all oil price shocks are alike: Dis-
entangling demand and supply shocks in the crude
oil market. American Economic Review, 99(3):1053–
69. https://www.aeaweb.org/articles?id=10.1257/aer.
99.3.1053.
Kirchner, M., Schubert, P., Liebherr, M., and Haas, C. T.
(2014). Detrended fluctuation analysis and adap-
tive fractal analysis of stride time data in parkinson’s
disease: Stitching together short gait trials. PLOS
ONE, 9(1):1–6. https://doi.org/10.1371/journal.pone.
0085787.
Kiv, A. E., Soloviev, V. N., Semerikov, S. O., Danylchuk,
H. B., Kibalnyk, L. O., Matviychuk, A. V., and
Striuk, A. M. (2021). Machine learning for pre-
diction of emergent economy dynamics III. In Kiv,
A. E., Soloviev, V. N., and Semerikov, S. O., edi-
tors, Proceedings of the Selected and Revised Papers
of 9th International Conference on Monitoring, Mod-
eling & Management of Emergent Economy (M3E2-
MLPEED 2021), Odessa, Ukraine, May 26-28, 2021,
volume 3048 of CEUR Workshop Proceedings, pages
i–xxxi. CEUR-WS.org. https://ceur-ws.org/Vol-3048/
paper00.pdf.
Kmytiuk, T. and Majore, G. (2021). Time series forecasting
of agricultural product prices using Elman and Jordan
recurrent neural networks. Neiro-Nechitki Tekhnolohii
Modelyuvannya v Ekonomitsi, 2021(10):67–85. https:
//doi.org/10.33111/nfmte.2021.067.
Kobets, V. and Novak, O. (2021). EU countries clustering
for the state of food security using machine learning
techniques. Neiro-Nechitki Tekhnolohii Modelyuvan-
nya v Ekonomitsi, 2021(10):86–118. https://doi.org/
10.33111/nfmte.2021.086.
Kucherova, H., Honcharenko, Y., Ocheretin, D., and Bil-
ska, O. (2021). Fuzzy logic model of usability of
websites of higher education institutions in the con-
text of digitalization of educational services. Neiro-
Nechitki Tekhnolohii Modelyuvannya v Ekonomitsi,
2021(10):119–135. https://doi.org/10.33111/nfmte.
2021.119.
Li, J., Wu, Q., Tian, Y., and Fan, L. (2021). Monthly henry
hub natural gas spot prices forecasting using varia-
tional mode decomposition and deep belief network.
Energy, 227:120478. https://doi.org/10.1016/j.energy.
2021.120478.
Lukianenko, D. and Strelchenko, I. (2021). Neuromodel-
ing of features of crisis contagion on financial mar-
kets between countries with different levels of eco-
nomic development. Neiro-Nechitki Tekhnolohii Mod-
M3E2 2022 - International Conference on Monitoring, Modeling Management of Emergent Economy
132

elyuvannya v Ekonomitsi, 2021(10):136–163. https:
//doi.org/10.33111/nfmte.2021.136.
Marwan, N., Carmen Romano, M., Thiel, M., and Kurths, J.
(2007). Recurrence plots for the analysis of complex
systems. Physics Reports, 438(5):237–329. https://
doi.org/10.1016/j.physrep.2006.11.001.
Marwan, N. and Webber, C. L. (2015). Mathematical
and computational foundations of recurrence quan-
tifications. In Webber, C. L. and Marwan, N., ed-
itors, Recurrence Quantification Analysis: Theory
and Best Practices, pages 3–43. Springer Interna-
tional Publishing, Cham. https://doi.org/10.1007/
978-3-319-07155-8 1.
Marwan, N., Wessel, N., Meyerfeldt, U., Schirdewan, A.,
and Kurths, J. (2002). Recurrence-plot-based mea-
sures of complexity and their application to heart-
rate-variability data. Phys. Rev. E, 66:026702. https:
//doi.org/10.1103/physreve.66.026702.
Miroshnychenko, I., Kravchenko, T., and Drobyna, Y.
(2021). Forecasting electricity generation from re-
newable sources in developing countries (on the ex-
ample of Ukraine). Neiro-Nechitki Tekhnolohii Mod-
elyuvannya v Ekonomitsi, 2021(10):164–198. https:
//doi.org/10.33111/nfmte.2021.164.
Ott, E., Sauer, T., and Yorke, J. (1994). Coping with Chaos.
Wiley Series in Nonlinear Science. Wiley.
Poincar
´
e, H. (2017). The Three-Body Problem and the
Equations of Dynamics: Poincar
´
e’s Foundational
Work on Dynamical Systems Theory. Astrophysics
and Space Science Library. Springer, Cham, 1 edition.
https://doi.org/10.1007/978-3-319-52899-1.
Romano, M. C., Thiel, M., Kurths, J., and von Bloh,
W. (2004). Multivariate recurrence plots. Physics
Letters A, 330(3):214–223. https://doi.org/10.1016/j.
physleta.2004.07.066.
Sari, R., Soytas, U., and Hacihasanoglu, E. (2011). Do
global risk perceptions influence world oil prices? En-
ergy Economics, 33(3):515–524. https://doi.org/10.
1016/j.eneco.2010.12.006.
Shahzad, U., Jena, S. K., Tiwari, A. K., Do
˘
gan, B., and
Magazzino, C. (2022). Time-frequency analysis be-
tween bloomberg commodity index (bcom) and wti
crude oil prices. Resources Policy, 78:102823. https:
//doi.org/10.1016/j.resourpol.2022.102823.
Soloviev, V. N., Bielinskyi, A. O., and Kharadzjan, N. A.
(2020). Coverage of the coronavirus pandemic
through entropy measures. CEUR Workshop Pro-
ceedings, 2832:24 – 42. https://ceur-ws.org/Vol-2832/
paper02.pdf.
Takens, F. (1981). Detecting strange attractors in turbu-
lence. In Rand, D. and Young, L.-S., editors, Dynam-
ical Systems and Turbulence, Warwick 1980, pages
366–381, Berlin, Heidelberg. Springer Berlin Heidel-
berg. https://doi.org/10.1007/BFb0091924.
U.S. Energy Information Administration (1986). Spot
prices for crude oil and petroleum products. https:
//www.eia.gov/dnav/pet/pet pri spt s1 d.htm.
U.S. Energy Information Administration (1997). Natural
gas spot and futures prices (nymex). https://www.eia.
gov/dnav/ng/NG PRI FUT S1 W.htm.
Webber, C. and Zbilut, J. (2005). Recurrence quantification
analysis of nonlinear dynamical systems. In Riley,
M. A. and Orden, G. C. V., editors, Tutorials in Con-
temporary Nonlinear Methods for the Behavioral Sci-
ences, chapter 2. National Science Foundation (NSF).
Webber, C. L. and Zbilut, J. P. (1994). Dynamical assess-
ment of physiological systems and states using re-
currence plot strategies. Journal of Applied Physi-
ology, 76(2):965–973. https://doi.org/10.1152/jappl.
1994.76.2.965.
Wu, G. and Zhang, Y.-J. (2014). Does china factor mat-
ter? an econometric analysis of international crude oil
prices. Energy Policy, 72:78–86. https://doi.org/10.
1016/j.enpol.2014.04.026.
Yin, T. and Wang, Y. (2022). Predicting the price of wti
crude oil futures using artificial intelligence model
with chaos. Fuel, 316:122523. https://doi.org/10.
1016/j.fuel.2021.122523.
Zbilut, J. P. and Webber, C. L. (1992). Embeddings and
delays as derived from quantification of recurrence
plots. Physics Letters A, 171(3):199–203. https:
//doi.org/10.1016/0375-9601(92)90426-M.
Zhang, Y., He, M., Wen, D., and Wang, Y. (2023). Fore-
casting crude oil price returns: Can nonlinearity help?
Energy, 262:125589. https://doi.org/10.1016/j.energy.
2022.125589.
Zhang, Y.-J. and Wang, J. (2015). Exploring the wti crude
oil price bubble process using the markov regime
switching model. Physica A: Statistical Mechanics
and its Applications, 421:377–387. https://doi.org/10.
1016/j.physa.2014.11.051.
Zhang, Y.-J. and Wu, Y.-B. (2019). The time-varying
spillover effect between wti crude oil futures returns
and hedge funds. International Review of Economics
& Finance, 61:156–169. https://doi.org/10.1016/j.
iref.2019.02.006.
Zou, Y., Yu, L., and He, K. (2023). Forecasting crude oil
risk: A multiscale bidirectional generative adversarial
network based approach. Expert Systems with Appli-
cations, 212:118743. https://doi.org/10.1016/j.eswa.
2022.118743.
Recurrence Measures of Complexity in Energy Market Dynamics
133
