
Statistical Analysis of Wastewater Discharge in Yunnan Province
2015-2020
Na Dou
1a
, Zhong Sun
2
, Yao Zhao
1
, Shuwei Zhang
1
and Guozhong He
1,*
1
School of Public Health, Kunming Medical University, China
2
School of Medicine and Health, Universiti Putra Malaysia, Malaysia
Keywords: Yunnan Province, Wastewater Discharge, Domestic Sewage, Industrial Wastewater, Factor Analysis, Cluster
Analysis.
Abstract: Yunnan Province is endowed with abundant water systems and resources. In recent years, with urbanization,
human population, social and economic progress fastening, water environment problem is becoming
increasingly serious. Therefore, this study proposes the coordinated development of social economy and water
environment in Yunnan Province. According to the situation of wastewater discharge in Yunnan Province,
the main sources of wastewater discharge and the main factors affecting urban wastewater discharge in recent
years are analyzed. Statistical analysis results show that wastewater discharge in Yunnan Province in the past
five years mainly came from domestic wastewater (8,891,023,700 tons), followed by industrial sewage
(1,984,587,500 tons). Through cluster analysis, 16 cities in Yunnan Province were finally divided into four
categories, with Kunming as category 1, Qujing as category 2, Lijiang, Nujiang, Diqing, Baoshan, Chuxiong,
Lincang, and Xishuangbanna as category 3, and other cities category 4. In recent years, wastewater discharge
in Kunming and Qujing City has been on the rise, probably due to large population density and high demand
for domestic water, the concentration of high water-consuming industries such as mining and metallurgy, and
defects in wastewater and sewage treatment technology.
1 INTRODUCTION
There are many rivers and lakes in Yunnan Province.
The water resources developed are about 153.381
billion cubic meters, accounting for 5.46% of the
national water resources in China. However, affected
by geographical and natural environment, water
resources distribution is uneven
[1]
, Worse still, as
urbanization increases, urban population grows,
pollution intensifies, water quality deteriorates, river
runoff decreases, lakes shrink, which worsens the
water environment
[2]
. Since 1992, Yunnan Province
has been committed to water environment protection,
and the overall water quality has improved year by
year. However, as Yunnan Province is located in
inland China, the waste water discharge mainly
depends on inland lakes
[3]
, and the self-purification
capacity of water is very limited, there is a relatively
serious water pollution problem. Therefore, with a
view to achieving the coordinated development of
social economy and water environment in Yunnan
a
https://orcid.org/0000-0002-1887-5417
Province, this study plans to adopt multiple statistical
factor analysis and cluster analysis methods to study
how to reasonably recycle water resources, analyze
the main factors affecting wastewater discharge in
cities, find solutions to effectively improve
wastewater treatment, and propose effective
suggestions for water environment protection and
wastewater discharge treatment in Yunnan Province.
2 DATA SOURCES AND
SELECTION OF POLLUTION
INDICATORS FOR
WASTEWATER DISCHARGE
2.1 Data Sources
The wastewater discharge data in this study comes
from the “Yunnan Statistical Yearbook” and the
Dou, N., Sun, Z., Zhao, Y., Zhang, S. and He, G.
Statistical Analysis of Wastewater Discharge in Yunnan Province 2015-2020.
DOI: 10.5220/0011930000003536
In Proceedings of the 3rd International Symposium on Water, Ecology and Environment (ISWEE 2022), pages 123-128
ISBN: 978-989-758-639-2; ISSN: 2975-9439
Copyright
c
2023 by SCITEPRESS – Science and Technology Publications, Lda. Under CC license (CC BY-NC-ND 4.0)
123
water quality evaluation index data from “Yunnan
Province Environmental Status Bulletin” and “
Yunnan Province Plateau Lake Water Quality
Monthly Report”.
2.2 Selection of Pollution Indicators for
Wastewater Discharge
According to the Comprehensive Sewage Discharge
Standard implemented by China in 1998, a total of 6
wastewater discharge pollution targets were selected:
X1 total wastewater discharge, X2 domestic sewage
discharge, X3 COD discharge from domestic sewage,
X4 industrial wastewater discharge, X5 chemical
oxygen demand (COD) emissions, and X6 urban
sewage discharge.
3 RESEARCH METHODOLOGY
According to the selected 6 wastewater discharge
pollution indexes, the wastewater discharge in
Yunnan Province is analyzed by SPSS26.0.
3.1 Factor Analysis
Factor analysis was used to reduce the dimension of
multiple sewage discharge standards. In other words,
through the study of the correlation between a set of
indicators, a linear model is synthesized into a few
comprehensive common factors, and the original
variables are represented by these comprehensive
factors. So, the variables and factors representing
most of the index information are easy to study
[4]
.
3.2 Cluster Analysis
Cluster analysis is to classify uncategorized
observation units or variables with similar
characteristics according to the principle of “object
by object clustering”. Normally, the Ward’s method
[5]
can classify the observation units or variables based
on the factor analysis.
4 RESULTS
4.1 Factor Analysis Results
According to the model and principle of factor
analysis, factor analysis of main pollution indexes of
wastewater discharge in 16 cities of Yunnan Province
was performed by SPSS26.0. Factor analysis
hypothesis test was carried out on the collected
variable data. First, the KMO test value of variable
data is 0.746>0.5. Bartlett ’ s Approximate Chi-
Square is 2201.565, If the df (degree of freedom) is
15, the significant difference is 0. Therefore, when
α=0.05, the original hypothesis is rejected. It can be
considered that the correlation coefficient matrix is
significantly related to the unit matrix. There is a
positive linear correlation between variables. Factor
analysis of variable data can be carried out (see table
1, table 2 for detail).
Table 1: KMO and Bartlett’s Test.
Kaiser-Meyer-Olkin Measure of
Sam
p
lin
g
Ade
q
uac
y
0.746
Bartlett’s Test of
Sphericity
Approximate Chi-
Square
2201.565
df 15
Si
g
. 0.000
Table 2: Correlation matrix.
Total
wastewater
discharge (X1)
Domestic sewage
discharge (X2)
COD discharge
from domestic
sewage (X3)
Industrial
wastewater
discharge (X4)
COD (X5)
Urban sewage
discharge
(X6)
Correlation
Total wastewater discharge (X1) 1.000 0.993 0.914 0.847 0.882 0.993
Domestic sewage discharge (X2)
0.993 1.000 0.886 0.779 0.833 0.990
COD discharge from domestic
sewage (X3)
0.914 0.886 1.000 0.877 0.963 0.891
Industrial wastewater discharge(X4) 0.847 0.779 0.877 1.000 0.940 0.823
COD (X5) 0.882 0.833 0.963 0.940 1.000 0.860
Urban sewage discharge (X6) 0.993 0.990 0.891 0.823 0.860 1.000
ISWEE 2022 - International Symposium on Water, Ecology and Environment
124
The ratio of common factor variance extracted is
shown in table 3. The information extraction of six
evaluation indexes is above 90%, and the effective
information of variable data is retained, which
indicates that the evaluation of wastewater discharge
in Yunnan Province greatly reduces the complexity of
the original data. The two common factors extracted
are the total amount of wastewater discharge and the
discharge of domestic sewage. The contribution rates
of factor variance before rotation is 91.537%, 6.162%,
50.877%, and 46.822%, respectively, and the
cumulative contribution rate is 97.699% (see table 4
for details)
Table 3. Proportion of variance of common factor.
Communalities
Total wastewater discharge (X1) Initial Extraction
Domestic sewage discharge (X2) 1 0.997
COD discharge from domestic sewage (X3) 1 0.999
Industrial wastewater discharge(X4) 1 0.951
COD (X5) 1 0.982
Urban sewage discharge (X6) 1 0.991
Extraction Method: Principal Component Analysis
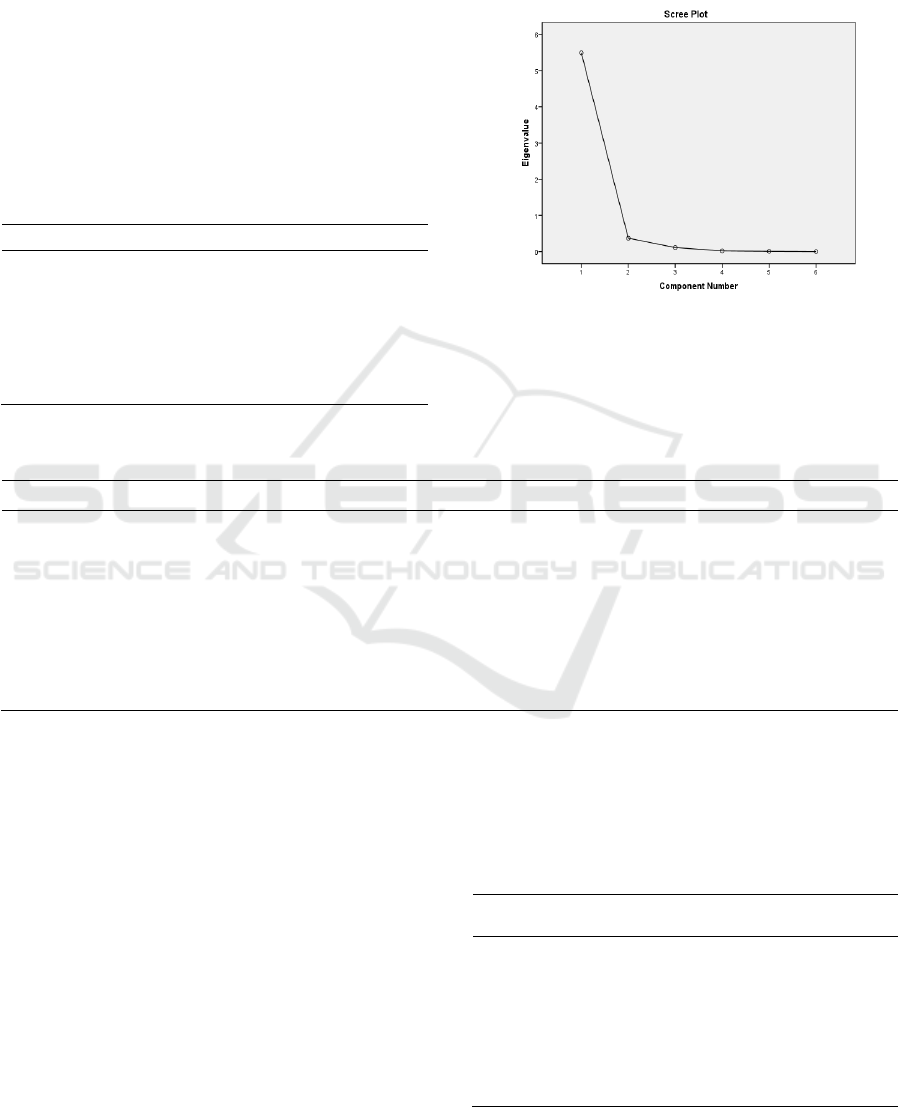
As shown in figure 1, the horizontal coordinate
represents the number of principal components and
the vertical coordinate the eigenvalues, from which
we can see that the contribution rate of different
indicators is greater than 1, and the eigenvalue of the
second index is between 0-1.
Figure 1: Scree plot of wastewater and major pollutants in
Yunnan Province.
Table 4. Total variance explained.
Component Initial Eigenvalues Extraction Sums of Squared Loadings Rotation Sums of Squared Loadings
Total of Variance% Cumulative% Total of Variance% Cumulative% Total of Variance% Cumulative%
1 5.492 91.537 91.537 5.492 91.537 91.537 3.053 50.877 50.877
2 0.370 6.162 97.699 .370 6.162 97.699 2.809 46.822 97.699
3 0.111 1.858 99.557
4 0.019 0.320 99.877
5 0.007 0.123 100.000
6 5.690E-006 9.483E-005 100.000
Extraction Method: Principal Component Analysis.
The factor load matrix is shown in table 5. The
factor load matrix reflects the total amount of
wastewater discharge, the total amount of munici
pal sewage discharge, the COD discharge from
domestic sewage, and the discharge from COD,
and industrial wastewater in Yunnan Province. T
heir respective expressions can be written as foll
ows:
total wastewater discharge=×component1-0.184×c
omponent2;
0.981 Municipal sewage discharge=×component1-
0.228×component2;
0.969 COD discharge=0.963×component1+0.120×
component2;
domestic sewage discharge=×component1-0.291×c
omponent2;
0.956COD=0.954×component1COD=0.269×compo
nent1COD=component2;
wastewater discharge=0.916×component1+0.335×c
omponent2.
Table 5. Factor load matrix.
Com
p
onent
1 2
Total wastewater discharge (X1) 0.981 -0.184
Domestic sewage discharge (X2) 0.969 -0.228
COD discharge from domestic sewage
(
X3
)
0.963 0.120
Industrial wastewater discharge(X4) 0.956 -0.291
COD (X5)
0.954 0.269
Urban sewage discharge (X6)
0.916 0.335
Statistical Analysis of Wastewater Discharge in Yunnan Province 2015-2020
125
The factor load matrix after maximum variance
rotation is shown in table 6. The information of
each variable is extracted more fully after the m
aximum variance rotation. The total amount of
wastewater discharge and domestic sewage disch
arge are extracted as common factors. Compone
nt1 mainly explains the domestic sewage dischar
ge, urban sewage discharge, and wastewater disc
harge, while component2 mainly explains the ind
ustrial wastewater discharge, COD, and domestic
sewage discharge.
Table 6. Rotated component Matrix 6a.
Component
1 2
Total wastewater discharge
(X1)
0.893 0.449
Domestic sewage discharge
(X2)
0.858 0.504
COD discharge from
domestic sewa
g
e
(
X3
)
0.837 0.544
Industrial wastewater
discharge(X4)
0.432 0.874
COD (X5)
0.504 0.853
Urban sewage discharge
(
X6
)
0.614 0.752
Extraction Method: Principal Component Analysis.
Rotation Method: Varimax with Kaiser Normalization.
Rotation converged in 3 iterations.
The principal component conversion matrix is shown
in table 7. The principal component conversion
matrix reflects the relationship between the principal
components before and after rotation, so the principal
components before and after rotation can be
converted by transforming the matrix.
Table 7: Component transformation matrix.
Component 1 2
1 0.724
0.690
2 -0.690
0.724
Extraction Method: Principal Component Analysis.
Rotation Method: Varimax with Kaiser Normalization.
The standardized factor score coefficient matrix is
shown in table 8. The linear combination of principal
components about each variable can be given by
standardized factor score coefficient matrix, and
further clustering analysis is carried out. F
=
0.179X
+ 0.174X
+ 0.167X
+ 0.175X
+
0.174X
+ 0.176X
Table 8. Component score coefficient matrix.
Component
1
Total wastewater discharge
(
X1
)
0.179
Domestic sewage discharge (
X2)
0.174
COD discharge from domestic
sewa
g
e
(
X3
)
0.167
Industrial wastewater
dischar
g
e
(
X4
)
0.175
COD (X5)
0.174
Urban sewage discharge (X6)
0.176
Extraction Method: Principal Component Analysis.
Rotation Method: Varimax with Kaiser Normalization
4.2 Cluster Analysis Results
The total amount of wastewater discharge, domestic
sewage discharge, domestic sewage COD discharge,
urban sewage discharge, industrial wastewater
discharge and chemical oxygen demand (COD)
discharge were numbered in the systematic cluster
analysis according to six wastewater pollution
discharge indexes in Yunnan Province. After 15
steps, it was finally merged into a class (see table 9
for details).
Table 9. Agglomeration schedule.
Sta
g
e
Cluster
Combine
d
Coefficients
Stage Cluster
First A
pp
ears
Next
Sta
g
e
Cluste
r
1
Cluster
2 Cluster 1 Cluster 2
1 5 7 0.043 0 0 10
2 6 15 0.108 0 0 6
3 4 9 0.193 0 0 5
4 3 14 0.326 0 0 10
5 4 8 0.458 3 0 8
6 6 16 0.639 2 0 11
7 11 13 0.972 0 0 9
8 4 12 1.446 5 0 11
9 10 11 2.347 0 7 12
10 3 5 3.870 4 1 12
11 4 6 7.294 8 6 13
12 3 10 13.120 10 9 13
13 3 4 24.600 12 11 14
14 2 3 41.866 0 13 15
15 1 2 90.000 0 14 0
According to figure 2, 16 cities in Yunnan Province
can be divided into the following four categories
according to six wastewater discharge pollution
indicators: ① Kunming; ② Qujing; ③ Lijiang,
Nujiang, Diqing, Baoshan, Chuxiong, Lincang,
ISWEE 2022 - International Symposium on Water, Ecology and Environment
126
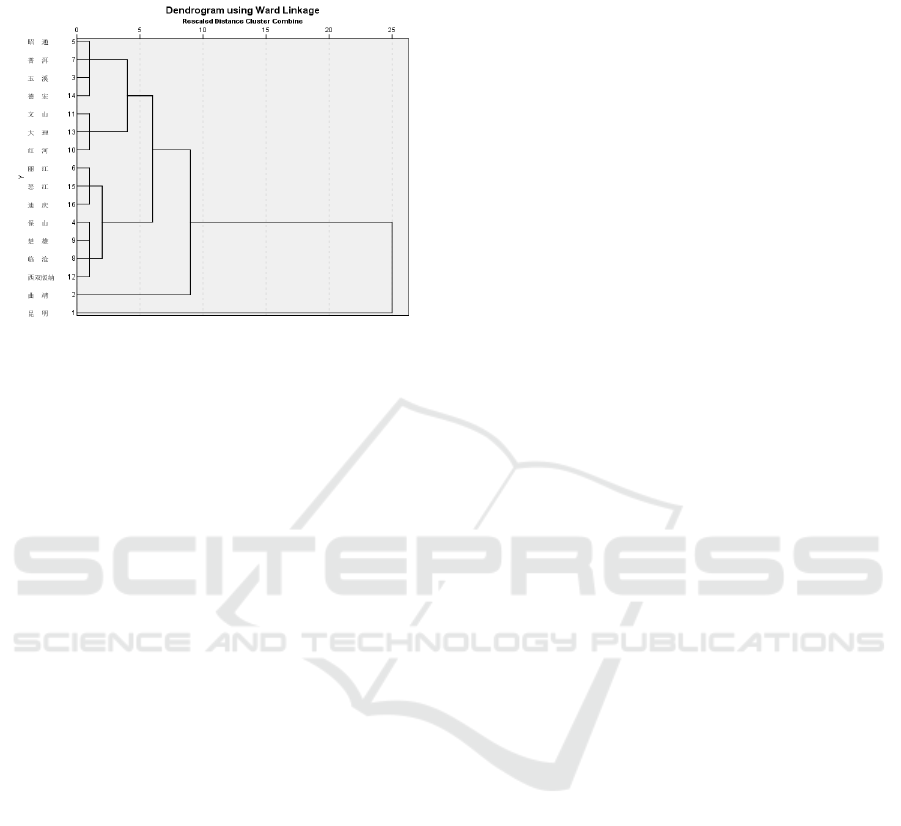
Xishuangbanna; ④ Zhaotong, Pu ’ er, Yuxi,
Dehong, Wenshan, Dali, Honghe.
Figure 2. Cluster analysis tree map of wastewater and major
pollutants in Yunnan Province.
5 CONCLUSION
The factor analysis results show that the total amount
of wastewater discharge has been increasing year by
year, among which the proportion of public domestic
sewage continues to increase, becoming the main
source of water resources pollution in Yunnan
Province. The reason may be that since the reform
and opening-up, Yunnan, bordering south and
southeast Asia, has been committed to economic and
social development. Its total population increased
from 46,016,300 in 2010 to 48,583,000 in 2020; its
urban population rose from 11,111,300 to
14,310,730; its population density from 116.6 to
123.3 persons per square kilometer. Among the six
wastewater discharge pollution indicators, the total
wastewater discharge and domestic wastewater
emissions have the greatest impact on water
environmental pollution, followed by industrial
sewage and other pollutants. The reason may be due
to the weak development of state-run enterprises in
Yunnan Province and rapid growth of highly polluted
industries discharging more industrial sewage and
requiring large water consumption.
Based on the cluster analysis method, the total
amount of wastewater discharge and domestic
sewage discharge obtained from factor analysis were
classified into 16 cities in Yunnan Province. The first
category is Kunming, which has a large population
density and produces more domestic wastewater and
industrial sewage than other cities. The second
category is Qujing City
[6]
. There are many industrial
and mining enterprises and industrial parks, most of
which are heavily polluted and high-water-
consuming industries such as thermal power
generation, coal, machinery, chemical industry,
metallurgy, and so on. The third category is Lijiang,
Nujiang, Diqing, Baoshan, Chuxiong, Lincang,
Xishuangbanna, and the fourth category is Zhaotong,
Pu’er, Yuxi, Dehong, Wenshan, Dali, Honghe. The
population density in these areas is relatively
balanced, and the domestic sewage and industrial
wastewater produced are less than that in Kunming
and Qujing. The main source of wastewater discharge
is domestic sewage, which has a trend of yearly
increase, followed by industrial wastewater. The
discharge of industrial wastewater in 2018 appeared
in a significant decline mode, and then began to grow
slowly.
With the continuous urban expansion in Yunnan
Province, urban population, discharge of domestic
wastewater and industrial sewage produced by cities,
as well as total wastewater and main pollutants
increase. It mainly results from the lack of effective
planning and reasonable control of urban domestic
sewage, the low wastewater treatment rate of
factories, and excessive discharge or discharge. It
then leads to the continuous deterioration of water
environment and continuous pollution of water
resources
[7].
At present, China’s own core technology and
complete set equipment for efficient wastewater
treatment are still mainly dependent on imports. What
’s more, the research and development of research
institutes, and wastewater treatment technology
evaluation system is not perfect, leading to a lack of
universality in evaluation technology and standards.
6 RECOMMENDATIONS
First, the rapid development of social economy, the
improvement of public living standards and the
acceleration of the industrialization process will all
increase the urban wastewater discharge and pose
some threats to water resources protection. Secondly,
the water environmental pollution control in Yunnan
Province mainly relies on the self-purification
capacity of water bodies. However, limited by
geographical factors, the self-purification capacity of
some river basins began to diminish. Worse still, the
lack of surrounding environmental infrastructure
construction and the imperfect urban drainage pipe
network, the rivers entering the lake have become the
main sewage channel for wastewater discharge.
Therefore, focusing on the source to control
Statistical Analysis of Wastewater Discharge in Yunnan Province 2015-2020
127

wastewater and pollution discharge, and striking a
balance between urban economic development and
environmental protection is one of the key approaches
for water resources and environmental protection.
According to the latest statistics, as of 2019, 194
enterprises in Yunnan Province have obtained sewage
treatment qualifications. Among them, the number of
wastewater treatment facilities in industrial
enterprises increased by 1.39 times; the number of
urban sewage treatment plants increased by 4.67
times. The treatment method of wastewater and
pollutants has changed from the most basic physical
method to the use of microorganisms to remove
dissolved organic matter and colloidal substances in
sewage and improve the discharge of public domestic
wastewater and enterprises to the standard rate.
However, due to the high treatment cost, difficulty in
ensuring the effect, and unstable operation, the
treatment of high-concentration pollutants and
organic wastewater is still relatively difficult.
Therefore, it is suggested that Yunnan Province
should adopt professional and strong treatment level
technical methods for enterprises with large industrial
sewage discharge and introduce high-end and fine
automatic wastewater treatment integration and
control technology, to ensure it matches the process
and equipment operation. Special technical
evaluation indicators should be formulated for some
regions and enterprises with difficult processing. The
close combination between the overall environmental
protection strategy and environmental science and
technology development strategy should be done to
meet the requirements of environmental supervision
and achieve scientific and technological progress and
the development of environmental protection
industry.
Government departments should improve the
supervision capacity of water environment
protection, beef up environmental monitoring team
and standardization construction, improve
fundamental conditions for environmental
monitoring, upgrade environmental supervision
agency equipment, increase energy conservation and
emission reduction, promote water protection
publicity, improve public environmental awareness,
encourage the public to maximize the recycling of
domestic water
[8]
, reduce domestic sewage
discharge, and formulate corresponding sewage
discharge indicators and regulations to ensure that
plant production and public sewage discharge do not
exceed environmental capacity.
In promoting the development of prefectures and
cities in Yunnan Province, we must pay attention to
the protection of the ecological environment. We
should increase the government ’ s capital
investment in the field of water conservancy
construction and water environment protection,
mobilize enterprises to strengthen their pollution
prevention and control efforts, strengthen the
construction of safe water network and water
pollution prevention and control in key river basins,
prefectures and cities, optimize the water pollution
prevention and control system by using the system
engineering, and recycle urban waste water resources
as much as possible, We also call for strengthening
the formulation and implementation of relevant laws
and regulations for key polluting enterprises, and
advocating scientific governance by introducing
artificial intelligence and big data into the
environmental monitoring platform – a water
environment protection and management platform
integrating the province ’ s water environment
quality testing and water environmental pollution
early warning.
REFERENCES
Ren Zhizhong 2011 A Study on the Main Problems and
Countermeasures of Environmental Protection in
Yunnan Province Science Progress in Geography
30(05) 563-568.
Zhao Shuangrui 2016 Factor Analysis of Pollutant
Emissions from Major Municipal Wastewater
Agricultural Science & Technology 17(04) 964-967.
Li Wanlin 2019 Development and Utilization of Water
Resources and Environmental Protection in Yunnan
Environment and Development 31(08) 196-197.
Meng Xianglan and Xing Zhaoyuan 2019 High Quality
Development in Hubei under the Background of
Supply-side Reform: An Empirical Research Based on
Weighted Factor Analysis Mathematical Statistics and
Management 38(04) 675-687
Strauss T, von Maltitz MJ. Generalising Ward's Method for
Use with Manhattan Distances. PLOS One. 2017 Jan
13; 12(1) e0168288
Hu Xin 2017 A Study on Present Situation of Water
Pollution in Qujing City and Control Countermeasures
Water Resources Development and Management
2017(04) 20-22
Huang Ying 2002 Analysis of Water Environment and
Problems in Yunnan Province People's Yangtze River,
2002 (07) 23-24+56.
Yang Yuhua, Yang Hongfu, Duan Yannan, Zhang Wenli,
Wen Rui 2019 Current Situation of Water Ecology in
Yunnan Province and its Protection Countermeasures
Environmental Science Guide 38(S1) 22-26
ISWEE 2022 - International Symposium on Water, Ecology and Environment
128
