
Feeder Automation Simulation Method and System Based on
LabVIEW
Jinliang Wang
1
, Xinting Luo
2
, Baolin Kang
1
and Tianhao Wang
3
1
State Grid of China Technology College, Shandong College of Electric Power, Jinan, China
2
Taishun branch of Wenzhou Tusheng power supply service Co., Ltd, Wenzhou, China
3
School of Automation and Electrical Engineering, Linyi University, Linyi, China
Keywords: Feeder Automation, System Simulation, Training and Teaching, Software.
Abstract: Based on LabVIEW software, a feeder automation simulation method and system are developed in this
paper, which truly simulates the feeder automation process and realizes the interaction with users, and is
used for the teaching and promotion of distribution automation. In this system, three programs
corresponding to the three modes of feeder automation "voltage time type", "current concentration type" and
"intelligent distribution" are made to simulate and reproduce. It shows the process of fault location, fault
isolation and power supply recovery under the condition of circuit accident.
1 INTRODUCTION
With the development of distribution automation,
the quality and efficiency of system operation are
improved, and unnecessary waste of human
resources is effectively avoided, thus saving the
economic cost of power enterprises to a certain
extent. Using automatic control technology to
manage power supply and distribution system is an
inevitable trend of social development. Therefore,
the power supply and distribution system continue to
develop and improve with the progress of various
power technologies (Gao., 2017). The power supply
and distribution system need to continuously
improve the automation service level. Feeder
automation is the foundation and most important to
realize it (Zhou et al., 2019). It is the key to
understand its role and function and in novate the
feeder automation function (Ju., 2021). The teaching
knowledge of distribution automation is the
cornerstone of development.
At present, the school's power distribution
automation courses mainly focus on theoretical
teaching and PPT viewing. In the teaching of feeder
automation in distribution automation, the principle
is explained and the form of describing the fault
handling process when three types of feeder
automation lines have permanent faults is adopted,
so that users can understand the difference and fault
handling process of the three types of feeder
automation. This traditional method is difficult to
understand, boring and uninteresting.
2 OVERALL SYSTEM DESIGN
In order to solve the technical problems in the above
background technology, this paper provides a feeder
automation simulation method and system, which
not only truly simulates the feeder automation
process, but also realizes the interaction with users,
which is helpful to the teaching and promotion of
distribution automation (Xu., 2017). A feeder
automation simulation system is established by
using the graphical development environment
LabVIEW and a simulation method is provided
(Wang,. 2006). Some basic principles and teaching
methods of feeder automation are studied (Chen,.
2018).
Figure1 is a schematic diagram of a feeder
automation simulation system. The whole system
covers the following aspects:
Three circuit models of feeder automation;
Time limit judgment;
Fault setting judgment;
Switch state control;
Process output;
Data dump;
342
Wang, J., Luo, X., Kang, B. and Wang, T.
Feeder Automation Simulation Method and System Based on LabVIEW.
DOI: 10.5220/0011924700003612
In Proceedings of the 3rd International Symposium on Automation, Information and Computing (ISAIC 2022), pages 342-347
ISBN: 978-989-758-622-4; ISSN: 2975-9463
Copyright
c
2023 by SCITEPRESS – Science and Technology Publications, Lda. Under CC license (CC BY-NC-ND 4.0)
Sound output.
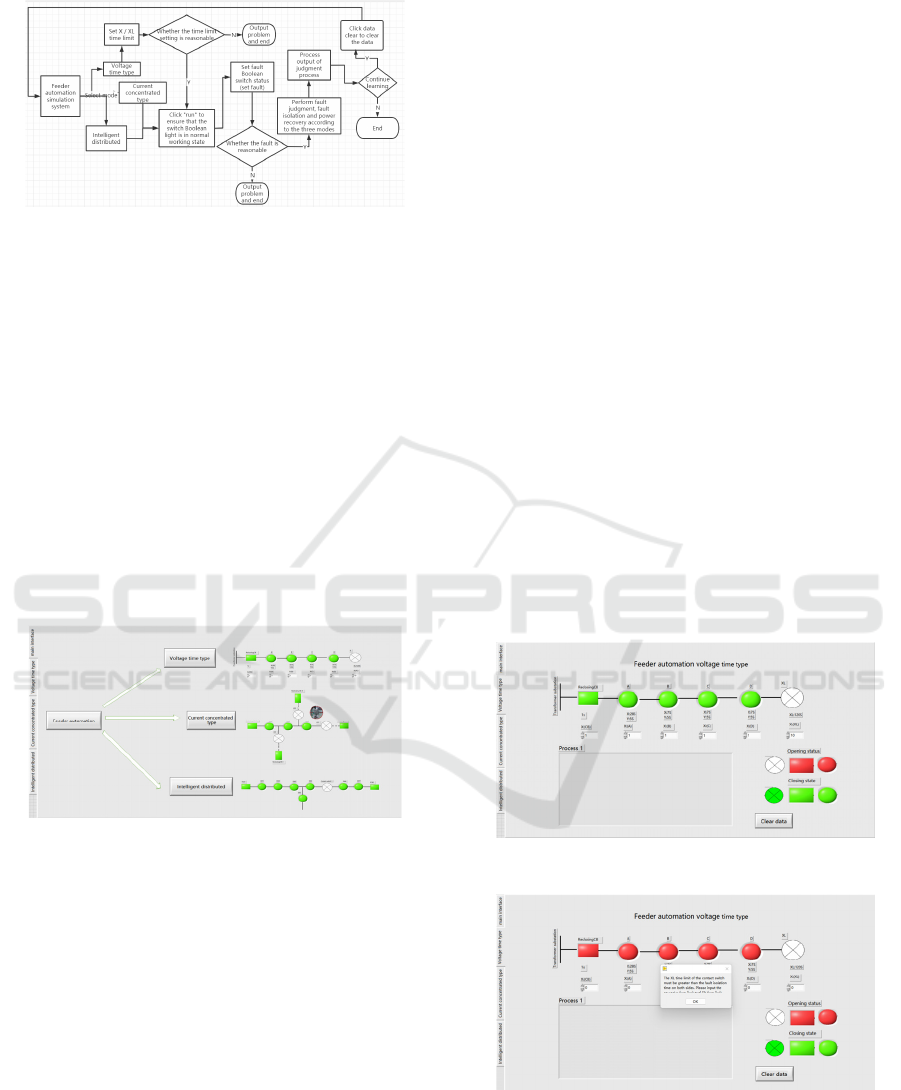
Figure 1: Schematic diagram of a feeder automation
simulation system.
3 DESIGN OF FEEDER
AUTOMATION SYSTEM
3.1 User Interface Overview
The simulation platform interface is divided into
four types: main interface, voltage time type, current
concentration type and intelligent distribution. The
main interface is the introduction interface of the
system as shown in the figure, which clearly
explains the three categories of feeder automation.
The remaining three interfaces are all operation
interfaces.
Figure 2: Simulation platform interface.
3.2 System Design
3.2.1 Three Circuit Models of Feeder
Automation
Through the three types of current concentration
type, voltage time type and intelligent distributed
feeder automation, the model is made to show that
the current type terminal needs reliable
communication and accurate analysis and
calculation to complete fault location, the voltage
type switch needs reclosing of the outgoing line
switch to coordinate fault location, and the voltage
time type needs to pass "N" for fault location.
3.2.2 Time Limit Judgment
As shown in Figure 3, input the closing time limit
set by the reclosing CB and load switches A, B, C
and D into the composite operation control of the
programmed value, perform the operation of adding
the values to obtain the sum of the added values, and
input the less than control compared in the
programming together with the closing time limit set
by XL representing the interconnection switch to
perform the value comparison operation, Judge
whether the voltage time type simulation parameters
input by the user meet the requirements. If so,
execute the switch state control; otherwise, return
the prompt information.
Since the time limit judgment is a unique
condition of the voltage time type, the above
purpose is to judge by adding values, so as to meet
the judgment condition that the time limit of the
interconnection switch XL is greater than the fault
isolation time on both sides. The system can only
operate when the time limit of the contact switch XL
is greater than the sum of the time limits of each X,
otherwise a prompt message will pop up. For
example, the dialog box "the time limit of the
contact switch XL must be greater than the fault
isolation time on both sides, please input the correct
x time limit and XL time limit" will pop up, as
shown in Figure 4 / 5.
Figure 3: Voltage time type feeder automation interface.
Figure 4: Unreasonable time limit setting.
Feeder Automation Simulation Method and System Based on LabVIEW
343
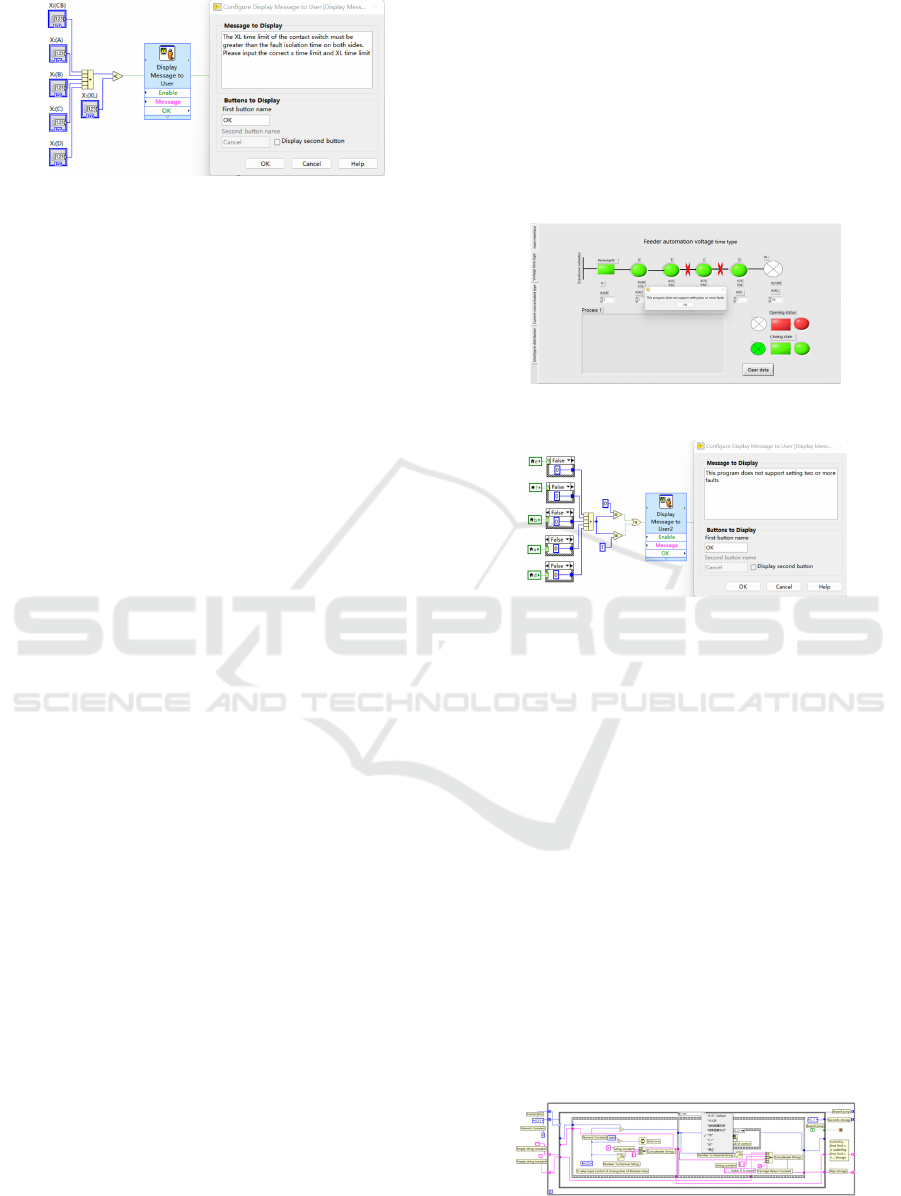
Figure 5: Judgment method and output result of time limit
setting.
3.2.3 Fault Setting Judgment
Since the fault setting judgment of the three feeder
automation systems is the same, the voltage time
type is taken as an example (Chen,. 2017). As shown
in Figure 6, there are five switch Boolean lamps, the
first switch Boolean lamp, the second switch
Boolean lamp, the third switch Boolean lamp, the
fourth switch Boolean lamp and the fifth switch
Boolean lamp, and fault Boolean lamps are arranged
between them, which are represented by "line" or
"line fork", wherein "line fork" indicates that the
fault Boolean lamp is on, and "line" indicates that
the fault Boolean lamp is not on, as shown in Figure
6, There are five fault Boolean lights in total, and
two fault Boolean lights are on. The user can set the
fault by clicking the fault Boolean lamp to control
the lighting of the fault Boolean lamp.
As shown in the left figure of Figure 7, input the
on and off states of the five fault Boolean lamps into
the condition structure to judge whether they are on
or off. The operation is in the form of assignment of
on to 1 and off to 0. After the on and off results of
each fault Boolean lamp are obtained as 1 or 0, input
them into the compound operation control of the
value in the program to add and sum up. The sum is
determined as 0 or 1 in combination with the control
compared in the program to obtain the result, Judge
whether the voltage time type fault information set
by the user meets the requirements (Chen,. 2014). If
so, execute the switch state control step; otherwise,
return the prompt information.
As shown in the left figure of Figure 7, the
leftmost part is the local variable of the fault
Boolean lamp. This fault Boolean lamp is used for
fault setting. When the fault Boolean lamp is on, it is
in fault state. When it is not on, it is displayed in the
form of "line" and is in normal operation state. The
fault setting judgment is to prevent two or more fault
settings. The fault setting judgment consists of
conditional structure, compound operation and or
Boolean. If two or more faults are set, the composite
operation sum is not equal to 1 or 0, and a prompt
message will pop up. For example, the dialog box
"this program does not support setting two or more
faults" will pop up, as shown in the right figure of
Figure 7.
Fault setting: the system sets the fault condition
through the on and off state of the fault Boolean
lamp. In the program block diagram, while cycle,
condition structure and sequence structure are used
to show the fault location and fault interval isolation
of feeder automation in case of fault.
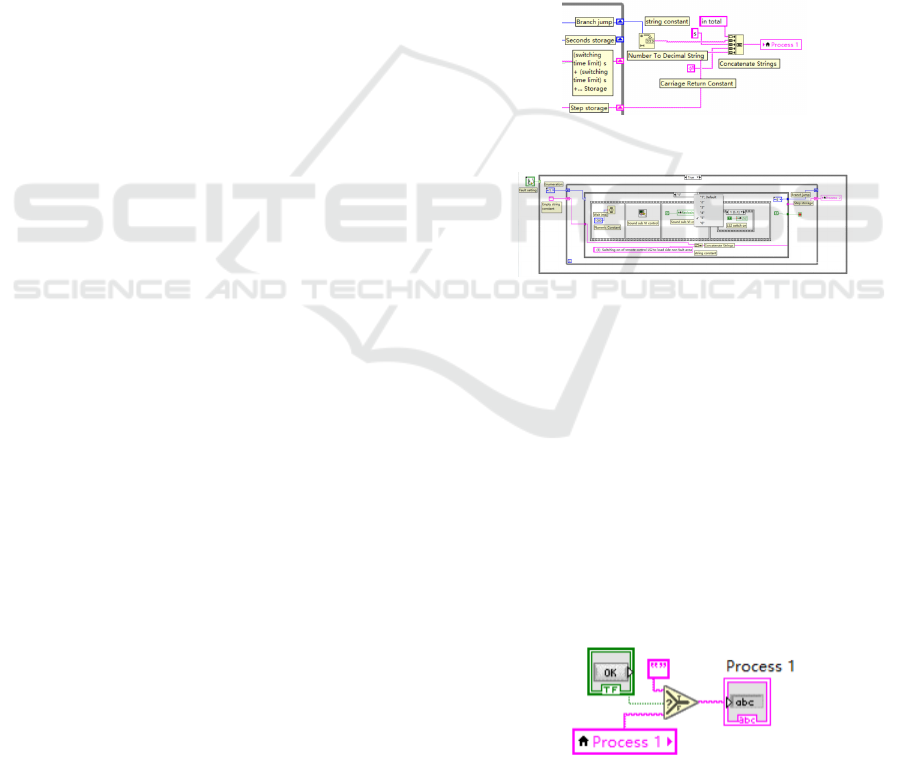
Figure 6: Unreasonable fault setting.
Figure 7: Judgment method and output result of fault
setting.
3.2.4 Switch State Control
As shown in Figure 8, based on the time limit of the
first switch Boolean lamp, the second switch
Boolean lamp, the third switch Boolean lamp, the
fourth switch Boolean lamp, the fifth switch
Boolean lamp and the sixth switch Boolean lamp
and the set voltage time type fault information,
combined with the voltage time type switching
control method of power distribution automation,
The working process of each switch in case of
permanent fault in distribution automation voltage
time type is shown.
The switch is controlled in the selector, and the
Boolean light of the switch is controlled to be on and
off through constant assignment of True / False,
which represents the opening and closing state of the
switch in the feeder automation system.
Figure 8: Schematic diagram of switch control state
program block diagram.
ISAIC 2022 - International Symposium on Automation, Information and Computing
344
3.2.5 Process Output
As shown in Figure 9, based on each branch of the
conditional structure, the state of each switch
Boolean lamp (step storage), branch jump, closing
time of each switch Boolean lamp (1s + 1s +...
Storage) and the sum of closing time limit (X time
limit) of each switch Boolean lamp (seconds
storage) are stored through the while cycle, and
combined with the numerical constant, string
constant Numeric conversion string control, enter
key constant control and connection string control,
connect the string into a paragraph, get the feeder
automation simulation process, and then output it to
the process string display control.
Where in the branch is a branch of a conditional
structure. Take the 123456 branch shown in Figure
10 as an example, because the conditional structure
branch in the LabVIEW system is true or false by
default. In order to achieve the goal of branch jump,
the implementation method is as follows: first, start
enumerating. There are added items in the
enumeration. A total of 6 items are added, and each
item is named with 1, 2, 3, 4, 5 and 6; Connect the
completed enumeration to the branch selector of the
conditional structure, the default branch of the
conditional structure will become 1, and then add
branches until there are six branches of the
conditional structure, and ensure that the names of
the six branches are 123456 in turn; Wrap a while
loop on the condition structure, delete the
connection between the condition structure and the
branch selector, add a shift register (left and right
two are a pair), connect the enumeration to the shift
register (left), and then connect the shift register to
the branch selector of the condition structure. At this
time, ensure that the enumeration item is 1, so as to
ensure that the program starts in the branch structure
with 1 first; To achieve the effect of branch jump,
copy the same enumeration again, and connect the
item of the enumeration with 2 to the shift register
(right); In the branch structure named 2, the item of
the enumeration connected to the shift register
(right) is 3, and so on, so as to achieve the result of
each branch jump.
The process output converts the string and value
stored in the while loop into a string and connects
them through a connection string. While loop is a
storage function with four functions: the first is to
control each branch of the condition structure
through while loop; The second is to record the total
time of the process from the beginning of the fault to
the end of the fault after the line fault; The third
stores the response time of each switch; The fourth
is to store the whole process, for example, the
process shown in the voltage time type:
13s in total;
In case of accident, CB trips, line loses voltage,
and contact switch starts timing;
1s (1s): switch CB is closed;
2s (1s + 1s): switch A is closed;
3s (1s + 1s + 1s): switch B is closed;
When the power is supplied to the fault section,
the substation will trip again, the line will lose
voltage, and the switch B and switch C will be
locked;
4s (1s + 1s + 1s + 1s): switch CB is closed;
5s (1s + 1s + 1s + 1s + 1s): switch A is closed;
6s (1s + 1s + 1s + 1s + 1s + 1s): Contact switch
XL is closed;
7s (1s + 1s + 1s + 1s + 1s + 1s + 1s): switch D is
closed.
Figure 9: Schematic diagram of process string output.
Figure 10: Schematic diagram of branch jump description.
3.2.6 Data Dump
As shown in Figure 11, if you click the OK button
Boolean control based on the selection control in the
comparison, the empty string constant will be output
in the process display control to obtain the result of
the blank process display control. On the contrary, if
you do not click, the result of the original process
display control will be obtained.
Data clearing consists of process display control
and OK button. If you click OK, the data will be
cleared; if not, the data in the process will be
retained.
Figure 11: Schematic diagram of data clearing program
block diagram.
Feeder Automation Simulation Method and System Based on LabVIEW
345

3.2.7 Sound Output
As shown in Figure 12, open the program block
diagram of the sound sub VI, copy and paste the
path where the sound wav file is located, and get the
result of pasting the path into the path constant of
the file constant. Based on the status of each switch
Boolean in the switch state control, combine the
while loop, play the sound file, sound output
information, unbind by name, non-comparison
control, compound arithmetic control and sound
make to sound output.
Sound output is a sub virtual instrument (VI),
which consists of two parts, one is the path, and the
other is the program for writing and output; the
sound path is variable. The left figure in Figure 12 is
a schematic diagram of the sound path of a
computer. After changing the computer login
program, first open the sound sub VI, write the path
of the sound in the path string, and then open the
main program to start the operation. The output
sound is the sound of the disconnector closing.
When the switch is closed or separated, the sound
will be emitted first, which can better simulate the
opening and closing of the circuit. This output is
reflected in VI. put the sound in the file. Because the
path of the sound is different in each computer, the
VI should be heard first when running the program.
Enter the path text into the path, and then run the
program.
Figure 12: Flow diagram of sound sub VI.
3.3 Storage Devices and Media
The feeder automation simulation system is
developed based on LabVIEW software and requires
a computer-readable storage medium, in which a
computer program is stored. When the program is
executed by the processor, the steps in a simulation
method for the three types of feeder automation
described above are realized. There is also a need for
a computer device, including a memory, a processor,
and a computer program stored on the memory and
executable on the processor. When the processor
executes the program, it realizes the steps in a feeder
automation simulation method as described above.
4 DESCRIPTION
The system is divided into three steps:
Step 1: in response to the user's main interface
selection instruction, after entering the main
interface, in response to the user's mode click
instruction, obtain and display the stored operation
state diagram of the corresponding mode. Figure 2
shows the main interface corresponding to the main
module of the feeder automation simulation training
system of the present invention. The right side of the
main interface is composed of three determination
buttons, namely "voltage time type", "current
concentration type" and "intelligent distribution".
User can obtain the mode selection instruction by
clicking the corresponding determination button.
The system stores the operation state diagram
corresponding to each mode, as shown in the left
side of Figure 2.
Step 2: in response to the selected feeder
automation mode (voltage time type, current
concentration type or intelligent distribution), return
to the graphical interactive interface (intelligent
distributed interface, voltage time type interface or
current concentration type interface) corresponding
to the selected feeder automation mode with the
connection relationship between the switch Boolean
lamp and the fault Boolean lamp; Obtain the user's
click instruction for each fault Boolean lamp in the
graphical interactive interface and return to the
interactive interface for display to obtain the status
(fault information) of all fault Boolean lamps.
Step 3: input the states of all fault Boolean lights
into the composite operation control for addition and
summation, and judge whether the states of all fault
Boolean lights meet the requirements according to
the summation results. If the requirements are not
met, a prompt message is returned. If the
requirements are met, based on the status of all fault
Boolean lamps, the switch status control under the
corresponding mode is carried out to obtain the
status of each switch Boolean lamp and the feeder
automation simulation process to display the feeder
automation simulation results.
5 CONCLUSIONS
A feeder automation simulation method and system
based on LabVIEW software are proposed, and the
functions of the software platform are given. Based
on the simulation system, three modes of feeder
automation can be simulated, and the purpose of
ISAIC 2022 - International Symposium on Automation, Information and Computing
346

teaching and promoting distribution automation can
be achieved while interacting with users.
REFERENCES
Zhixin Zhou(2019). Development trend of automatic
control of power supply and distribution system.
Electronic technology and software engineering, 2019
(11): 153-154.
Xiangrong Gao(2017). Development trend of power
supply and distribution system in automation control.
Electronic testing, 2017 (1): 91-92.
Hao Ju, Hongwei Jia, et al(2021). Design of feeder
automation simulation platform. Scientific and
Technological Innovation Information, 2021(3):56-57.
Biao Xu(2017). Discussion on feeder Automation of
Distribution Automation. Construction engineering
technology and design, 2017(10):3676-3676.
Ye Wang(2006). Application of LabVIEW in Power
system. Xidian University, 2006.
Jianlin Chen(2018). Research on feeder automation
analysis platform based on LabVIEW. Shandong
University of Technology, 2018.
Jianlin Chen, Shulian Yang(2017). Implementation of
improved Fault location algorithm based on LabVIEW.
Shandong Industrial Technology, 2017(21):135-136.
Jiming Chen, Zhihua Ji, et al(2014). Design of Relay
Protection experiment system based on LabVIEW.
China Electric Power Education, 2014,(35).
Feeder Automation Simulation Method and System Based on LabVIEW
347
