
Analysis of Extreme Temperature and Drought Information of
Kunming
Zhanpeng Zhu and Zhongmu Li
Institute of Astronomy, Dali University, Dali, China
Keywords: Extreme Temperature information, drought information, Kunming.
Abstract: As greenhouse gas concentrations rise, widespread climate change increases the frequency and occur range
of extreme climate events. In order to explore the change of extreme temperature and its impact on drought
in Kunming, we analysis the interannual change trend of extreme temperature index (ETIs) and standardized
precipitation evapotranspiration index (SPEI) based on the meteorological series data of Kunming station
from the years 1959 to 2019, and studied the correlation between them. The results show that the warm
index (SU25, TN90P, TX90P and WSDI) increased significantly, while the cold index (FD0, TN10P and
TX10P) decreased significantly in ETIs; the rate of warming at night is higher than that at daytime. From
the years 1959 to 2019, the SPEI showed a downward trend with a rate of -0.47/ (10a). This shows that
Kunming has gradually changed from humid to arid in recent decades. In the correlation analysis, the warm
index was negatively correlated with SPEI, while the cold index was positively correlated with SPEI.
TN10P and TN90P were correlated on monthly and seasonal time scales opposite to the annual scale. ETIs
and SPEI were both negatively correlated in winter in Kunming.
1 INTRODUCTION
Under the influence of global warming, the water
cycle is accelerating, leading to frequent extreme
climate events. The global land area and population
that are affected by extreme climate events have
doubled (Lange et al., 2020). Drought in extreme
events reduced crop yields, increased wildfires and
desertification. To better understand the reasons for
the increase in extreme climate events, extreme
temperatures and droughts have been studied at
different regional scales.
On the global scale, the number of cold night
days decreases and the number of warm night days
increases in more than 70% of the world's regions
(Alexander et al., 2006). On the regional scale,
extreme temperature variations in the Asia-Pacific
region, northern South America, and Canada (Choi
et al., 2009; Aguilar et al., 2005; Zhang et al., 2000)
are essentially consistent with global changes.
However, the trend of drought varies in different
regions (Danandeh et al., 2020; Gao et al., 2017).
Kunming, one of the rapidly developing
representative cities in China, has experienced
frequent droughts and floods in recent years, which
have caused great losses to agricultural production
and socio-economics (He et al., 2021). Current
research mainly focuses on the study of extreme
climate index and drought change (Wu et al., 2019;
Yang et al., 2016), but did not study the specific
response between extreme climate index and
drought. Therefore, the study of ETIs trends and
their impact on drought will help us understanding
how temperature changes affect drought, as well as
have importance for disaster prevention and
agricultural development.
2 DATA SOURCES AND
RESEARCH METHODS
Data on daily precipitation, maximum temperature,
minimum temperature, and the average temperature
in Kunming from the years 1959 to 2019 were
provided by the National Meteorological Science
Data Center.
2.1 Quality Control
We use RClimDex software to control the quality of
the data for detecting inaccurate meteorological data
such as precipitation less than 0, daily minimum
Zhu, Z. and Li, Z.
Analysis of Extreme Temperature and Drought Information of Kunming.
DOI: 10.5220/0011921700003612
In Proceedings of the 3rd International Symposium on Automation, Information and Computing (ISAIC 2022), pages 273-277
ISBN: 978-989-758-622-4; ISSN: 2975-9463
Copyright
c
2023 by SCITEPRESS – Science and Technology Publications, Lda. Under CC license (CC BY-NC-ND 4.0)
273
Table 1: Definition of extreme temperature indices.
temperature higher than daily maximum temperature,
and outliers more than 4 times the standard
deviation. We use daily meteorological data to
calculate monthly mean temperature and monthly
precipitation.
2.2 Research Methodology
In this paper, we selected the key seven extreme
temperature indices from the ETIs recommended by
the Expert on Climate Change and Indicators
(ETCCDI).
2.2.1 Extreme Temperature Index
We used RClimDex 1.0 software to calculate the
ETIs, and the definitions of each index are shown in
Table 1. We used the Mann-Kendall (M-K)
statistical test and Sen slope to assess the magnitude
and significance of changes in each ETI. Pearson
correlation analysis were used to measure the
correlation between ETIs and SPEI.
2.2.2 Standardised Precipitation
Evapotranspiration Index
The standardized precipitation index (SPI) and SPEI
used by researchers in regional drought studies have
become the most important drought index
(Needalcov et al., 2015). Compared with SPI, SPEI
takes into account the effect of potential
evapotranspiration on drought (Dukat et al., 2022).
Comparative studies show that SPEI is more
reasonable (Suroso et al., 2021). Therefore, in this
paper, we calculate SPEI values on an annual time
scale, based on monthly mean temperature and
monthly total precipitation. When the SPEI value is
larger, it means that the area is wetter, while the
SPEI value is smaller, the area is drier. We use the
linear trend method to analysis the trend of SPEI in
Kunming from the years 1959 to 2019 and compare
the research results with the actual situation.
3 RESULTS AND ANALYSIS
Figure 1 shows the temporal variation
characteristics of ETIs.
3.1 Characteristics of Interdecadal
Variation in the Extreme
Temperature Index
All seven ETIs passed the 0.01 significance test.
The warm index (SU25, TN90P, TX90P and WSDI)
increased at rates of 1.05 d/a, 0.71 d/a, 0.49 d/a, and
0.92 d/a, respectively (Fig.1a and c). The cold index
(FD0, TN10P and TX10P) decreased at rates of
-0.32 d/a, -0.22 d/a,and -0.08 d/a, respectively
(Fig.1b and d). This indicates that the temperature
in Kunming increased significantly from the years
1959 to 2019, which is consistent with previous
research results (Wu et al., 2019). TN90P increased
at a higher rate than TX90P, and TN10P decreased
at a higher rate than TX10P, indicating that the
rising rate of temperature at night was higher than
that at daytime.
3.2 Characteristics of Interannual
Variation in SPEI
The interannual variation trend of SPEI in the study
area is shown in Figure 2. The SPEI in Kunming
showed a significant downward trend from the years
Classification Index Name Definitions Indices Unit
Extreme Cold
Index
Frost days Annual count when daily minimum
temperature < 0℃
FD0 d
Cold nights
Cold daytimes
Count of days where TN < 10th percentile
Count of days where TX < 10th percentile
TN10P
TX10P
d
d
Extreme Warmth
Index
Duration of
warm periods
Annual count of days with at least six
consecutive days in which Tmax > 90
percentile
WSDI
d
Summer days Annual count when daily maximum
temperature > 25℃
SU25 d
Warm daytimes Count of days where TX > 90th percentile TX90P d
Warm nights Count of days where TN > 90th percentile TN90P d
ISAIC 2022 - International Symposium on Automation, Information and Computing
274
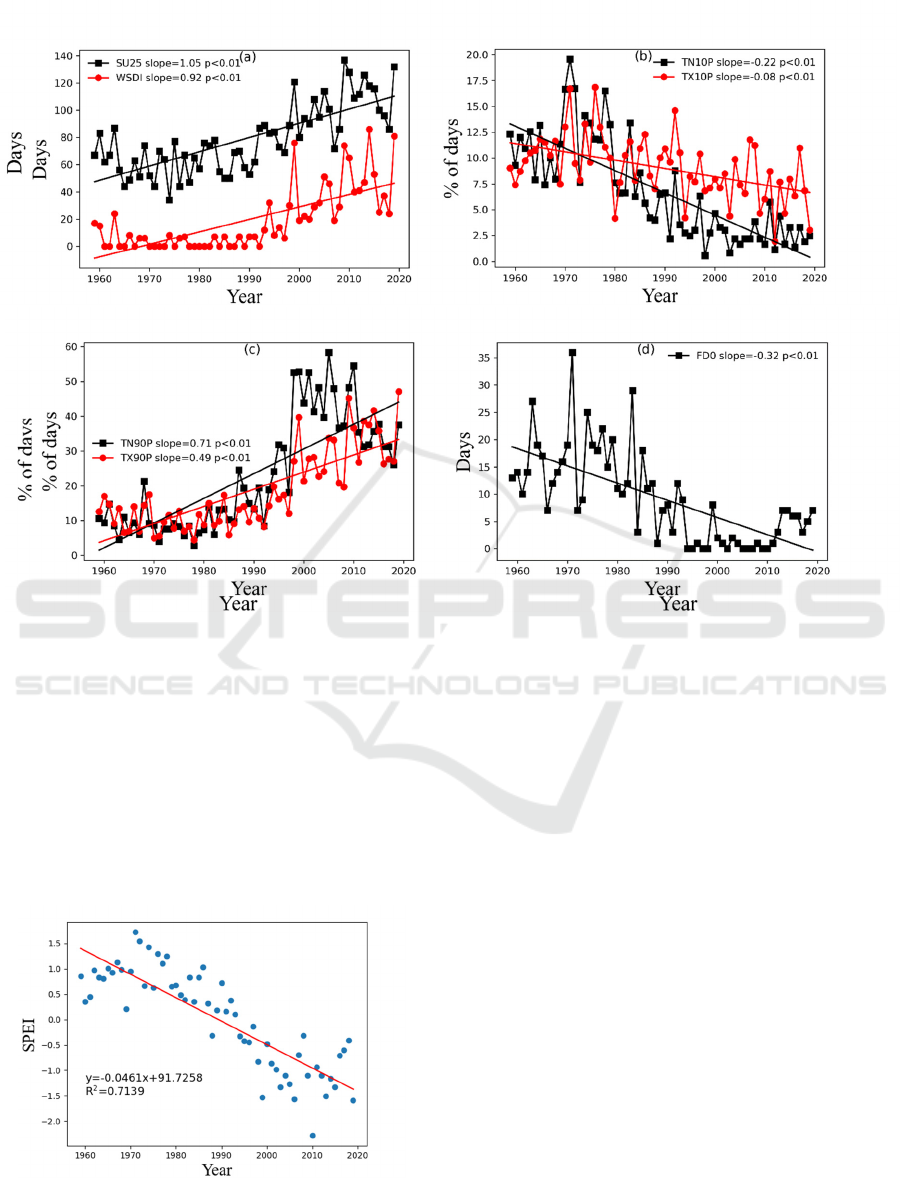
Figure 1: Changes of ETIs in Kunming from the years 1959 to 2019.
1959 to 2019, and the SPEI gradually changed from
positive to negative values. It shows that Kunming
has gradually changed from humid to arid in recent
80 years. The highest value (1.72) and the lowest
value (-2.29) of SPEI in 1970 and 2009 respectively
represent the wettest and dry years in Kunming. Tian
and Wan (2016) studied the occurrence regularity of
drought and flood disasters in Kunming, and the
results showed that the disasters gradually changed
Figure 2: Trends in annual scale SPEI.
from flood to drought. In 2010, the worst drought in
a century occurred in Kunming. The results of the
study are consistent with previous studies and
historical data.
3.3 Effects of Extreme Temperature
Changes on Drought
In order to understand the impact of extreme
temperature changes on drought, this paper
analyzed their relationships at different time scales
(monthly, quarterly and annually). Since Rclimdex
only provides monthly scale data for TN10P,
TN90P, TX10P and TX90P, this paper analyzed the
correlation between these four ETIs and SPEI on
monthly and quarterly time scales (Table 2).
At the annual scale, the extreme warm index
was negatively correlated with SPEI, while the
extreme cold index was positively correlated with
SPEI. This indicates that Kunming is more arid
when the warming index rises. As the cold index
drops, it gets wetter. This may be because the
precipitation in Kunming shows a decreasing trend
and the precipitation tends to be more concentrated
Analysis of Extreme Temperature and Drought Information of Kunming
275
Table 2: Correlation coefficients between ETIs and SPEI in Kunming on different time scales.
Indices (Month) TN10P TN90P TX10P TX90P
SPEI -0.697
**
0.577
**
0.651
**
-0.762
**
Indices
(Annual)
TN10P TN90P TX10P TX90P FD0 SU25 WSDI
SPEI 0.831
**
-0.904
**
0.676
**
-0.896
**
0.732
**
-0.881
**
-0.819
**
Season Indices TN10P TN90P TX10P TX90P
Spring SPEI -0.754
**
0.723
**
0.671
**
-0.856
**
Summer SPEI -0.776
**
0.610
**
0.669
**
-0.870
**
Autumn SPEI -0.872
**
0.745
**
0.669
**
-0.797
**
Winter SPEI -0.019 -0.033 -0.135 -0.069
Notes: ** stands for passing the significance test with p<0.01.
(Wu et al., 2020), making most of the precipitation
lost due to runoff, and the temperature rise increases
the surface evaporation, making the drought in
Kunming more serious. However, at the monthly
scale, TN10P and TN90P show the opposite
correlation to the annual scale. Rising nighttime
temperatures make the
Kunming area wetter; falling
nighttime temperatures make the Kunming area
drier. At the seasonal scale, ETIs and SPEI showed
significant correlations in all seasons except winter.
It can be found that in winter, extreme temperature
and SPEI are all negatively correlated. This
phenomenon indicates that drought is most likely to
occur in winter in Kunming area. The correlations
between ETIs and SPEI were consistent with the
monthly scale in all seasons except winter.
4 CONCLUSIONS
Among the seven ETLs, the warm index (SU25,
TN90P, TX90P and WSDI) increased significantly
and the cold index (FD0, TN10P and TX10P)
decreased significantly. ETLs all passed the 0.01
significant test. SPEI showed a downward trend, and
Kunming gradually changed from humid to arid
from the years 1959 to 2019. SPEI was negatively
correlated with warm index and positively correlated
with cold index. On monthly and seasonal time
scales (except for winter), TN10P and TN90P
showed correlations opposite to the annual scale. On
shorter time scales, higher nighttime temperatures
made the Kunming area wetter. In winter, both
extreme temperature changes made Kunming drier.
This paper briefly analysis the trends of ETIs and
SPEI in Kunming and the correlation between ETIs
and SPEI. However, the correlation between extreme
precipitation indices and SPEI, and the specific
physical factors behind the correlation between
ETIs and SPEI need to be further investigated.
ACKNOWLEDGEMENTS
This work is supported by Yunnan Academician
Workstation of Wang Jingxiu (202005AF150025),
the National Natural Science Foundation of China
(No.11863002), and Sino-German Cooperation
Project (No. GZ 1284).
REFERENCES
Aguilar, E., Peterson, T. C., Obando, P. R., et al., 2005.
Changes in precipitation and temperature extremes in
Central America and northern South America,
1961-2003. Journal of Geophysical Research:
Atmospheres, 110(D23).
Alexander, L. V., Zhang, X., Peterson, T. C., et al., 2006.
Global observed changes in daily climate extremes of
temperature and precipitation. Journal of Geophysical
Research: Atmospheres, 111(D5).
Choi, G., Collins, D., Ren, G., et al., 2009. Changes in
means and extreme events of temperature and
precipitation in the Asia-Pacific Network region,
1955-2007. International Journal of Climatology: A
Journal of the Royal Meteorological Society, 29(13),
1906-1925.
Danandeh Mehr, A., Sorman, A. U., Kahya, E., et al.,
2020. Climate change impacts on meteorological
drought using SPI and SPEI: case study of Ankara,
Turkey. Hydrological Sciences Journal, 65(2),
254-268.
Dukat, P., Bednorz, E., Ziemblińska, K., and Urbaniak,
M., 2022. Trends in drought occurrence and severity
at mid-latitude European stations (1951–2015)
estimated using standardized precipitation (SPI) and
precipitation and evapotranspiration (SPEI) indices.
Meteorology and Atmospheric Physics, 134(1), 1-21.
ISAIC 2022 - International Symposium on Automation, Information and Computing
276

Gao, X., Zhao, Q., Zhao, X., Wu, P., Pan, W., Gao, X.,
and Sun, M., 2017. Temporal and spatial evolution of
the standardized precipitation evapotranspiration index
(SPEI) in the Loess Plateau under climate change from
2001 to 2050. Science of the Total Environment, 595,
191-200.
He, P., Wang, Pan., Li, J. X., and Liu, S. H., 2021.
Characteristics of droughts and floods and their
urbanization response in Kunming, Yunnan Plateau.
Highland Meteorology (02), 272-280.
Lange, S., Volkholz, J., Geiger, T., et al., 2020. Projecting
exposure to extreme climate impact events across six
event categories and three spatial scales. Earth's
Future, 8(12), e2020EF001616.
Nedealcov, M., Răileanu, V., Sîrbu, R., and Cojocari, R.,
2015. The use of standardized indicators (SPI and
SPEI) in predicting droughts over the Republic of
Moldova territory. Present Environment and
Sustainable Development, (2), 149-158.
Suroso, S., Nadhilah, D., et al., 2021 Drought detection in
java island based on standardized precipitation and
evapotranspiration index (SPEI). Journal of Water and
Climate Change, 12(6): 2734-2752.
Tian, Y., and Wan, Y., 2016. The occurrence pattern and
risk assessment of flood and drought disasters in
Kunming in the past 50 years (eds.) 33rd Annual
Meeting of the Chinese Meteorological Society S4
Monitoring and prediction of drought meteorological
hazards and their impacts and countermeasures (pp.
216).
Wu, L. H., Peng, X., Ma, Y. W., Cheng, X. P., Gong, H.
D., and Dong, L. Q., 2019. Characteristics of changes
in extreme temperature and precipitation events in
Kunming from 1951-2016. Journal of Yunnan
University (Natural Science Edition) (01), 91-104.
Yang, R., Wang, L., Shen, G. Z., Wang, Y., and Wang, L.,
2016. Long-term trends of precipitation, air
temperature and extreme weather in Kunming area.
South-North Water Diversion and Water Conservancy
Science and Technology (06), 45-49.
Zhang, X., Vincent, L. A., Hogg, W. D., and Niitsoo,
A., 2000. Temperature and precipitation trends in
Canada during the 20th century. Atmosphere-ocean,
38(3), 395-429.
Analysis of Extreme Temperature and Drought Information of Kunming
277
