
Research on User-Centered Digital Media Exhibition Design
Xiong Han
*
and Yi Luo
Visual Arts Foundation Department, Hubei Institute of Fine Arts, Wuhan, China
Keywords: New Media, Exhibition Design, Virtual Reality, Analytic Hierarchy Process (AHP), Design Methodology.
Abstract: In order to produce DMED for audience interaction experience that is consistent with the era of big data, use
AHP to conduct a comprehensive evaluation of DMED. First, this paper uses literature research to
summarize the concept and characteristics of new media exhibition design and AHP, then uses AHP to
establish a DMED evaluation model, and then obtains the index weight value of each layer through expert
scoring for analysis and comparison, and finally designs the project space through evaluation. The result has
produced a exhibition space design based on the audience's visual interaction and integrating various new
media technologies. Interactive AR display design with unity 3D software and computer programming. The
new media technology based on the audience's visual experience is very important in the exhibition space
design. The output of this paper can provide design ideas for other exhibition designs.
1 INTRODUCTION
With the change of new digital media technology
(DMT) in the age of mega-data, the Digital media
exhibition design (DMED) is no longer just the use
of traditional exhibition methods, but also needs to
have the technology update of resource optimization
and allocation in it. According to statistics, in the
global digital trend, many museums in China and the
West have made digital optimization in exhibition,
such as the British Museum, the Metropolitan
Museum of the United States and the National
Palace Museum of China have introduced DMT,
which reflects that the digital industry is a new trend
of exhibition space design and a key development
direction. Therefore, The research on the exhibition
space evolution of museums in the new media
environment has become a new issue of concern to
the academic research and relevant industries (Kang,
2020). Through comprehensive evaluation, we can
understand its construction and measure the current
development level, which can be used as a reference
for the planning of DMED.
New media means interactive and digital
composite media with network technology,
communication technology and digital technology as
the transmission carrier. With the development of
digital information, new media has constantly
evolved, changed people's information receiving
methods and habits, and enhanced the media's
communication power and influence. DMED is a
space planning activity that serves the exhibition
content, and the core purpose is to effectively spread
some information or culture. The exhibition design
plans the original space structure of the building, and
plans and uses a certain space range through
technical support and artistic techniques to conform
to the atmosphere of the exhibition content. The
design category of exhibition space tends to go
beyond the view of simple space design, presenting
a design of comprehensive methods.
Now traditional media begin to use information
technology to change their own operation mode, and
new digital media technology is also widely used in
DMED. It has changed the traditional exhibition
cabinet, booth and other forms, and adopted a
variety of digital media, new science and technology
to create a live exhibition atmosphere. Virtual
augmented reality exhibition technology, 3D stereo
and holographic interactive images, on-site
interactive visual experience and other large-scale
digital media exhibition design technologies for
enterprises have made it widely used, which enables
all visitors to obtain a truly comprehensive
interactive experience (Hornecker, 2019). These
technologies have historically changed the
traditional art exhibition methods, and used these
digital international exhibitions to develop new
forms of expression for exhibitors. From the initial
308
Han, X. and Luo, Y.
Research on User-Centered Digital Media Exhibition Design.
DOI: 10.5220/0011911100003613
In Proceedings of the 2nd International Conference on New Media Development and Modernized Education (NMDME 2022), pages 308-314
ISBN: 978-989-758-630-9
Copyright
c
2023 by SCITEPRESS – Science and Technology Publications, Lda. Under CC license (CC BY-NC-ND 4.0)

development of a single static form to the integration
of various dynamic processes of human visual,
auditory, olfactory and tactile interactions, people
can participate more freely, actively and
interactively (Vi, 2017).
Overview of AHP (Analytical Hierarchy
Process) analytic hierarchy process: AHP is a
practical multi scheme or multi criteria decision-
making method proposed by American operations
research scientist Professor Thomas L. Saaty in the
early 1970s. This method uses a hierarchical method
to express complex decision-making problems, and
uses human subjective judgment and scientific
methods to determine their advantages and
disadvantages. At present, AHP has been widely
used in various fields, creating good economic and
social benefits for enterprises and society (Yu,
2021).
This study selects DMED as the research object,
and uses AHP method to analyze the application of
new technology in exhibition design. Establish the
structural model and compare the weight of the
selected design elements, so as to find out the
successful way of the DMED in the application
through the weight comparison, so as to further
provide theoretical and data support for the DMED.
2 RESEARCH PROCESS
The research process of this article is as follows in
this figure(fig1):
(1) Pre-investigation to establish the theoretical
basis, and theoretical analysis based on literature
research.
(2) Listen to expert opinions and establish an
AHP model for evaluation (Chang, 1996).
(3) Weight ordering based on evaluation results
(4) Project design from dissemination,
suitability, interactivity and technicality.
3 RECENT RESEARCH
In China, many researchers have emerged in China
to apply to space design and have made remarkable
research achievements. Zhang made a brief
interpretation of the theoretical method, practical
application and research results of space design by
exploring new media technology from different
levels.
Juan summarized practical design methods of
experiential exhibition space from architectural
design, user application design and other aspects. In
addition, in order to improve personal thinking about
the design method of exhibition experience space. In
addition, Chinese scholars Jin and Wen co authored
a systematic introduction to the practical application,
potential problems and future development of the
popular digital exhibition design; In recent years,
Qingqing and others elaborated the theoretical basis,
research methods, design applications and
development prospects of new media exhibition
design from the basic new media technology and
exhibition design theory, which has become a
practical manual of Digital media exhibition design
(DMED). These literatures objectively introduce the
DMED theory, project practice, technology
provision and the limitations of practical application,
providing theoretical and technical references for
this study.
Ronch pointed out that: "In the information age,
digital media information has become the most
popular way of cultural and artistic communication
for the audience”. Compared with traditional
methods, multimedia information is more easily
accepted by the public. Also, Sulema explored how
to use digital media technology to integrate smell,
touch, heat, etc. into media objects, so as to enrich
traditional multimedia content and enhance
immersion. Siorffe analyzed how to integrate digital
media The technology is integrated into the space,
forming the interaction between the audience and the
physical space enhanced by technology. Susan
McLeod discussed the adaptive design of the
exhibition space under the application of digital
media narrative technology in her research, further
proposed the concept of new media technology
applied to the exhibition design, and expanded the
application of new media technology in multi type
exhibition spaces.
Through the literature review, it is found that
both focus on digital media technology innovation,
and the research on how to reasonably layout
technology and user experience study remains on the
surface. From the existing research results, most of
them ignore the synergy and differences of DMED.
Therefore, it is of great theoretical and practical
significance to study the evolution model of
exhibition design in the new media environment by
combining AHP, considering the differences of
communication forms between new media and
exhibition space.
Research on User-Centered Digital Media Exhibition Design
309
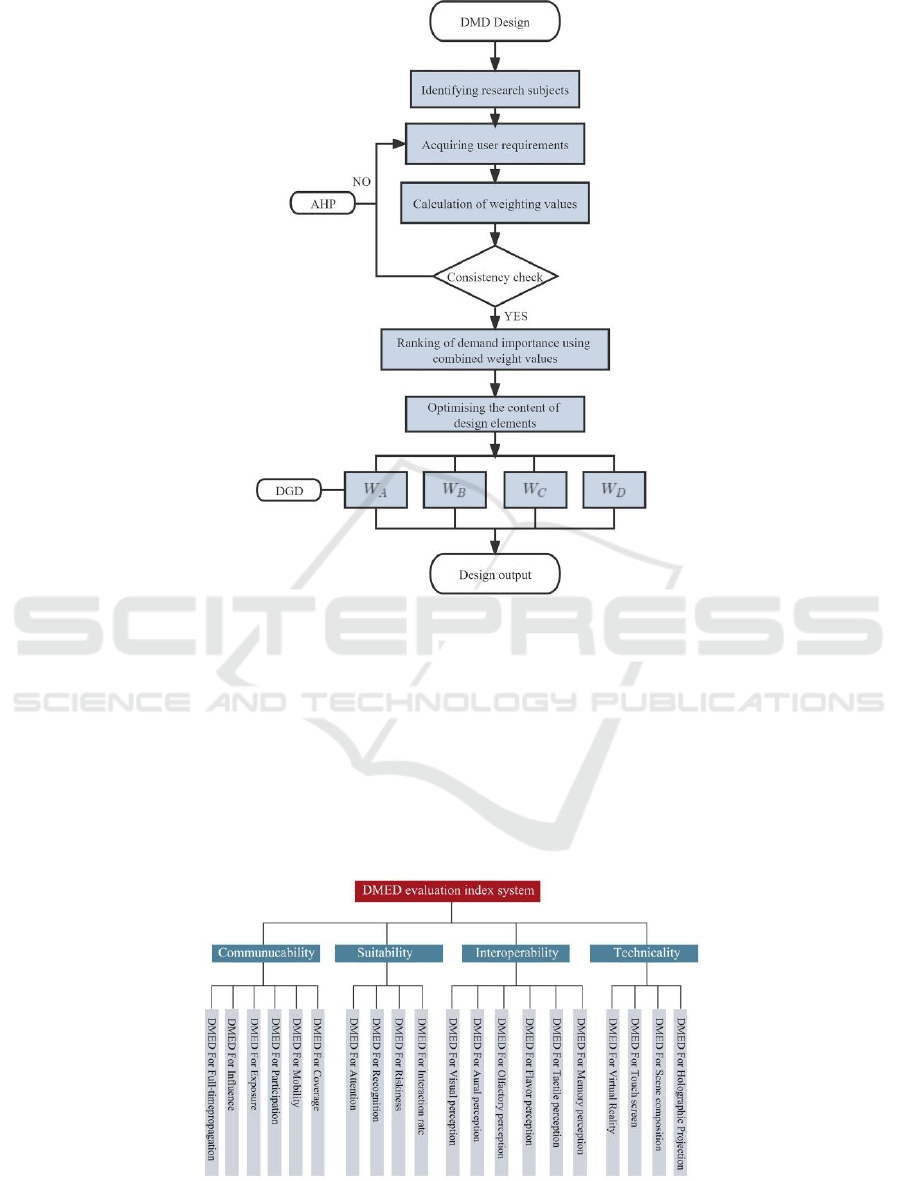
Figure 1: DMED Design Flow Chart
4 EVALUATION MODEL
4.1 Build A Hierarchical Analysis
Model
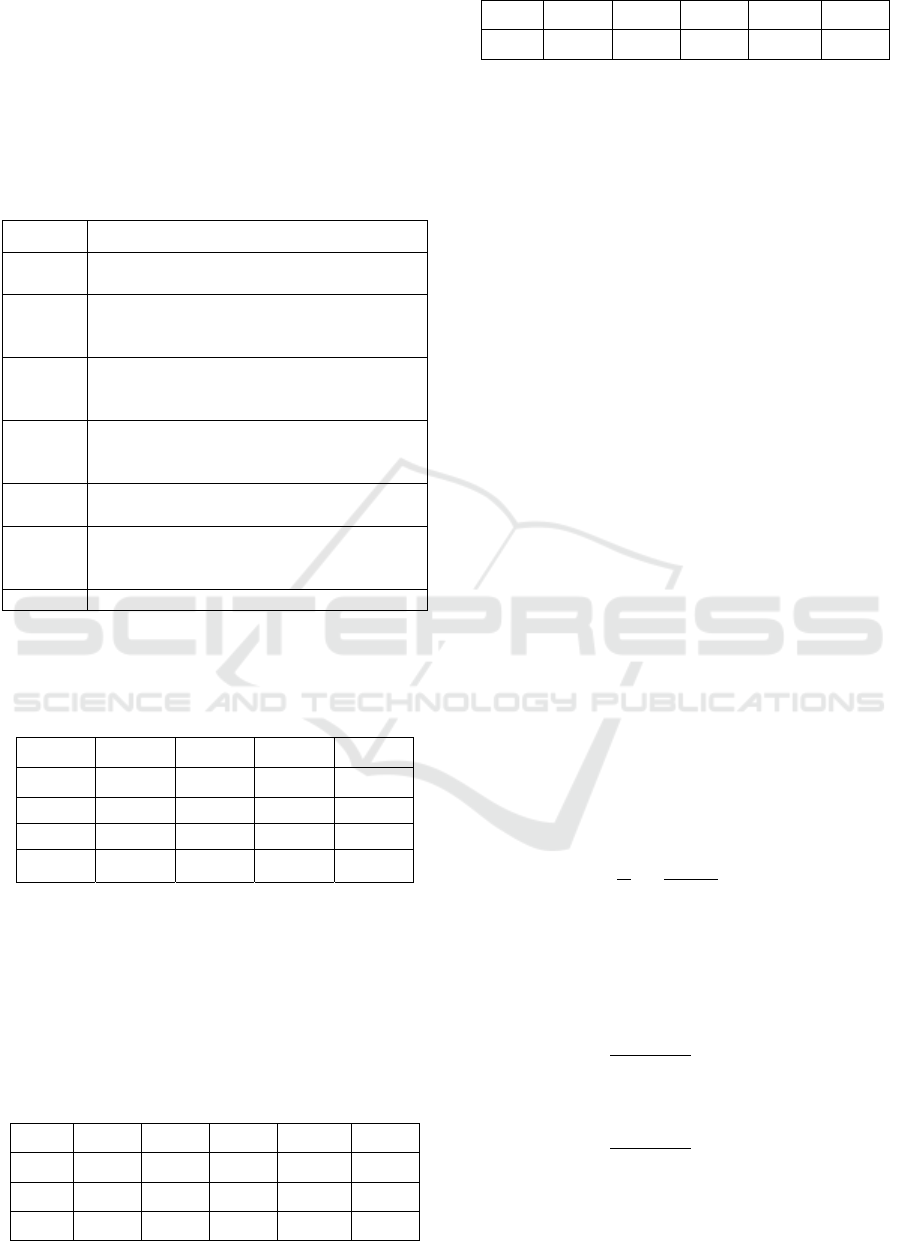
DMED are not only reflected in the aspect of
communication, but also the interactivity and
technicality cannot be ignored. Stand at the visitor's
point of view to establish an index system which
follows the dissemination, suitability, interactivity
and technical, and includes four dimensions and 20
indicators (Zancanaro, 2007), as shown in the this
figure (fig 2).
Figure 2: DMED evaluation chart
NMDME 2022 - The International Conference on New Media Development and Modernized Education
310
4.2 Build Judgment Matrix
AHP is used to calculate the preliminary subjective
weight, and the pairwise judgment matrix
constructed by seven experts on indicators according
to the 1-9 scale theory is collected. The 1-9 scale and
its significance are shown in this table(tbl1).
Table 1: Definition notes
Scale/a
ij
Definition notes
1
Two indicators have the same effect on one
attribute
3
Compared with the two indicators, one
indicator is slightly more important than the
othe
r
5
Compared with the two indicators, one
indicator is obviously more important than
the othe
r
7
Compared with the two indicators, one
indicator is much more important than the
othe
r
9
Compared with the two indexes, each
element is extremel
y
im
p
ortant
2、4、
6、8
Scales when a compromise between the
above two criteria is required
1/b
ij
Inverse com
p
arison of two indexes
Establish the indicator system, and set the second
level indicators as {ABCD}an shown in this
table(tbl2).
Table 2: indicator system
CODE A B C D
A 1 2 5 5
B 1/2 1 2 3
C 1/5 1/2 1 1
D 1/5 1/3 1 1
This comparison uses the sum product method to
calculate the eigenvector of the judgment matrix
elements. First, calculate the sum of the columns,
and then normalize the columns. Next, add the
normalized matrix to the same row. Finally, divide
the vector obtained after the addition by n to obtain
the weight vector of each indicator. As shown in the
table (tbl3).
Table 3: Weight value.
CODE A B C D W
i
A 0.076 0.154 0.385 0.385 0.527
B 0.077 0.154 0.308 0.462 0.261
C 0.111 0.278 0.556 0.556 0.111
CODE A B C D W
i
D 0.079 0.131 0.395 0.395 0.101
The specific steps are as follows:
Record the corresponding elements of the
judgment matrix {ABCD} layer in the table as bij
(i,j=1,2,...,4),
The elements in each column of the judgment
matrix are normalized into:
bij = bij/ bij
(1)
Add all columns in the same row of the
normalized matrix, namely:
wi = bij
(2)
Normalize wi, the formula is:
wi = wi/ wi
(3)
Then: w=[w1 w2 w3 w4]=[0.527 0.2641 0.111
0.101] is the indicator weight.
In order to avoid the error between the subjective
judgment matrix and the objective facts, the
consistency test shall be conducted. The necessary
and sufficient condition for the consistency of the n-
order matrix is the maximum eigenvalue
AW =
λ
W
(4)
A is the judgment matrix; λ Is the characteristic
value; W is the eigenvector. Minor inconsistencies
in the judgment matrix are unavoidable and
acceptable, and the consistency judgment is as
follows.
the greatest characteristic root:
ΛMAX =
1
N
BWI
WI
= 4.016
(5)
Judgment Matrix Consistency Index C.I., R. I is
the random consistency index, C. R is a random
consistency ratio
consistency index CI:
CI =
λ
maxn
n1
= 0.005
(6)
Random Consistency Indicators for Queries:
RI =
λ
maxn
n1
= 0.882
(7)
Consistent ratio CR:
Research on User-Centered Digital Media Exhibition Design
311
CR =
CI
RI
= 0.006
(8)
If CR < 0.1, consistency of the judgement matrix
is acceptable. If CR < 0.1, the judgement matrix
should be modified until consistency is acceptable.
So CR=CI/RI=0.006<0.1, the above calculation
shows that the judgment matrix achieves satisfactory
consistency index and meets the consistency
requirements, so the weight is valid, when the
proportion of the four dimensions is 52.7%, 26.1%,
11.1%, 10.1%, respectively.
According to the above decision table
construction, sample data processing and attribute
weights calculation process, the importance and
attribute weights of each factor in criteria layer and
index layer are calculated respectively, and the
results are shown in table and table.
Table 4: Evaluation results for communicability(A).
COD
E
A1 A2 A3 A4 A5 A6
Eigenv
ecto
r
Weight
(%)
A1 1 2 3 0.333 5 3 1.763 22.575
A2 0.5 1 2 0.333 3 1 1 12.807
A3 0.333 0.5 1 0.167 1 0.5 0.49 6.279
A4 3 3 6 1 6 4 3.302 42.286
A5 0.2 0.333 1 0.167 1 0.5 0.421 5.39
A6 0.333 1 2 0.25 2 1 0.833 10.664
“Communicability” result in this table(tbl4):
Participation rate is relatively important in the
criteria for assessing dissemination (0.423).
Table 5: Evaluation results for suitability(B).
CODE B1 B2 B3 B4 Eigenvector
Weight
(%)
B1 1 0.5 0.333 0.25 0.452 8.611
B2 2 1 0.2 0.167 0.508 9.684
B3 3 5 1 0.5 1.655 31.54
B4 4 6 2 1 2.632 50.165
“Suitability” result in this table(tbl5): The
interaction rate is relatively important in the
suitability evaluation criteria (0.502).
Table 6: Evaluation results for Interoperability(C).
CO
DE
C1 C2 C3 C4 C5 C6
Eigenve
cto
r
Weight
(%)
C1 1 2 6 6 2 3 2.749 35.868
C2 0.5 1 4 4 1 2 1.587 20.708
C3 0.167 0.25 1 1 0.25 0.333 0.389 5.076
C4 0.167 0.25 1 1 0.2 0.5 0.401 5.233
C5 0.5 1 4 5 1 2 1.648 21.493
C6 0.333 0.5 3 2 0.5 1 0.891 11.622
“Interactivity” result in this table(tbl6): Visual
perception is relatively important in the criteria for
assessing interactivity (0.359).
Table 7: Evaluation results for technicality(D).
CODE D1 D2 D3 D4 Eigenvecto
r
Weight (%)
D1 1 4 5 2 2.515 49.959
D2 0.25 1 2 0.5 0.707 14.047
D3 0.2 0.5 1 0.25 0.398 7.899
D4 0.5 2 4 1 1.414 28.094
“Technicality” result in this table(tbl7): Virtual
reality technology is relatively important in the
technical evaluation benchmark (0.500).
The results of the above analysis show that if the
four dimensions "dissemination", "suitability",
"interactivity" and "technicality" are used to promote
the development of DMED, attention should be paid
to improving the service level of high-tech design
first, and then to strengthening the customer
participation and experience of DMED in providing
services. To improve audience interaction, especially
the user experience, so that the audience can actively
participate in it.
5 DESIGN PRACTICE
5.1 Project Background
The front door of Beijing is an important part of the
historical and cultural area of Beijing. Due to the
needs of civil air defense conditions in wartime, a
network of civil air defense tunnels has been formed.
Through the Qian-men Underground Museum
project, relying on new media technology and
various visual exhibition methods, a new cultural
museum is created, which is inherited from top to
bottom and integrates collection, research and
exhibition.
1. Provide a exhibition platform for Beijing
Qian-men culture
To preserve our original cultural memory, we
used this museum to show the culture of the front
door and describe the history of the area.
2. Integrate visual exhibition of digital media
into traditional cultural space
Traditional culture is blended with new media
technology in a limited space, with visual perception
as the main exhibition method, and a large number
of new media exhibition methods to make the
audience experience a visual blending of traditional
and modern art.
3. Rebuilding and utilizing the original
underground space
In order to save land resources and economic
expenditure, we have transformed the original space
of Qian-men Underground City to avoid wasting
space resources.
NMDME 2022 - The International Conference on New Media Development and Modernized Education
312
5.2 Design Output
The business area is one of the outlets of
underground space in this figure (fig3(A)). Spatial
division in the form of curves mainly deals in the
creation of Qian-men culture. Relevant video is
played in this area to directly introduce Qian-men
culture and its derivatives to enhance the visual
perception of the audience.
Space one in this figure (fig3(B)) introduces the
old brand stores of the Qian-men which is moving
in, moving out and still running. The overall design
of the space uses virtual reality technology (AR) to
simulate the form of plaques, transparent plaques to
represent the disappeared brand, and black plaques
to represent the changed in brand. The comparison
between the two forms a visual impact, and LED
video technology to introduce the brand in the back
wall to enhance the audience experience.
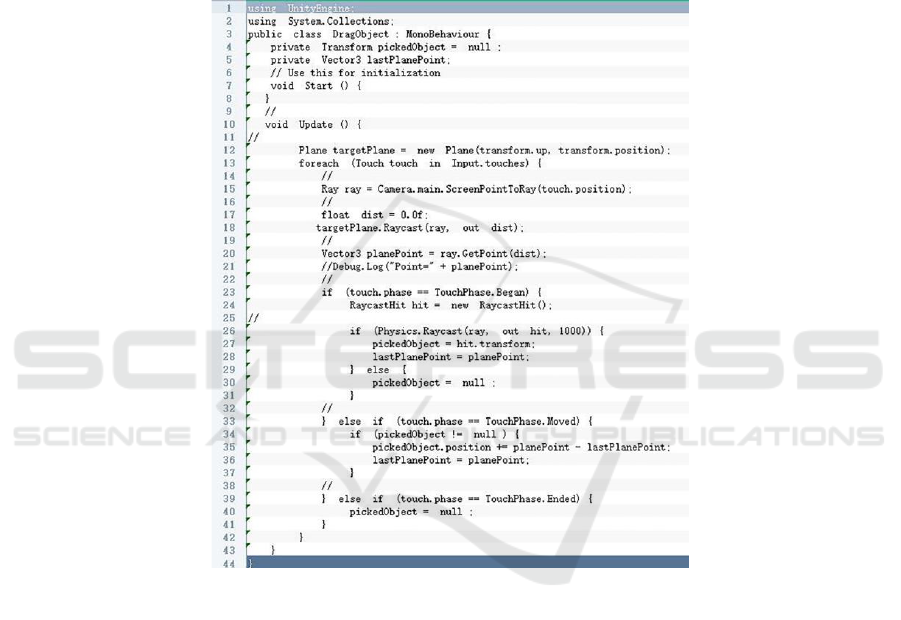
Append a script to the model to display and drag
AR of the model through Unity3d , as shown in this
figure(fig 4).
Figure 4: Cut code
Space two in this figure (fig3(C)) shows the
emergence of new things in modern Beijing that first
appeared in Qian-men area, which is reflected in the
leading role of Qian-men as a commercial center in
several fields in the process of the modernization of
the ancient capital. The space takes tram as the
starting point, and displays the real form simulation
of the old Beijing tram in the exhibition hall. The
window is an interactive screen for the audience,
showing the "news" of the old Beijing, as if those
histories were already in sight, creating a variety of
different visual effects for the audience. In the
headquarters area, a control screen has been added,
which enables the audience to interact with each
other, to arouse the interest of the audience and to
gain a deep understanding of this culture.
Due to the limitations of underground space and
narrow aisles, a single form is used to prevent people
from jamming.
The left wall displays the relevant documents of
the time when the air defense shelter was built. The
photo is used as the base of the exhibition wall, and
the traditional visual way is used to spread the
exhibition so that the audience has a basic
understanding of civil defense in wartime. The right
side uses projection technology to introduce the real
scene at that time to the audience, so that they can
recognize the difficulty of war. The place as shown
in this figure (fig3(D)).
Research on User-Centered Digital Media Exhibition Design
313
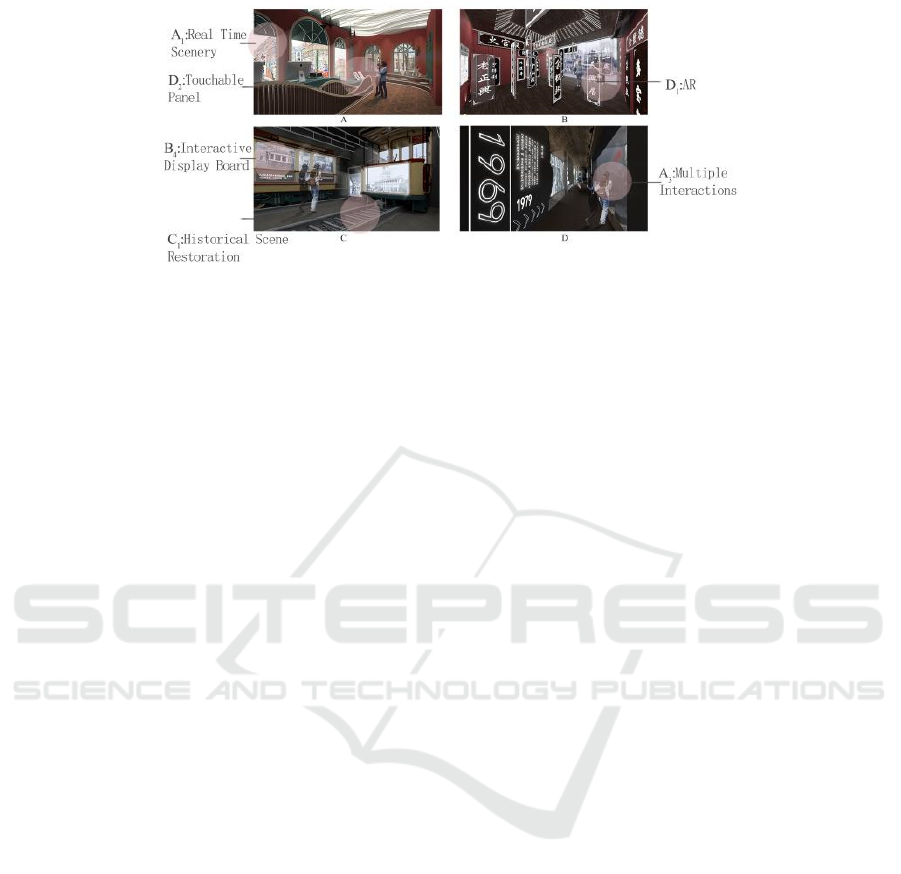
Figure 3: Design element description
6 CONCLUSION AND FUTURE
RESEARCH
The application of new media has significantly
improved the dissemination rate and audience
interaction rate of exhibition space, and improved
the wartime environment. More and more exhibition
designs have introduced new media technology for
spatial exhibition. Based on the new media and
exhibition design theory, this paper constructs a
DMED evaluation model for data analysis. The data
results verify the validity of the model, and provide
a new theoretical perspective and practical direction
for how to use more effective methods and
innovative technologies for spatial exhibition in
DMED. In the final project practice, it combines
virtual reality technology, holographic projection
technology and historical scene restore methods to
be used in various spaces to enhance the interactive
experience of the audience. A DMED project in
Beijing was produced and received good reviews.
Future research will further explore historical scene
restoration in the VR, increasing immersion from a
technical perspective.
REFERENCES
Chang, D. (1996). Applications of the extent analysis
method on fuzzy AHP. European Journal of
Operational Research, 95, 649-655.
Hornecker, E., &Ciolfi, L. (2019). Human-Computer
Interactions in Museums. Synthesis Lectures on
Human-Centered Informatics.
Kang, Y., & YANG, K. (2020). Employing Digital Reality
Technologies in Art Exhibitions and Museums.
Vi,C.T., Ablart,D., &Gatti,E., et al. (2017). Not just
seeing, but also feeling art: Mid-air haptic experiences
integrated in a multisensory art exhibition. Int. J. Hum.
Comput. Stud., 108, 1-14.
Yu, D., Kou, G., Xu, & Z., (2021). Analysis of
Collaboration Evolution in AHP Research: 1982-2018.
Int. J. Inf. Technol. Decis. Mak., 20, 7-36.
Zancanaro, M., Kuflik, T.,& Boger, Z., et al(2007).
Analyzing Museum Visitors' Behavior Patterns. User
Modeling.
NMDME 2022 - The International Conference on New Media Development and Modernized Education
314
