
Assessment of Aboveground Biomass-Vegetation Storage in Urban
Centres Using Remote Sensing Technology
Víctor Hugo González Jaramillo
1
a
and María Zapata
2
1
Departamento de Ingeniería Civil, Universidad Técnica Particular de Loja, Marcelino Champagnat, Loja, Ecuador
2
Escuela de Ingeniería Civil, Universidad Técnica Particular de Loja, Marcelino Champagnat, Loja, Ecuador
Keywords: Vegetation, Biomass, Remote Sensing, Unmanned Aerial Vehicle (UAV).
Abstract: Urban centres have grown rapidly, expanding into areas that were previously used for agriculture or were
occupied by natural vegetation such as forests. The development of human and productive activities has
increased environmental degradation and pollution through greenhouse gas emissions, which further
aggravates the aforementioned problems and increases the effects of climate change. One of the main
pollutants is CO
2
, which contributes to the warming of the earth's surface, but it can be removed from the
atmosphere by vegetation and stored as biomass. In urban centres, the lack of vegetation cover directly affects
the processes of air purification and carbon storage. This is why quantifying and monitoring the vegetation
cover is crucial in urban environments. This monitoring can be done through remote sensing techniques
supported by traditional processes such as data collection in the field. For this study, it was used satellite data
from Sentinel 2 and data from an unmanned aerial vehicle (UAV). The obtained results indicate a scarce of
vegetation cover within the urban centre.
1 INTRODUCTION
Nowadays, due to the increase in population and its
productive and industrial activities, cities are the main
sources of pollution and emission of greenhouse
gases (Chen, 2015; Liang et al., 2017), which go
directly to the atmosphere, affecting the environment.
These gases threaten the health of living beings that
inhabit a certain sector, but their effects expand
globally (Manisalidis et al., 2020). According to data
provided by the World Health Organization
(Sivaramanan, 2014), there are around 3.7 million
premature deaths due to air pollution, numbers that
are continually increasing due to excess emissions
from productive activities, industries and automobile
circulation (Roser, 2021). Cities are among the main
sources of emission of polluting gases such as CO
2
,
which is one of the main pollutants and generator of
global warming (Sood & Vyas, 2017). That is why
cities are also pioneers in finding ways to mitigate the
damage and collateral effects caused by pollution
(Chen, 2015).
a
https://orcid.org/0000-0002-2150-7690
To address the problem of the negative effects of
polluting and greenhouse gas emissions, the use and
implementation of urban green areas has been
proposed as an alternative (Badach et al., 2020;
Diener & Mudu, 2021), because vegetation purify the
water, the air, sequester C0
2
from the atmosphere and
release oxygen.
In continental Ecuador during the last decades
there has been a strong decrease in plant cover, where
different ecosystems have been affected, especially
primary forests (González-Jaramillo et al., 2016),
where not only is there complete deforestation, but
practices of selective extraction of commercial
species are carried out. Thus, near the populated
areas, the pressure of demographic growth and the
expansion of the urban area have generated the
decrease and degradation of vegetal covers. One of
these urban centres is the city of Loja, which in recent
years has shown accelerated population growth due to
the migration of people from rural to urban areas, thus
triggering the expansion of the urban area and
generating a considerable decrease in plant cover
(Tello, 2012). The city of Loja currently does not
have information on the vegetation cover within the
46
Jaramillo, V. and Zapata, M.
Assessment of Aboveground Biomass-Vegetation Storage in Urban Centres Using Remote Sensing Technology.
DOI: 10.5220/0011893500003536
In Proceedings of the 3rd International Symposium on Water, Ecology and Environment (ISWEE 2022), pages 46-51
ISBN: 978-989-758-639-2; ISSN: 2975-9439
Copyright
c
2023 by SCITEPRESS – Science and Technology Publications, Lda. Under CC license (CC BY-NC-ND 4.0)

city and previous reports such as INEC (2012), place
the cantonal head well below the reference minimum
threshold. For this reason, the objective of this
research is to use data from remote sensors to
determine the amount of existing vegetation cover in
the urban area, specifically in the vegetation of the
banks of the rivers and main parks of the city, this to
estimate the accumulated biomass and therefore its
carbon storage capacity.
2 STUDY AREA, MATERIALS
AND METHODS
2.1 Study Area
The city of Loja is located in the south of the Republic
of Ecuador at 2,100 m above sea level and has a land
area of 5,757.14 ha. In addition, the city is crossed
from south to north by two low-flow rivers
(Malacatos and Zamora), both intersect downstream
of the city to form the Jipiro River. In the urban centre
there are 21 types of vegetation cover (Villa, 2009),
among which are dominant tree species such as:
arupo, cascarilla, molle and sauce llorón (Salix
babylonica L.) (Alcaldía de Loja, 2015).
2.2 Materials and Methods
2.2.1 Satellite Data and Its Processing
In the present research work, Sentinel 2B images have
been used at level 1C with 10m of spatial resolution,
corresponding to the dates of 11/18/2017 and
07/31/2019. The satellite images were processed in
QGIS 3.4.12, with the Semi-Automatic Classification
Plugin (SCP) tool. To do this, a dark object correction
is performed to reduce the haze effect in the image
(Congedo, 2021), then cloud masking is applied to
use only pixels free of contamination. With the valid
pixels of the satellite images, the Normalized
Difference Vegetation Index (NDVI) was calculated
(Bhandari et al., 2012), where the NIR and RED band
are used. Simultaneously, the delimitation of the
vegetation cover of Loja city was carried out, for
which the information available in Google Satellite
was used, and which was obtained through the QGIS
QuickMapServices complement.
Subsequently, the amount of AGB was estimated
using the equation proposed by (Das & Singh, 2016),
as can be seen in Equation (1), where the previously
estimated NDVI value intervenes. From the
calculated AGB it was possible to estimate the
amount of stored carbon (C).
324.2* 14.18
mean
AGB NDVI=+
(1
)
Where:
AGB corresponds to Above Ground Biomass
NDVI
mean
corresponds to NDVI mean value
To estimate the amount of carbon stored (C), the
obtained AGB value is multiplied by a factor of 0.5,
which will give the mean AGB value.
2.2.2 Aerial Photographs Obtained with
UAV and Their Processing
Having a relatively large land area (5,757.14 ha), it is
not possible to cover the entire study area by UAV
flights. For this reason, 4 areas within the city were
selected for data collection (La Argelia, Parque
Lineal, Parque Recreacional Jipiro and Kartodromo).
In each zone, between 9 and 11 ground control points
(GCP) were placed, whose coordinates were obtained
with the help of a differential global positioning
system (GPS). Plots were also established within each
zone, in Argelia 5 plots were placed, in the Parque
Lineal 6 plots were placed, in the Jipiro zone 5 plots
and the Kartodromo zone 6 plots were placed.
Regarding the technical characteristics of the
overflights, a UAV Mapper platform with a 24.24
megapixel fixed focal camera, known as Ricoh GR
III, was used. The flight was executed considering a
double grid, with a horizontal and lateral overlap of
80%. The UAV flew over at a height of 110 m with a
speed of 18 m/s.
The obtained aerial photographs were processed
in the Pix4D software using photogrammetric
techniques, generating point clouds and orthomosaics
for each zone. From the 3D point clouds using the
FUSION 3.7 tool, digital terrain models (DTM) and
digital surface models (DSM) were generated. From
these data, an individual tree classification was
obtained (Iizuka et al., 2018; Wilkes et al., 2018), and
the variables of tree height (H) and diameter at breast
level (DBH) were derived (da Silva Scaranello et al.,
2012; González-Jaramillo et al., 2018). The derived
data are required for the estimation of aerial biomass
in the allometric equation proposed by Chave et al.
(2005), as can be seen in Equation 2. The amount of
carbon stored is considered to be half the value
obtained from AGB.
()
0.940
2
0.0776AGB D H
ω
ρ
=
(2
)
Assessment of Aboveground Biomass-Vegetation Storage in Urban Centres Using Remote Sensing Technology
47
Where:
AGB corresponds to Above Ground Biomass
D corresponds to chest height diameter
H corresponds to overall height
ρω corresponds to wood density
For the wood density, reference values have been
taken based on the species present in the research
area. The assumed value was 0.59 gr/cm3 based on
the species reported by Tello (2016).
2.2.3 Vegetation Measurements
The measurement of the vegetation was carried out
within the plots selected for the survey by means of
UAV. For this, a diametric tape and a hypsometer
model Vertex 5 of the HAGLOF brand were used. For
this purpose, there were measured only trees. The
position of each tree is obtained from high-resolution
satellite images. In the field, the variables to be
measured correspond to tree height (H) and diameter
at breast height (D).
3 RESULTS AND DISCUSSION
3.1 Total Estimation of Biomass and
Carbon through Satellite Images in
the City of Loja
Through the digitization of high-resolution satellite
data, a total of 86.38 ha of vegetation cover was
obtained in the city of Loja, where 59.01 ha
correspond to vegetation cover on riverbanks and
27.37 ha correspond to parks. The total area obtained
represents 1.48% of the total territorial extension of
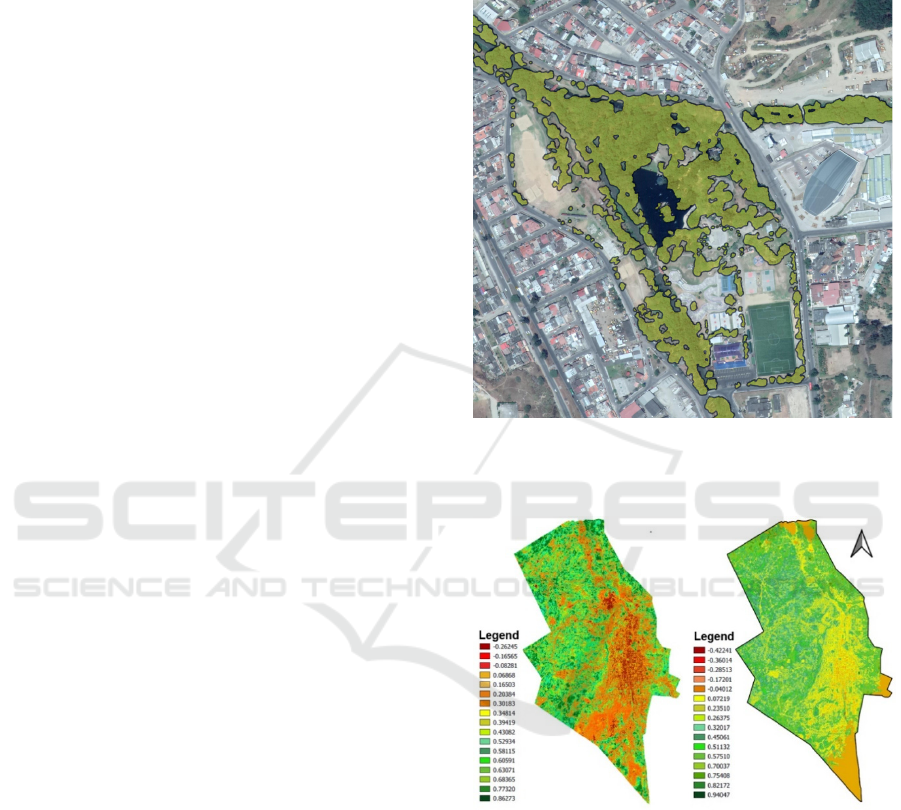
the area occupied by the city. Figure 1 shows the
process, where the vegetation has been delimited.
This process was done using high resolution satellite
images using the QGIS QuickMapServices plugin.
Figure 2 shows the delimitation of the city of Loja,
where through the Senstinel 2B satellite images the
NDVI values have been calculated for the study dates
(years 2017 and 2019). The images used for the
comparison correspond to different months (July and
November), this due to the high level of cloud cover
in the area, for which it was not possible to have
images for the same month.
For the estimation of AGB and C through the use
of satellite images, only the total area of existing
vegetation cover on the riverbanks and city parks has
been taken into consideration, which was estimated
and mentioned in this section (Figure 1). In the
satellite image corresponding to 11/18/2017, a total
of 12,797.31 Tn of AGB and 6,398.66 Tn of C were
obtained. In the satellite image corresponding to
07/31/2019, a total of 13,474.46 Tn was obtained of
AGB and 6737.23 tons of C.
Figure 1: Figure 1: Delimitation of vegetation cover in the
city of Loja.
Figure 2: Normalized Difference Vegetation Index (NDVI);
a) November 11, 2017, b) July 31, 2019.
3.2 Total Estimation of Biomass and
Carbon using UAV in the City of
Loja
The processed data from the 4 selected areas made it
possible to obtain the initial data for the development
of the study. For this, the photographs were processed
with the Pix4D software. Figure 3 shows the
delimitation of one of the sites and the distribution of
the GCPs used in the processing.
ISWEE 2022 - International Symposium on Water, Ecology and Environment
48
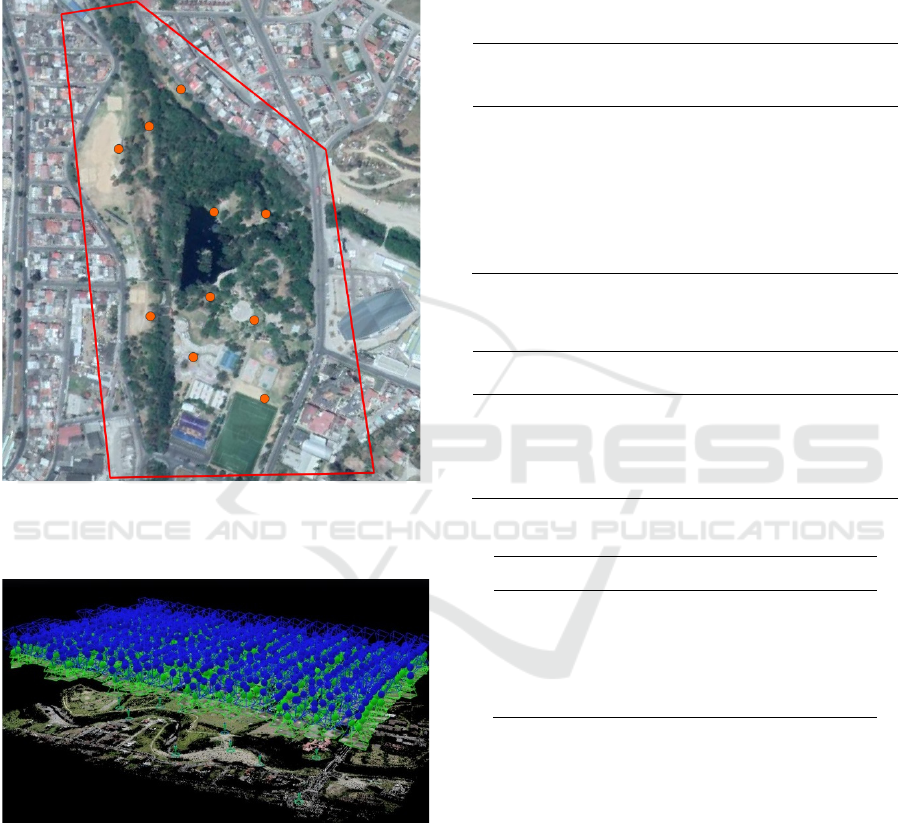
From the photographs obtained by each site,
products such as the point cloud and orthophotos are
obtained (Figure 4), which will serve for subsequent
analysis. From the point cloud, it is possible to
determine the DTMs and DSMs that were the basis
for the individual tree detection and the subsequent
processing for the AGB estimation.
Figure 3: Delimitation of the zones in the urban area in the
city of Loja and installation of the GCPs. This area
corresponds to Jipiro.
Figure 4: Cloud of points in the Argelia area
Table 1 shows the values obtained for each zone
according to the detection of individual trees, from
which the height of each tree, DBH and AGB values
were estimated. In this case, the mean values are
presented.
Table 2 shows the area that represents each of the
study zones and the values obtained for each zone for
AGB and for C. The estimate for each of the zones
consists of adding all the trees present in the zone.
Conventionally, average values are given in Tn/ha,
but in this case the AGB content is presented for an
entire area. With subsequent calculations, the mean
values can be obtained and represented in a
conventional manner with a distribution per ha (Table
3).
Table 1: Values obtained at individual tree level and its
parameters.
N° of
trees
H (m)
DBH
(cm)
AGB
(Tn)
Zones Mean Mean
Mean
Argelia 524 27,23 106,90
18,95
Parque
Lineal
432 19,00 51,01
2,80
Jipiro 995 20,53 60,01
4,31
Kartodromo 1136 18,72 49,61
2,61
Table 2: Study zones with total coverage and estimation of
AGB and C expressed in Tn.
Zones Area
(ha)
AGB (Tn) C (Tn)
Ar
g
elia 20,35 630,08 316,30
Parque Lineal 7,49 145,45 73,83
Ji
p
iro 16,72 433,67 219,19
Kartodromo 25,53 233,24 119,43
Total 1442,44 728,75
Table 3: AGB vales per each zone expressed in Mg ha
-1
.
Zones
AGB (Mg 𝐡𝐚
𝟏
)
Argelia 30,96
Parque Lineal 19,41
Jipiro 25,94
Kartodromo 9,20
The total estimated AGB on the riverbanks that
cross the city and its parks was 2,864.34 Tn. Of the
totals mentioned, 1,442.44 Tn of AGB were
estimated in the areas where data were obtained,
while for the areas where survey were not performed
with the UAV, 1,421.90 Tn of AGB were estimated
for an area of 62.47 ha.
The validation of data taken in the field was
carried out for the H and DBH variables for a total of
54 trees, which were distributed in the plots and
included trees of different heights (from 9 to 25 m),
obtaining a higher r
2
value of 94%. These values
represent the error introduced in the measurement and
the error estimated by taking the data with the UAV,
where, being a passive sensor, it cannot penetrate the
Assessment of Aboveground Biomass-Vegetation Storage in Urban Centres Using Remote Sensing Technology
49

foliage of the vegetation or herbs or shrubs existing at
the foot of the recorded tree.
In order to compare the results of the two
methodologies corresponding to the use of satellite
images and data from a UAV, work has been done at
the plot level. In the results obtained at this level, the
data obtained by UAV in the Argelia area, the plot
that yielded a greater amount of AGB was plot 5, with
53.73 Tn of AGB. In the Parque Lineal zone, the plot
that yielded the greatest amount of AGB was plot 5,
with 22.33 Tn of AGB. In the Jipiro zone, plot 3 was
the one that yielded a greater amount of AGB, with
62.36 Tn of AGB, and in the Kartodromo zone, plot
1 was the one that yielded a greater quantity of AGB,
with 7.15 Tn of AGB.
On the other hand, in the satellite images in the
Argelia area, the plot that showed the highest value of
AGB was plot 5, with 55.14 Tn of AGB. In the Parque
Lineal area, in the 2019 satellite image, the highest
AGB value was obtained in plot 1, with 57.41 Tn of
AGB, and in the 2017 image in plot 2, with 67.43 Tn
of AGB. In the Jipiro area, in both satellite images,
the plot with the highest amount of AGB was plot 2,
with 87.20 Tn of AGB in the 2019 satellite image, and
with 73.05 Tn of AGB in the 2017 satellite image.
Finally, in the Kartodormo area in both satellite
images, the highest value of AGB calculated was
found in plot 5, with 78.18 Tn of AGB, recorded in
the 2019 satellite image, and with 62.27 Tn of AGB
in the satellite image of 2017.
The results obtained by plots reflect an evident
difference between the used methodologies. For this
analysis, the results were calculated as a percentage,
considering the AGB variable for this purpose. Thus,
from a total of 22 plots, it was obtained that only 4
plots presented a percentage difference between
methods of less than 51%; of these 4 plots, 2 showed
values of difference less than 7%. While of the other
18 plots with values greater than 51%, 5 plots
presented a percentage difference greater than 93%.
4 CONCLUSIONS
Based on the methodologies applied through the use
of remote sensing data, it is partially possible to
obtain estimates of aboveground biomass. This is due
to the fact that the results obtained through the use of
satellite images reflect oversaturated values, while the
estimation through the use of UAV presents values
based on detection at the individual tree level, using
the parameters of H, DBH and mean values of the
wood density.
The city of Loja has a low vegetation cover in
their urban area. As can be verified in the results
presented, the largest amount of vegetation exists on
the banks of the rivers. While in the parks where the
largest number of people and vehicles are
concentrated, the vegetation cover is low.
UAV technology allows products such as point
clouds to be obtained, as well as high-resolution
orthophotos. These GCP-assisted data can have very
good accuracies, which can be comparable with data
obtained with much more expensive platforms such
as those from LiDAR (Wilkes et al., 2018; Chen et
al., 2016). This lowers costs, and allows
investigations and monitoring to be carried out,
especially in small areas, where financial resources
are limited.
ACKNOWLEDGEMENTS
Thanks to the Universidad Técnica Particular de Loja
(UTPL) to facilitate this research by means of project
PY278, funded by the Smart Land initiative.
REFERENCES
Alcaldía de Loja. (2015). Plan de Ordenamiento y
Desarrollo Sostenible del Casco Urbano Central de la
Ciudad de Loja Regeneración Urbana. Banco de
desarrollo de América Latina, Alcaldía de Loja.
Badach, J., Dymnicka, M., & Baranowski, A. (2020).
Urban Vegetation in Air Quality Management: A
Review and Policy Framework. Sustainability, 12(3).
https://doi.org/10.3390/su12031258
Bhandari, A. K., Kumar, A., & Singh, G. K. (2012). Feature
Extraction using Normalized Difference Vegetation
Index (NDVI): A Case Study of Jabalpur City. Procedia
Technology, 6, 612–621.
https://doi.org/https://doi.org/10.1016/j.protcy.2012.10
.074
Chave, J., Andalo, C., Brown, S., Cairns, M. A., Chambers,
J. Q., Eamus, D., Fölster, H., Fromard, F., Higuchi, N.,
Kira, T., Lescure, J.-P., Nelson, B. W., Ogawa, H.,
Puig, H., Riéra, B., & Yamakura, T. (2005). Tree
allometry and improved estimation of carbon stocks
and balance in tropical forests. Oecologia, 145(1), 87–
99. https://doi.org/10.1007/s00442-005-0100-x
Chen, B., Chen, Z., Deng, L., Duan, Y., & Zhou, J. (2016).
Building change detection with RGB-D map generated
from UAV images. Neurocomputing, 208, 350–364.
https://doi.org/10.1016/j.neucom.2015.11.118
Chen, W. Y. (2015). The role of urban green infrastructure
in offsetting carbon emissions in 35 major Chinese
cities: A nationwide estimate. Cities, 44, 112–120.
https://doi.org/10.1016/j.cities.2015.01.005
ISWEE 2022 - International Symposium on Water, Ecology and Environment
50

Congedo, L. (2021). Semi-Automatic Classification Plugin
Documentation Release 7.9.5.1. User Manual, August,
1–225. https://doi.org/http://dx.doi.org/10.13140/
RG.2.2.29474.02242/1
da Silva Scaranello, M. A., Alves, L. F., Vieira, S. A., de
Camargo, P. B., Joly, C. A., & Martinelli, L. A. (2012).
Height-diameter relationships of tropical Atlantic moist
forest trees in southeastern Brazil. Scientia Agricola,
69(1), 26–37. https://doi.org/10.1590/S0103-
90162012000100005
Das, S., & Singh, T. P. (2016). Forest Type, Diversity and
Biomass Estimation in Tropical Forests of Western
Ghat of Maharashtra Using Geospatial Techniques.
Small-Scale Forestry. https://doi.org/10.1007/s11842-
016-9337-y
Diener, A., & Mudu, P. (2021). How can vegetation protect
us from air pollution? A critical review on green spaces’
mitigation abilities for air-borne particles from a public
health perspective - with implications for urban
planning. Science of The Total Environment, 796,
148605.
https://doi.org/https://doi.org/10.1016/j.scitotenv.2021.
148605
González-Jaramillo, V., Fries, A., Rollenbeck, R.,
Paladines, J., Oñate-Valdivieso, F., & Bendix, J.
(2016). Assessment of deforestation during the last
decades in Ecuador using NOAA-AVHRR satellite
data. Erdkunde, 70(3).
https://doi.org/10.3112/erdkunde.2016.03.02
González-Jaramillo, V., Fries, A., Zeilinger, J., Homeier, J.,
Paladines-Benitez, J., & Bendix, J. (2018). Estimation
of Above Ground Biomass in a Tropical Mountain
Forest in Southern Ecuador Using Airborne LiDAR
Data. Remote Sensing, 10(5), 660.
https://doi.org/10.3390/rs10050660
Iizuka, K., Yonehara, T., Itoh, M., & Kosugi, Y. (2018).
Estimating Tree Height and Diameter at Breast Height
(DBH) from Digital Surface Models and Orthophotos
Obtained with an Unmanned Aerial System for a
Japanese Cypress (Chamaecyparis obtusa) Forest.
Remote Sensing, 10(1).
https://doi.org/10.3390/rs10010013
INEC. (2012). Indice Verde Urbano 2012. Ecuador En
Cifras, 1–15.
https://anda.inec.gob.ec/anda/index.php/catalog/360
Manisalidis, I., Stavropoulou, E., Stavropoulos, A., &
Bezirtzoglou, E. (2020). Environmental and Health
Impacts of Air Pollution: A Review. Frontiers in Public
Health, 8. https://doi.org/10.3389/fpubh.2020.00014
Roser, M. (2021). Data Review: How many people die from
air pollution? https://ourworldindata.org/data-review-
air-pollution-deaths
Sivaramanan, S. (2014). Air Pollution sources, pollutants
and mitigation measures.
https://doi.org/10.13140/2.1.5106.8485
Sood, A., & Vyas, S. (2017). Carbon Capture and
Sequestration- A Review. {IOP} Conference Series:
Earth and Environmental Science, 83, 12024.
https://doi.org/10.1088/1755-1315/83/1/012024
Tello, J. (2016). Inventario y evaluación de la vegetación en
las riberas del río Zamora de la ciudad de Loja.
http://dspace.utpl.edu.ec/bitstream/123456789/14841/
1/Tello_Aguirre_Joaquin_Eugenio.pdf
Tello, V. (2012). Diagnóstico de las áreas verdes del
perímetro urbano de la ciudad de Loja. Universidad
Técnica Particular de Loja.
Villa, N. (2009). Caracterización florística y estructura de
la vegetación natural de la cuenca superior del río
Zamora “hoya de Loja.” Universidad Nacional de Loja.
Wilkes, P., Disney, M., Vicari, M. B., Calders, K., & Burt,
A. (2018). Estimating urban above ground biomass
with multi-scale LiDAR. Carbon Balance and
Management, 13(1), 1–20.
https://doi.org/10.1186/s13021-018-0098-0
Assessment of Aboveground Biomass-Vegetation Storage in Urban Centres Using Remote Sensing Technology
51
