
Discharge Coefficient Analysis for Sluice Gates Set in Weirs
Agostino Lauria
a
, Antonino D’Ippolito
b
, Francesco Calomino
c
and Giancarlo Alfonsi
d
Department of Civil Engineering, Università della Calabria, Rende (CS), Italy
Keywords: Sluice Gates, Weir, Discharge Coefficients, Channel Inlet, CFD, RANS.
Abstract: Experimental tests and computational tests were performed to analyse discharge coefficients when gates are
placed into weir walls. Gate slope and side contraction effect have been considered. A great number of
experiments were conducted by considering three angles of inclination of the weir, three shape ratio and three
values of the relative opening. Two mathematical equations were obtained, relating the discharge coefficient
to the parameters that characterize the phenomenon. Furthermore, computational tests were performed
following the Reynolds-Averaged Navier-Stokes (RANS) approach in conjunction with a turbulence closure
model. In order to track the fluid surface, the Volume of Fluid algorithm being used. Numerical results have
been validated against the experimental showing a good agreement. The validated numerical fluid flow can
help to better understand the phenomenon not caught by the experiments.
1 INTRODUCTION
Sluice gates are efficient devices for flood control
purposes and active defence against flooding. Despite
sluice gates devices are commonly used, the
hydraulic phenomena that occur their operation are
not yet clear enough. Overall, the previous studies on
sluice gates are not focused on the lateral contraction
that can play a key role. By analysing the literature
some experimental papers are present about sloping
and vertical sluice gates (Montes, 1997, Sinniger and
Hager, 1988). In the case of sluice gates forming an
angle smaller than 90° with the horizontal plane, the
discharge coefficient, C
d
, decreased as the angle
increased (Sinniger and Hager, 1988). The discharge
coefficient decreases as the angle increases when this
one is less than or equal to 90° (Gentilini, 1941).
Other experimental works shows how the values of
C
d
against the relative opening range between 0.64
and 0.48 and decrease with the relative gate opening
(Roth and Hager, 1999, Rajaratnam, 1967). The
authors carried out one of the most complete studies
on the topic, by means of tests on a rectangular flume
and scale effect analysis. The authors showed the
presence of a ridge upstream to the gate, moreover,
a
https://orcid.org/0000-0003-4608-3684
b
https://orcid.org/0000-0003-3265-2196
c
https://orcid.org/0000-0002-6103-180X
d
https://orcid.org/0000-0001-5510-6708
they observed a recirculation zone upstream to the
gate, affecting the contraction of the vein, and two
oblique stationary waves at the channel inlet. In the
numerical field, many researchers reported a state-of-
art review on the potential flow theory-based model,
where the problem is described by a two-dimensional,
irrotational, inviscid flow (Fangmeier and Strelkofff
1968, Larock 1969, Belaud and Litrico 2008). Some
researchers carried out numerical simulations to study
C
d
, the distribution of the flow pressure and the flow
contraction past a sluice gate (Kim, 2007, Akoz,
2010). Recently the Volume of Fluid (VoF) algorithm
(Hirt et al., 1981), coupled with the Reynolds-
Averaged Navier-Stokes equations, were used in
several simulations of sluice gate flow (Cassan and
Belaud, 2012, Lauria et al. 2020). Phenomena
occurring during the underflow of sluice gates placed
in weirs are not properly investigated. In this work,
the phenomenon of the side contraction and gate
slope, that should affect the results in terms of C
d
,
have been considered.
Lauria, A., Dâ
˘
A
´
ZIppolito, A., Calomino, F. and Alfonsi, G.
Discharge Coefficient Analysis for Sluice Gates Set in Weirs.
DOI: 10.5220/0011884900003536
In Proceedings of the 3rd International Symposium on Water, Ecology and Environment (ISWEE 2022), pages 11-14
ISBN: 978-989-758-639-2; ISSN: 2975-9439
Copyright
c
2023 by SCITEPRESS – Science and Technology Publications, Lda. Under CC license (CC BY-NC-ND 4.0)
11
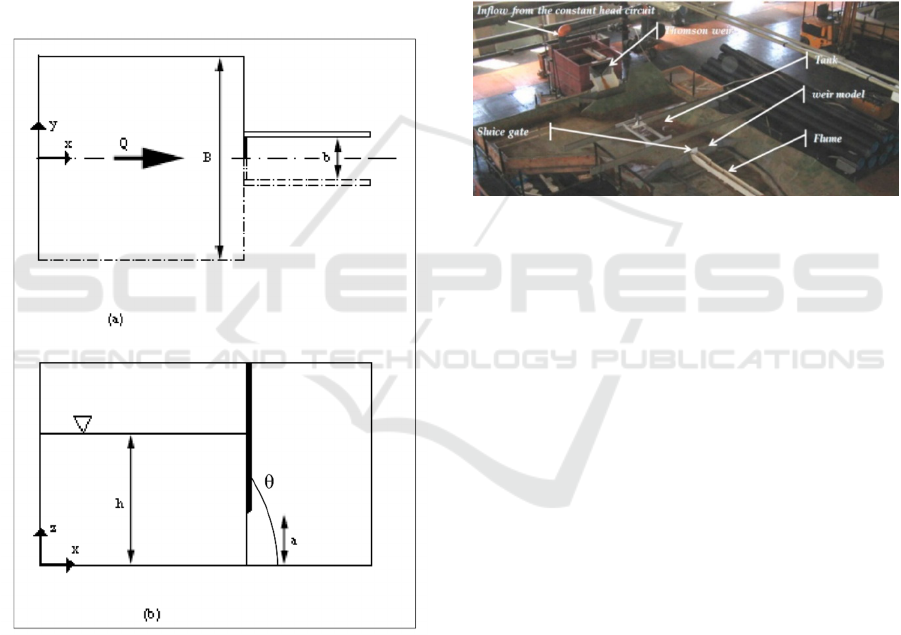
2 MATERIALS AND METHODS
By considering the definition sketch (Figure 1), the
discharge Q can be expressed as a function of ϴ, a, b,
h, g (gravity), ρ (water density), ν (kinematic
viscosity) and σ (surface tension):
F (Q, a, b, h, ϴ, g, ρ, ν, σ) = 0 (1)
After assuming Q=C
d
ab(2gh)^0,5, and by selecting,
a, g and ρ as basic variables, by applying the Π
theorem and by following the procedure reported in
Lauria et al. (2020), one has:
C
d
= (a/h, b/a, ϴ) (2)
Figure 1: Definition sketch: (a) up and (b) lateral view.
2.1 Experimental Tests
Experimental campaigns were conducted in a
physical model representing a structural device for
flood control purposes (see Figure 2). In the model
the weir is located into the riverbed causing a
backwater effect, and consequently the storage of a
flood volume in the upstream area (Lauria et al.,
2020). The dimensions of the rectangular tank were
120 cm along the span-wise, 400 cm along the
stream-wise, and 25 cm along the stream-normal
direction. The weir physical model, 18 cm high and
120 cm wide, was placed at its downstream end.
Vertical planes have been used to divide the weir in
two parts and therefore create an orifice of dimension
b (Lauria et al., 2020). A rectangular channel of width
b was placed downstream of the gate opening (see
Figure 1). Different values b = 8,6, 10,6 and 14,2 cm
(gate widths) has been considered. Experiments were
conducted with different values of a (gate opening)
and at different values of ϴ = 0,78, 1,11 and 1,57 rad
(weir inclination) and at different values (see Table 1
in Lauria et al. 2020).
Figure 2: Downstream view of the physical model
The flow from the laboratory circuit fed the tank and
the discharge values were collected by means of an
ultrasonic flowmeter and by means of a Thomson
weir (Figure 2). During experimental tests, the water
level was measured by means of a pressure transducer
and by means of an electric point gauge. The pressure
measurements were obtained by means of a dedicated
system able to get data in 12 different points of the
tank (Lauria et al., 2020).
2.2 Numerical Simulations
To extending the investigation field computational
tests were performed by solving the system of the
three‐dimensional Reynolds‐averaged Navier-Stokes
(RANS) equations, not reported here for brevity. A
two – equation (Wilcox, 1998) turbulence closure
model has been used. Reynolds stresses and the mean
flow field has been related by means of the k- ε model
(Launder and Spalding, 1974). For the execution of
the 27 tests chosen for the calculations (see Table 3 in
Lauria et al., 2008), the Flow‐3D
®
software has been
used. The model equations, together with the
turbulence model equations, are discretized with the
finite-volume method (FVM). As for the
discretization of the solution domain, a structured
mesh has been built, where the dependent variables
are stored at the centre of each cell space domain in a
ISWEE 2022 - International Symposium on Water, Ecology and Environment
12

co-located arrangement. To describe the free-surface
behaviour the Volume of Fluid (VoF) method (Hirt,
1975) has been used. The algorithm has been used by
other authors, always giving satisfactory results (see
Alfonsi et al., 2012, 2013, 2015 and D’Ippolito et al.,
(2019)). The computational domain was composed by
a three-dimensional geometry 49,6 cm along the
streamwise direction and 40,0 cm along the spanwise
direction and a rectangular one 30,0 cm along the
stream-normal direction. The computing space
dimensions spans respectively 79,6 cm along the
streamwise 40,0 cm along the spanwise, and 30,0 cm
along the stream-normal directions. The
computational mesh was refined increasing points in
all the directions. The considered mesh configuration
was composed of about 1,9 million cells. Wall
boundary condition was imposed at the bottom plane
and at the model geometry. Symmetry boundary
condition was imposed at the geometric symmetry
plane and outflow conditions had been set on the y–z
end‐plane of the computing domain. On the inflow
section, the experimentally measured fluid depth has
been set. As initial condition, experimentally
measured fluid depth was set in the area of domain
localized upstream of the gate. A multi-core
computational system has been used for the
computational runs (Alfonsi et al., 2012).
3 RESULTS AND DISCUSSION
Table 1 provides information about the experimental
data, where different inclinations (ϴ) of the weir
equal to 0,78 rad, 1,11 rad, and 1,57 rad, of the
channel widths b = 8,6, 10,6 and 14,2 cm, and of the
gate opening a = 5,0, 6,0 and 7,0 cm, were
considered. The values of discharge coefficients as a
function of a/h (relative opening) for the angle ϴ =
0,78, 1,11 and 1,57 rad (weir inclination), for b/a =
1,23 and 2,84 (aspect ratio) and taking into account
only the openings a ≥ 50 mm, are shown in Figure 3.
After identifying the value of the gate opening above
which the role of viscosity is negligible a regression
analysis was carried out using all the experimental
data, and the following equation was obtained:
C
d
= 0,388 * (a/h)
-0,30
ϴ
0,06
(3)
valid in the range 0,29 ≤ a/h ≤ 0,59, 1,23 ≤ b/a ≤ 2,84
and 0,78 ≤ ϴ ≤ 1,57 (in rad), with determination
coefficient R
2
= 0,97.
Table 1: Laboratory tests.
ϴ
(°)
a
(mm)
b (mm) h (mm) Q (l/s)
45 50 86 - 142 109 - 125 3,4 -5,2
45 60 86 - 142 136 - 144 4,2- 7,2
45 70 86 - 142 125 - 145 4,8
–
7,4
63,4 50 86 - 142 131 - 149 3,6
–
6,3
63,4 60 86 - 142 145 - 156 4,3
–
7,6
63,4 70 86 - 142 129 - 153 5,1
–
7,4
90 50 86 - 142 142 - 176 4,2
–
7,4
90 60 86 - 142 149 - 152 4,8
–
7,7
90 70 86 - 142 122 - 180 4,9
–
7,6
Figure 4 shows the comparison between the
numerical values of the computed discharge
coefficients versus the observed ones, valid in the
range 0,29 ≤ a/h ≤ 0,59, 1,23 ≤ b/a ≤ 2,84, for ϴ = 90°
, and the results show a very good agreement. The
validated numerical tool can help to investigate
deeply the phenomena.
Figure 3: Experimental values of C
d
versus a/h and
regression line.
Figure 4: Numerically computed vs observed discharge
coefficients for the case ϴ = 90°.
Considering the case ϴ = 45°, figure 5 shows the
numerically computed discharge coefficients versus
a/h. A regression analysis was carried out using the
0,4
0,45
0,5
0,55
0,6
0,2 0,3 0,4 0,5 0,6
C
d
a/h
0,4
0,5
0,5
0,6
0,6
0,4 0,5 0,6
C
d
(observed)
C
d
(computed)
Discharge Coefficient Analysis for Sluice Gates Set in Weirs
13

numerical results, and the following equation was
obtained:
C
d
= 0,370 * (a/h)
-0,356
(4)
valid in the range 0,20 ≤ a/h ≤ 1,00, 1,23 ≤ b/a ≤ 2,84
and for ϴ = 45°, with determination coefficient R
2
=
0,97.
Figure 5: Numerical values of C
d
versus a/h (ϴ = 45°).
4 CONCLUSIONS
Experimental tests and computational tests were
performed to analyse discharge coefficients when
gates are placed into weir walls. Gate slope and side
contraction effect have been considered. Two
mathematical equations have been obtained, relating
the discharge coefficient to the parameters that
characterize the phenomenon. The first one (equation
(3)), was valid in the range 0,29 ≤ a/h ≤ 0,59, 1,23 ≤
b/a ≤ 2,84 and 0,78 ≤ ϴ ≤ 1,57 (with ϴ in rad). The
second expression (equation (4)) is valid in a more
extended range (0,20 ≤ a/h ≤ 1,00, 1,23 ≤ b/a ≤ 2,84)
and for ϴ = 45°. The proposed results and the
validated numerical model, obtained by following a
RANS approach, can help to better understand the
phenomenon not caught by the experimental tests.
REFERENCES
Montes, R., (1997). Irrotational flow and real fluid effects
under planar sluice gates. J. Hydraul. Eng. 123, 219-
232.
Sinniger, R., Hager, W.H. (1988). Constructions
Hydrauliques. Ecoulements Stationnaires; Presses
Polytechniques Romandes; Traité de Génie Civil de
l’Ecole polytechniques fédérale de Lausanne:
Lausanne, Switzerland, Volume 15.
Gentilini, B. (1941). Efflusso dalle luci soggiacenti alle
paratoie piane inclinate e a settore. L’Energia Elettrica,
18, 361–380.
Roth, A., Hager, W.H. (1999). Underflow of standard sluice
gate. Exp. Fluids, 27, 339–350.
Rajaratnam, N. (1977). Free flow immediately below sluice
gates. J. Hydraul. Div. ASCE, 103, 345–351.
Fangmeier D., Strelkoff T. (1968) Solution for gravity flow
under a sluice gate. J. Engrg. Mech. Div. 94(EM1),
153–176.
Larock B. (1969). Gravity-affected flow sluice gate. J.
Hydr. Div. 95(HY4), 153–176.
Belaud G., Litrico X. (2008). Closed-form solution of the
potential flow in a contracted flume. Journal of Fluid
Mechanics 599, 299–307.
Kim D.G. (2007). Numerical analysis of free flow past a
sluice gate. KSCE Journal of Civil Engineering 11,
127–132.
Akoz M.S., Kirkgoz M.S., Oner A.A. (2010). Experimental
and numerical modelling of a sluice gate flow. Journal
of Hydraulic Research 47(2), 167–176.
Hirt, C.W., Nichols, B.D. (1981). Volume of fluid (VOF)
method for the dynamics of free boundaries. J. Comput.
Phys., 39, 201–225.
Cassan L., Belaud G. (2012). Experimental and numerical
investigation of flow under sluice gates. Journal of
Hydraulic Engineering 138(4), 367–373.
Lauria, A., Calomino, F., Alfonsi, G., D’Ippolito, A.
(2020). Discharge coefficients for sluice gates set in
weirs at different upstream wall inclinations. Water
2020, 12, 245.
Wilcox, D.C. (1998). Turbulence modelling for CFD;
DCW Industries: La Cañada, CA, USA.
Launder, B.E., Spalding, D.B. (1974). The numerical
computation of turbulent flows. Comput. Methods
Appl. Mech. Eng., 3, 269–289.
Alfonsi, G., Lauria, A., Primavera, L. (2012). Flow
structures around a large-diameter circular cylinder. J.
Flow Visual. Image Process., 19(1), 15–35.
Alfonsi, G., Lauria, A., Primavera, L. (2013). On evaluation
of wave forces and runups on cylindrical obstacles. J.
Flow Visual. Image Process., 20, 269–291
Alfonsi, G., Lauria, A., Primavera, L. (2015). The field of
flow structures generated by a wave of viscous fluid
around vertical circular cylinder piercing the free
surface. Procedia Eng., 116, 103–110.
D’Ippolito, A., Lauria, A., Alfonsi, G., Calomino, F. (2019)
Investigation of flow resistance exerted by rigid
emergent vegetation in open channel. Acta Geophys.,
67, 971–986.
Alfonsi, G., Lauria, A., Primavera, L. (2012). A study of the
vortical structures past the lower portion of the Ahmed
car model. J. Flow Visual. Image Process., 19, 81–95.
0,2
0,3
0,4
0,5
0,6
0,7
0,1 0,6 1,1
C
d
a/h
ISWEE 2022 - International Symposium on Water, Ecology and Environment
14
