
Performance Analysis of Solar Panels on Zinc Roofs
Firman Firman, Nur Hamzah, Muhammad Ruswandi Djalal and Tri Susilo
Department of Mechanical Engineering, State Polytechnic of Ujung Pandang,
Perintis Kemerdekaan km.10 Street, Makassar, Indonesia
Keywords: Solar Panel, Rooftop, Zinc Tile, Temperature, Efficiency.
Abstract: In general, the installation of PLTS Rooftop only considers the power capacity to be installed and the available
roof area and does not consider the type of roofing material where it is installed. Meanwhile, the roof of the
house has the absorption of sunlight and different thermal properties depending on the type of roofing
material. This study aims to observe the temperature characteristics between the solar panels and the roof of
the zinc tile material, where the effect of the height between the solar panels and the roof on the temperature
and its effect on the efficiency of the solar panels. Based on the results of this study, the temperature
characteristics between the solar panels and the roof (T3) various types of materials have an influence on the
efficiency value of the solar panels, where the maximum efficiency value is obtained at a temperature (T3) of
34.14⁰C of 4.67%.
1 INTRODUCTION
Utilization of solar energy as an alternative energy
source for meeting electricity needs in Indonesia is
very appropriate considering the geographical
location in the tropics with solar heat available
throughout the year. Indonesia's natural condition,
which is relatively difficult to reach by a centralized
electricity network, makes the choice of solar energy
a must (Septiadi, Nanlohy, Souissa, & Rumlawang,
2009).
One of the photovoltaic solar energy technologies
that is currently being developed is Rooftop Solar
Power Generation technology or PLTS Rooftop.
Rooftop PLTS is a reliable solution for energy supply
(Peng & Lu, 2013). Some of the advantages of the
PLTS Rooftop system are that it is easy and
inexpensive to integrate with existing electrical
systems and can reduce the burden on the existing
system network. In addition, maintenance and
operation are also easy, but the impact is significant
for reducing pollution and the greenhouse effect
(Castellanos, Sunter, & Kammen, 2017).
Seeing that the potential for solar energy in
Indonesia is very large (NA, 2012), several studies
regarding the use of PLTS Rooftop include (Tarigan,
2018) discussing the potential for implementing
PLTS rooftops in campus buildings. (Hakim, 2017)
examined the design of rooftop off grid solar panels
in residential homes as an alternative source of
electrical energy. (Mintorogo, 2000) investigated the
strategy of applying photovoltaic cells in residential
and commercial buildings. (Syafii, Novizon, Wati, &
Juliandri, 2018) discusses the application of rooftop
solar panels to reduce electricity consumption at peak
load conditions. (Altan et al., 2019; Kotak, Gago,
Mohanty, & Muneer, 2014; Salamanca, Georgescu,
Mahalov, Moustaoui, & Martilli, 2016) discusses the
implementation of rooftop solar panels in buildings.
In general, the installation of PLTS Rooftop only
considers the power capacity to be installed
(Alghamdi, 2019), and the available roof area and
does not consider the type of roofing material where
it is installed. Meanwhile, the roof of the house has
the absorption of sunlight and different thermal
properties depending on the type of roofing material.
The research that has been carried out to determine
the effect of temperature on the roof covering is by
(Rahmat, Prianto, & Sasongko, 2017), (Selparia,
Ginting, & Syech), and (Dominguez, Kleissl, &
Luvall, 2011). (Rahmat et al., 2017) investigated the
thermal conditions of the roof space produced from
various types of roofing materials such as tile,
asbestos and zinc. The results of this study indicate
that the average temperature of the roof space on a tile
roof is 1.91ºC to 2.31ºC lower than that of asbestos
and zinc roofs. Tile roofs are also more resistant to
solar radiation. The average tile roof surface
770
Firman, F., Hamzah, N., Djalal, M. and Susilo, T.
Performance Analysis of Solar Panels on Zinc Roofs.
DOI: 10.5220/0011879900003575
In Proceedings of the 5th International Conference on Applied Science and Technology on Engineering Science (iCAST-ES 2022), pages 770-776
ISBN: 978-989-758-619-4; ISSN: 2975-8246
Copyright © 2023 by SCITEPRESS – Science and Technology Publications, Lda. Under CC license (CC BY-NC-ND 4.0)
temperature is 0.28ºC lower than the asbestos roof
surface temperature and 1.55ºC lower than the zinc
roof surface temperature. However, the lowest
average roof surface temperature profile during the
day on an asbestos roof is 38.71ºC. Research
conducted by (Selparia et al.) discusses the
manufacture and testing of tools to determine the
conductivity of zinc plate, multiroof, and asbestos.
From these results, it was found that the highest
conductivity value was found on the zinc plate (0.482
W/m°C) and the lowest conductivity value was
multiroof (0.132 W/m°C). (Dominguez et al., 2011)
researched the Effects of Solar Photovoltaic Panels on
Roof Heat Transfer discusses the roof temperature
under PV is 2.5 times cooler than the roof exposed to
sunlight.
Several related studies such as (Odeh, 2018),
which discusses the thermal characteristics of rooftop
PV installations. Several previous studies have
discussed the effect of the type of roofing material
used as a PLTS Rooftop installation on the
temperature between the solar panels and the roof and
have not examined the effect of the distance between
the solar panels and the type of roofing material on
the temperature of the solar panels and have not
discussed its effect on the efficiency of the solar
panels. In research (Firman, Said, & Djalal, 2022),
discussing the performance characteristics of solar
panels on clay and ceramic tile roofing materials,
further research is needed on other types of materials.
Based on this description, this study was made to
observe the temperature characteristics between the
solar panels and the roof of the zinc material. In this
study, the effect of the distance between the solar
panel and the roof on the temperature and its effect on
the efficiency of the solar panel will be observed.
2 METHODS
2.1 Research Instrument Design
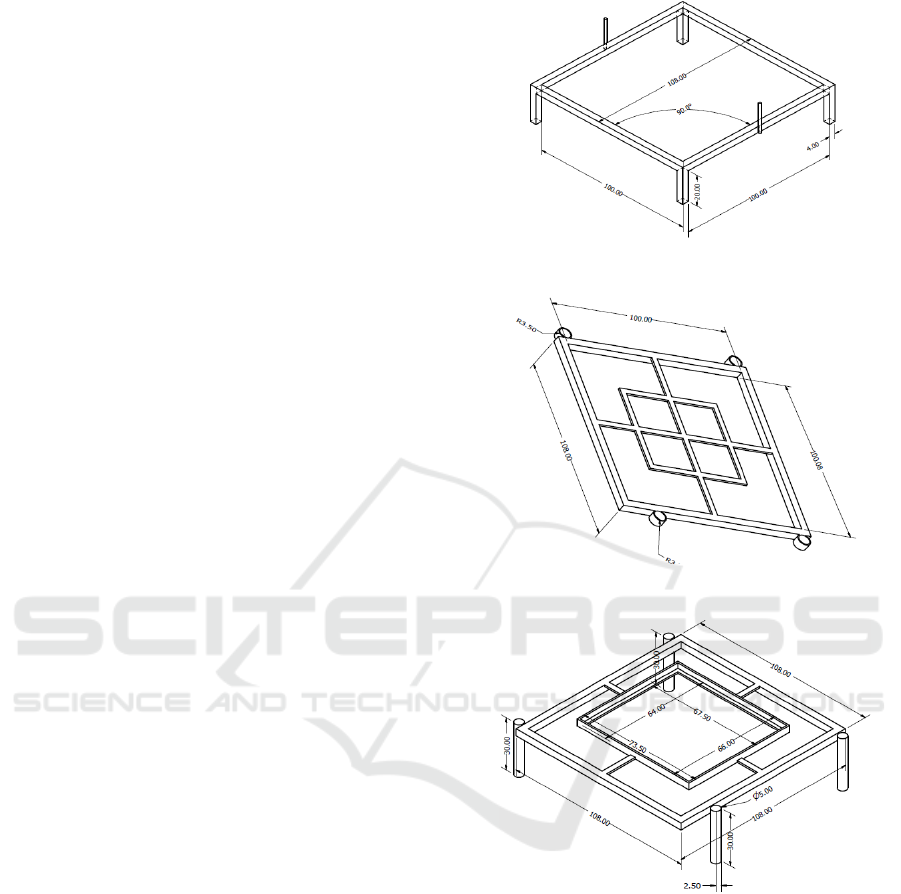
For the frame of the solar panel holder used hollow
iron material measuring 4 x 4 cm and also angled iron
measuring 3 x 3 cm, and for the material on the load
panel used acrylic material. Figure 1 below shows the
design of the solar panel framework and the roof.
Figure 1: Solar panel mounting design.
Figure 2: Tile mount design.
Figure 3: Dimensions of the solar panel framework and
roof.
In designing the load panel as the output of the
solar panel, acrylic material is used with a size of 75
x 60 cm. The following figure 2 shows the design of
the research instrument placement.
Performance Analysis of Solar Panels on Zinc Roofs
771
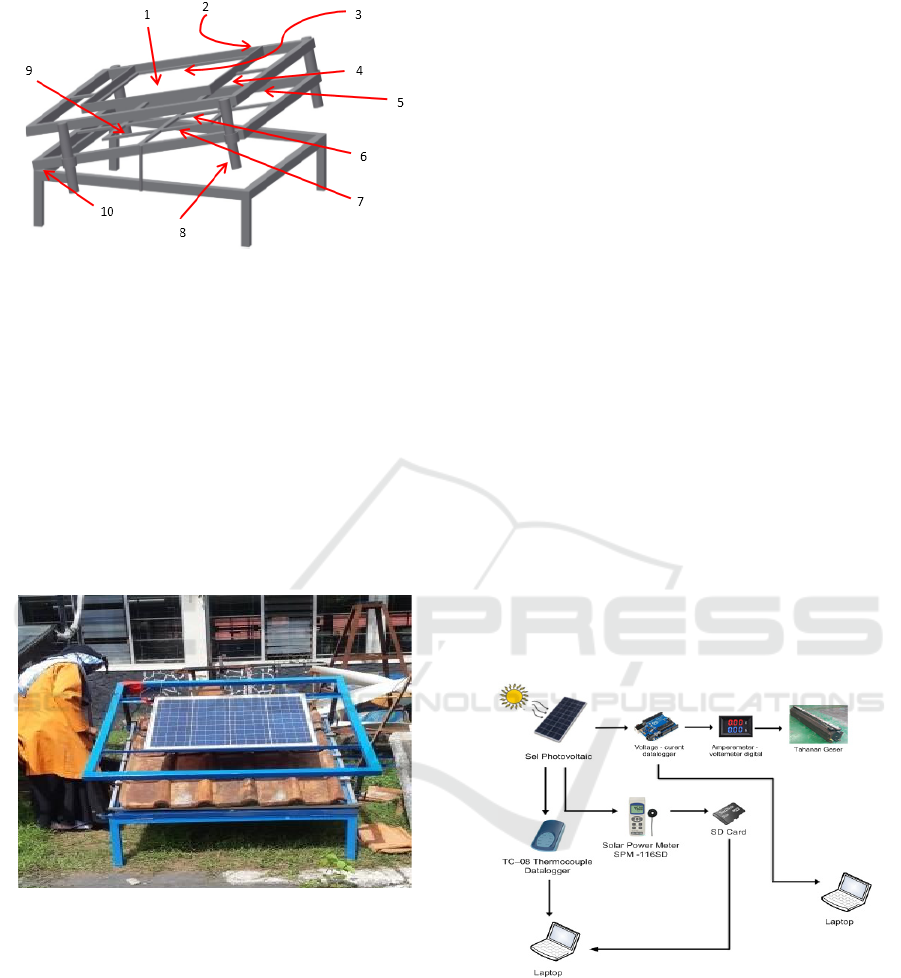
Figure 4: Research instrument placement design.
Information:
1. Solar Panel Mount
2. Solar Simulator Spot
3. Temperature above the solar panel, T1 (℃)
4. Temperature under the solar panel, T2 (℃)
5. Temperature between solar panel and roof,
T3 (℃)
6. Temperature above the roof, T4 (℃)
7. Temperature under the roof, T5 (℃)
8. Distance Variation Adjuster (cm)
9. Roof Mount
10. Tilt Angle (°)
Figure 5: Data collection process.
2.2 Testing Procedure
After the process of making and installing the
research components is complete, then proceed with
the testing procedure. The steps in the testing
procedure are as follows:
1. Testing will be carried out at 09.00 to 15.00 local
time.
2. Adjust the angle of inclination of the solar panels
based on the type of roof used.
3. Install solar panels on the roofing material with a
distance of H1.
4. Measure the distance (cm) between the solar
panels and the roof used.
5. Measure the temperature above the solar panel
(℃) and the temperature between the solar panel
and the roof (℃) using the TC-O8 Thermocouple
Data Logger.
6. Measuring the amount of solar radiation (W/m2)
on the solar panel using the Solar Power Meter
SPM-1116SD measuring instrument.
7. Connect the solar panel output to the load panel
and turn on the toggle switch.
8. Connecting the Voltmeter and Ammeter
Datalogger with a laptop to observe the amount
of current and voltage on the solar panel.
⮚ To ensure the datalogger and measurement
instruments on the load panel are
functioning properly, it can be determined
by turning on the switch on the lamp, then
increasing the voltage by turning the
potentiometer in this case the dimmer to its
maximum condition. The brightness of the
lamp will be directly proportional to the
amount of current and voltage as well as the
intensity of the sun received by the solar
panel. After all the measuring instruments
are functioning properly, then the data
collection can then be carried out.
9. Procedures 1 to 9 are repeated with a distance
of H2 and H3.
Figure 6: PLTS rooftop schematic.
3 RESULTS AND DISCUSSION
The research data contains solar panel parameters
measured on the type of zinc roofing material, the
distance between the solar panels and the roof varies,
including the distances of 35 cm, 30 cm, 25 cm, and
20 cm. In the variation of distance, the research was
iCAST-ES 2022 - International Conference on Applied Science and Technology on Engineering Science
772
conducted at 3 (three) observation times, namely at
09.30 WITA, 12.30 WITA, and 14.30 WITA.
The measurement data needed in this study
include:
- Solar radiation, G_bt (W/m2)
- Temperature above the solar panel, T1 (℃)
- Temperature under the solar panel, T2 (℃)
- Temperature between solar panel and roof,
T3 (℃)
- Temperature above the roof, T4 (℃)
- Temperature under the roof, T5 (℃)
- Solar panel current, I(A).
- Solar panel voltage, V(V)
- Time, (WITA)
The following is the research data from each of
the above categories taken from the average value of
the measurement results.
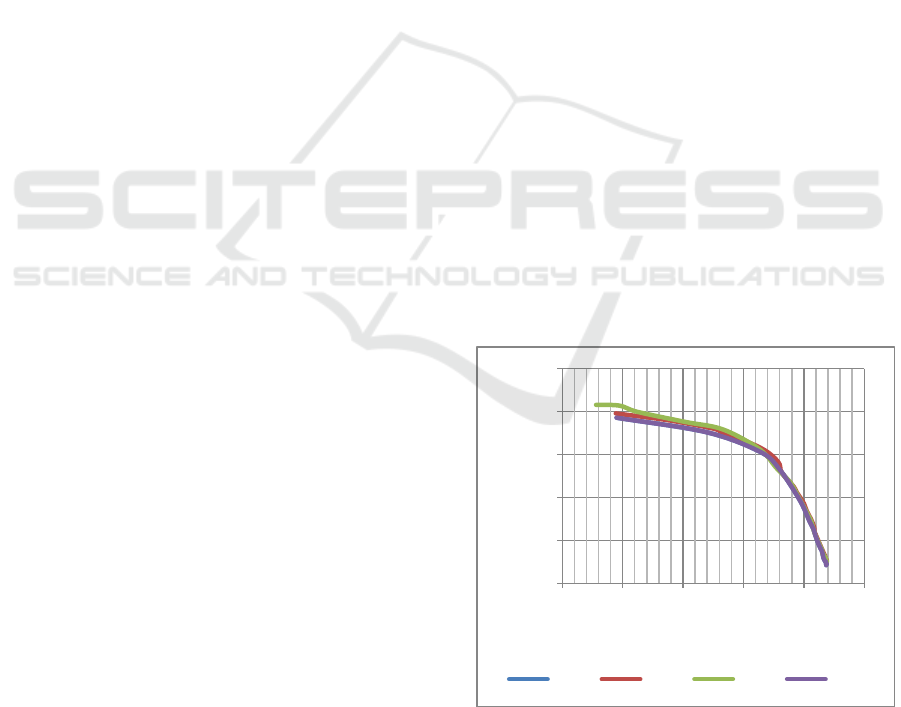
3.1 Characteristics I-V
Figure 5 shows the characteristics of the I-V curve
with various variations in the distance of the solar
panels on the zinc tile for the first experiment. The
graph shows that the voltage generated by the solar
panel is inversely proportional to the amount of
current flowing, where the greater the voltage, the
smaller the current. This is influenced by the resistive
load used in this experiment which varies from the
maximum value to the minimum value for each
variation of the distance between the solar panel and
the zinc tile. In the first experiment, the smallest
voltage value was generated at a distance of 25 cm,
which was 2.79 V with a current value of 2.08 A.
While the largest voltage value was generated at a
distance of 30 cm, which was 21.9 V with a current
value of 0.27 A. In the second experiment, the
smallest voltage value was generated at a distance of
35 cm, which was 0.95 V with a current value of 2.52
A. While the largest voltage value was generated at a
distance of 30 cm, which was 23.93 V with a current
value of 0.29. A. In the third experiment, the smallest
voltage value was generated at a distance of 30 cm,
which was 0.66 V with a current value of 1.74 A.
While the largest voltage value was generated at a
distance of 20 cm, which was 21.88 V with a current
value of 0. 22 A.
Based on Figure 5-7, the battery charging work
area is shown as an output on the solar panel which is
controlled by the BCR (Baterry Control Regulator).
BCR is a battery charging controller circuit in a solar
cell system by regulating the voltage used to charge
the battery in a voltage range of 11.4 V to 14.5 V as
shown in the graph above for charging a 12 V battery.
If the voltage drops to 11.4 V, the controller will
charge the battery if the sun is shining at that time, but
if it is at night, the controller will cut off the supply of
electrical energy. If the voltage rises to 14.5 V, the
controller will stop charging the battery. Overvoltage
in the battery will result in a relatively short battery
life.
From the graph trend of the first experiment, it can
be seen that at a distance of 25 cm the current and
voltage have a minimum value when compared to the
current and voltage values produced at a distance of
20 cm, 30 cm and 35 cm. This is because the effect of
convection heat transfer between the solar panel and
the zinc tile at a distance of 25 cm is greater because
this experiment was carried out when solar radiation
was at its maximum value (daytime). While in the
second experiment, it was seen that at a distance of 35
cm the current and voltage had a minimum value
when compared to the current and voltage values
produced at a distance of 20 cm, 25 cm and 30 cm.
This is because the effect of convective heat transfer
between the solar panel and the zinc tile at a distance
of 35 cm is greater because this experiment was
carried out when solar radiation was at its maximum
value (during the day). Meanwhile, in the third
experiment, it was seen that at a distance of 30 cm the
current and voltage had a minimum value when
compared to the current and voltage values produced
at a distance of 20 cm, 25 cm and 35 cm. This is
because the effect of convection heat transfer between
the solar panel and the zinc tile at a distance of 30 cm
is greater because this experiment was carried out
when solar radiation was at its maximum value
(daytime).
Figure 7: Characteristics of I-V curves with various
distances of solar panels on zinc tile for the first experiment.
0
0,5
1
1,5
2
2,5
0 5 10 15 20 25
Current(A)
Voltage(V)
35cm 30cm 25cm 20cm
Performance Analysis of Solar Panels on Zinc Roofs
773
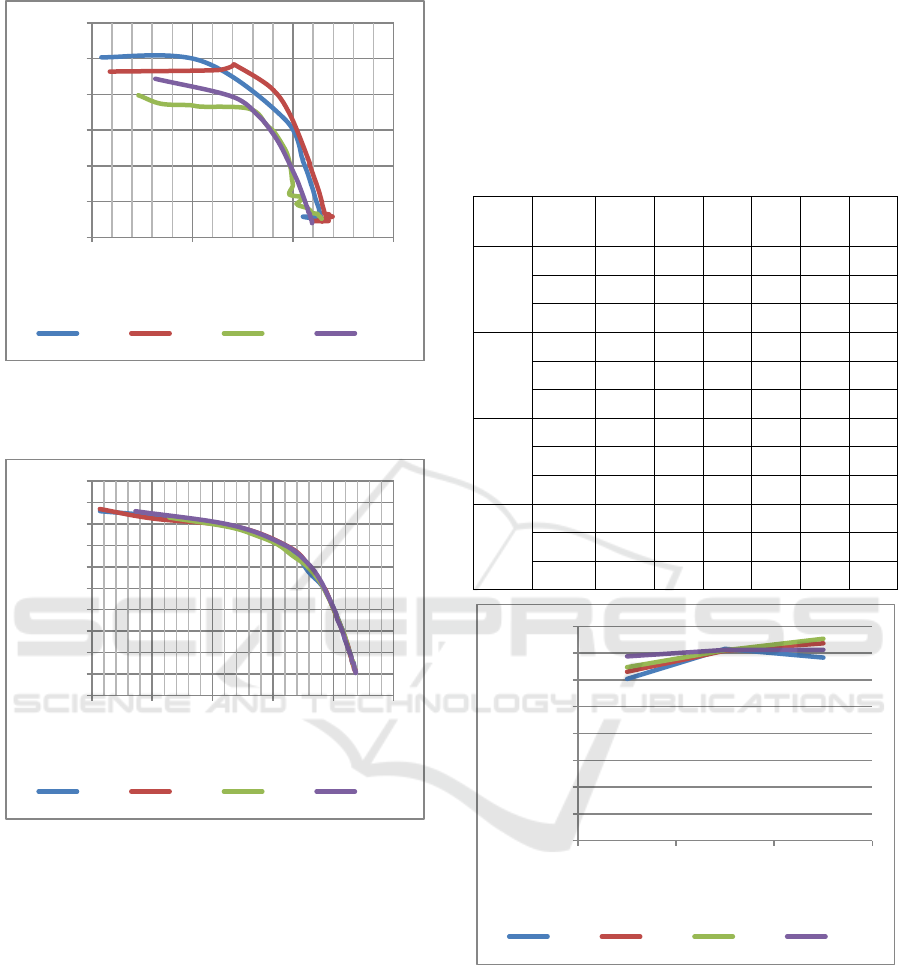
Figure 8: Characteristics of I-V curves with various
distances of solar panels on zinc tile for the second
experiment.
Figure 9: Characteristics of I-V curves with various
distances of solar panels on zinc roof tiles for the third
experiment.
3.2 Solar Panel Temperature
Characteristics
Figure 7 shows a comparison of the temperature
characteristics for several variations of the distance
on the type of zinc tile material. In testing using the
type of zinc tile material, it shows that at a distance of
35 cm, the highest T3 temperature in the test using
zinc tile roofing material was obtained in tests
conducted at 12.30 WITA which was 35.8oC. Next in
the test with a distance of 30 cm, the highest T3
temperature was obtained in the test conducted at
14.30 WITA which was 36.82oC. Next in the test
with a distance of 25 cm, the highest T3 temperature
was obtained in the test conducted at 14.30 WITA
which was 37.67oC. Next in the test with a distance
of 20 cm, the highest T3 temperature was obtained in
the test conducted at 14.30 WITA which was
35.62oC. Table 1 shows the results of testing the
characteristics of solar panels on zinc roof tiles.
Table 1: Temperature characteristics of zinc tile material.
Range
(cm)
Time
(WITA
)
𝐺
(W/m
2
)
𝑇
(℃)
𝑇
(℃)
𝑇
(℃)
𝑇
(℃)
𝑇
(℃)
35
09.30 870.7
56.0
1
47.8
6
30.1
8
35.1
6
34.0
0
12.30 1179
50.6
2
49.4
1
35.8
0
37.5
1
35.6
7
14.30 732
57.4
2
54.3
5
34.1
4
38.2
9
35.6
3
30
09.30 887.2
57.3
0
51.0
4
31.5
1
35.6
7
33.7
6
12.30 1032
56.5
9
43.8
5
35.4
4
38.9
5
37.7
4
14.30 727.2
58.5
1
57.0
6
36.8
2
40.0
2
37.4
9
25
09.30 886.1
51.9
5
48.4
4
32.3
7
36.0
8
35.5
7
12.30 974.2
56.3
6
55.6
5
35.5
1
39.2
0
37.4
8
14.30 732
60.1
3
58.4
0
37.6
7
42.1
1
40.0
2
20
09.30 880.9
58.9
6
54.1
2
34.3
9
37.5
5
36.7
8
12.30 1007
53.7
9
51.4
7
35.5
9
38.7
1
35.0
8
14.30 720.1
58.9
6
56.7
2
35.6
2
41.3
2
39.8
4
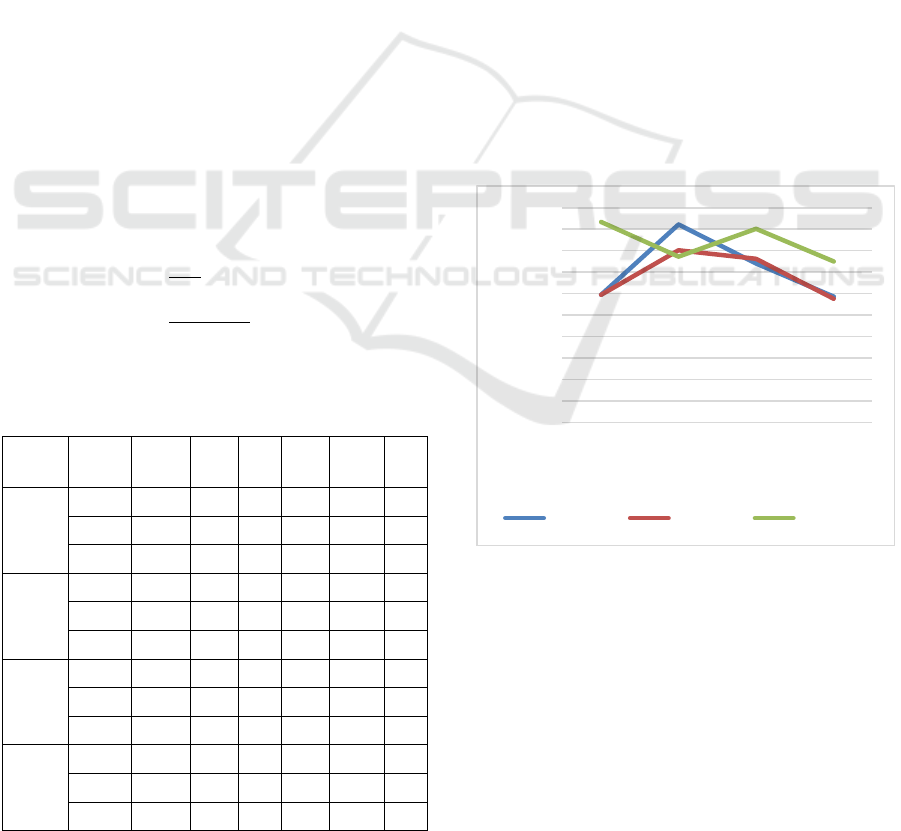
Figure 10: Comparison of temperature characteristics for
zinc tile material.
Testing the characteristics of the temperature of
the solar panels on the zinc tile shows an increasing
trend in the temperature graph from 09.30 to 14.30.
This is because zinc tile is a good conductor so the
heat from the roofing material can move to the top of
the solar panels.
0
0,5
1
1,5
2
2,5
3
0102030
Current(A)
Voltage(V)
35cm 30cm 25cm 20cm
0
0,2
0,4
0,6
0,8
1
1,2
1,4
1,6
1,8
2
0 5 10 15 20 25
Current(A)
Voltage(V)
35cm 30cm 25cm 20cm
0
5
10
15
20
25
30
35
40
9,3 12,3 14,3
TemperatureBetweenSolarPanelsand
Roofs,T3(°C)
Time(WITA)
35cm 30cm 25cm 20cm
iCAST-ES 2022 - International Conference on Applied Science and Technology on Engineering Science
774
3.3 Solar Panel Efficiency
For efficiency analysis, calculations were carried out
by taking the sample data in Table 1 with a distance
of 35 cm at 09.30 WITA. The parameters are as
follows:
● Intensity of solar radiation, G_bt = 870.7 W/m2
● Voltage, V = 20.36 V
● Current, I = 0.51 A
● Cross-sectional area, A = 0.538x0.636 = 0.342 m2
● The temperature above the solar panel, T1 = 56.01
● The temperature under the solar panel, T2 = 47.86
● Temperature between solar panel and roof, T3 =
30.18
● Temperature above the roof, T4 = 35.16
● Temperature under the roof, T5 = 34.00
● Time = 9.30 WITA
Input Power Calculation, 𝑃
𝑊
𝑃
= 𝐺
𝑥
𝐴
= 870,7 𝑊/𝑚
𝑥 0,342 𝑚
= 297,94 𝑊att
(1)
Output Power Calculation, 𝑃
𝑊
𝑃
= 𝑉 𝑥 𝐼
20,36 𝑉 𝑥 0,51
𝐴
= 8,83 𝑊att
(2)
Calculation of Solar Panel Efficiency, 𝜂 (%)
𝜂
𝑥 100%
,
,
𝑥 100%
2,97 %
(3)
Table 2: Power and efficiency of solar panels on zinc tile.
Range
(cm)
Time
(WITA
)
𝐺
(W/m
2
)
𝑉
(V)
𝐼
(A)
𝑃
(W)
𝑃
(W)
ƞ
(%
)
35
09.30 870.7
20.3
6
0.5
1
8.83
297.9
4
2.9
7
12.30 1179
20.2
7
0.7
6
11.9
6
403.5
5
2.9
7
14.30 732
18.1
0
0.7
8
11.7
2
250.6
2
4.6
7
30
09.30 887.2
19.0
1
0.8
5
13.9
9
303.5
7
4.6
1
12.30 1032
20.6
7
0.8
4
14.1
3
353.1
3
4.0
1
14.30 727.2
19.4
5
0.6
0
9.61
248.8
1
3.8
6
25
09.30 886.1
18.5
8
0.7
9
11.2
3
303.2
0
3.7
0
12.30 974.2
19.1
5
0.7
9
12.6
3
333.3
3
3.8
1
14.30 732
19.6
5
0.6
4
11.1
7
247.3
9
4.5
1
20
09.30 880.9
20.3
6
0.5
1
8.83
301.4
3
2.9
3
12.30 1007
20.4
5
0.5
6
9.89
344.5
5
2.8
8
14.30 720.1
20.1
4
0.5
3
9.23
246.4
1
3.7
5
The complete results of the calculation of input
power, output power, and solar panel efficiency are
shown in table 2 for the type of zinc tile material.
Table 3 shows the results of calculating the input
power, output power, and efficiency of solar panels
on zinc roof tiles. To see the comparison visually, the
results of the efficiency calculations are displayed in
a graphical form as shown in Figure 8. Figure 8 shows
a comparison of the efficiency for several height
variations of the types of zinc tile materials.
The highest efficiency value obtained for a height
of 35 cm is 4.67% at the time of testing at 14.30
WITA. While the lowest efficiency value was
obtained at the time of testing at 12.30 WITA which
was 2.88%. The efficiency value in this experiment is
influenced by the measured value of solar radiation
and temperature based on variations in height
between the roof and solar panels. Other factors that
affect the efficiency of solar panels in this study such
as wind speed and reflectance of sunlight from
roofing materials to solar panels are assumed not to
have much effect on this experiment because the test
framework (solar panels and roofs) are not placed on
tall buildings so that the -these factors are ignored.
Figure 8 below shows the efficiency of each test on
zinc tile material at various height distance variations.
Figure 11: Comparison of efficiency of solar panels types
of zinc tile materials.
4 CONCLUSIONS
Based on the research that has been done, it can be
concluded that:
1. In the first experiment, the smallest voltage value
was generated at a distance of 25 cm, which was
2.79 V with a current value of 2.08 A. While the
0
0,5
1
1,5
2
2,5
3
3,5
4
4,5
5
35 30 25 20
Efficiency(ƞ)
Height(cm)
09.30WITA 12.30WITA 14.30WITA
Performance Analysis of Solar Panels on Zinc Roofs
775

largest voltage value was generated at a distance
of 30 cm, which was 21.9 V with a current value
of 0, 27 A. In the second experiment, the smallest
voltage value was generated at a distance of 35
cm, which was 0.95 V with a current value of
2.52 A. While the largest voltage value was
generated at a distance of 30 cm, which was
23.93 V with a current value of 0. ,29 A. In the
third experiment, the smallest voltage value was
generated at a distance of 30 cm, which was 0.66
V with a current value of 1.74 A. While the
largest voltage value was generated at a distance
of 20 cm, which was 21.88 V with a current value
of 0.22 A.
2. The highest efficiency value obtained for a
height of 35 cm is 4.67% at the time of testing at
14.30 WITA. While the lowest efficiency value
was obtained at the time of testing at 12.30
WITA which was 2.88%.
REFERENCES
Alghamdi, A. S. (2019). Potential for Rooftop-Mounted PV
Power Generation to Meet Domestic Electrical Demand
in Saudi Arabia: Case Study of a Villa in Jeddah.
Energies, 12(23), 4411.
Altan, H., Alshikh, Z., Belpoliti, V., Kim, Y. K., Said, Z.,
& Al-chaderchi, M. (2019). An experimental study of
the impact of cool roof on solar PV electricity
generations on building rooftops in Sharjah, UAE.
International Journal of Low-Carbon Technologies,
14(2), 267-276.
Castellanos, S., Sunter, D. A., & Kammen, D. M. (2017).
Rooftop solar photovoltaic potential in cities: how
scalable are assessment approaches? Environmental
Research Letters, 12(12), 125005.
Dominguez, A., Kleissl, J., & Luvall, J. C. (2011). Effects
of solar photovoltaic panels on roof heat transfer. Solar
Energy, 85(9), 2244-2255.
Firman, F., Said, N. H., & Djalal, M. R. (2022).
Characteristic Analysis of Solar Panels on Clay and
Ceramic Roof Tiles. 2022, 16(3). doi:10.
15866/ireme.v16i3.20004130-138 %J International
Review of Mechanical Engineering (IREME).
Hakim, M. F. (2017). Perancangan Rooftop Off Grid Solar
Panel Pada Rumah Tinggal Sebagai Alternatif Sumber
Energi Listrik. Dinamika DotCom.
Kotak, Y., Gago, E., Mohanty, P., & Muneer, T. (2014).
Installation of roof-top solar PV modules and their
impact on building cooling load. Building Services
Engineering Research & Technology, 35(6).
Mintorogo, D. S. (2000). Strategi aplikasi sel surya
(photovoltaic cells) pada Perumahan dan bangunan
komersial. DIMENSI (Journal of Architecture and Built
Environment), 28(2).
NA, H. (2012). Potency of solar energy applications in
Indonesia. International Journal of Renewable Energy
Development, 1(2), 33-38.
Odeh, S. (2018). Thermal performance of dwellings with
rooftop pv panels and pv/thermal collectors. Energies,
11(7), 1879.
J., & Lu, L. (2013). Investigation on the development
potential of rooftop PV system in Hong Kong and its
environmental benefits. Renewable and Sustainable
Energy Reviews, 27, 149-162.
Rahmat, A., Prianto, E., & Sasongko, S. B. (2017). Study
of The Influence of Roof Covering Materials on
Thermal Conditions in the Roof. Jurnal Arsitektur
ARCADE, 1(1), 35-40.
Salamanca, F., Georgescu, M., Mahalov, A., Moustaoui,
M., & Martilli, A. (2016). Citywide impacts of cool
roof and rooftop solar photovoltaic deployment on
near-surface air temperature and cooling energy
demand. Boundary-Layer Meteorology, 161(1), 203-
221.
Selparia, E., Ginting, M., & Syech, R. Pembuatan Dan
Pengujian Alat Untuk Menentukan Konduktivitas Plat
Seng, Multiroof Dan Asbes. Riau University.
Septiadi, D., Nanlohy, P., Souissa, M., & Rumlawang, F.
Y. (2009). Proyeksi potensi energi surya sebagai energi
terbarukan (Studi wilayah Ambon dan sekitarnya).
Jurnal Meteorologi dan Geofisika, 10(1).
Syafii, S., Novizon, N., Wati, W., & Juliandri, D. (2018).
Feasibility Study of Rooftop Grid Connected PV
System for Peak Load Reduction. Proceeding of the
Electrical Engineering Computer Science and
Informatics, 5(5), 231-235.
Tarigan, E. (2018). Simulation and feasibility studies of
rooftop PV system for university campus buildings in
Surabaya, Indonesia. International Journal of
Renewable Energy Research, 8(2), 895-908.
iCAST-ES 2022 - International Conference on Applied Science and Technology on Engineering Science
776
