
Building Calibration Analysis Measure Ayung River Irrigation Area
Case Study of Kedewatan Dam
I Nyoman Anom PW, Made Mudhina, I Gusti Lanang Made Parwita, I Nyoman Sedana Trinadi
and Yuliana Sukarmawati
Department of Civil Engineering Bali State Polytechnic, South Kuta, Bali, Indonesia
Keywords: Measuring Building, Flow Coefficient, Calibration.
Abstract: Measuring building is a building that is very important in the accuracy of the distribution of irrigation water.
Through this building, the amount of debit given can be adjusted according to needs. The existence of a
measuring building in the Ayung River Irrigation Area in the Kedewatan Weir is more than 25 years old, but
it still functions as a measuring building that distributes water to the rice fields. The current problem is that
the flow rate formula does not take into account the flow coefficient because the cross-sectional shape of the
building has changed. Therefore it is necessary to calibrate to analyze the flow coefficient according to the
flow characteristics. This research was conducted using a comparison method between actual and theoretical
debits. The actual debit is obtained by measuring the debit directly. Based on the measurement results, it
shows that the current condition of the canal has undergone several changes due to sedimentation and changes
in the shape of the measuring structure so that the flow coefficient has changed.
1 INTRODUCTION
The provision of sufficient water to rice plants has the
effect of increasing agricultural production
significantly. The provision of water to rice plants is
given for approximately 70 days starting from the
planting period until before harvest with water needs
in Indonesia ranging from 1-2 liters/sec/Ha (Shock,
Barnum, and Seddigh 1998), (Lisa Guppy; Kelsey
Anderson; Mehta; P.; Nagabhatla;. 2017). The water
drainage system in the irrigation network is
distributed through intakes located on each weir,
while the flow from the int to the weir passes through
several channels ranging from primary, secondary,
and tertiary which are directly connected to farmers'
fields. Likewise, the flow of water from the weir to
the rice fields is equipped with several buildings
ranging from share buildings, tapping buildings,
plunge buildings as well as measuring buildings, and
other buildings (Ahmed 2020).
The existence of a measuring building in the
Ayung river irrigation area has the main function of
measuring the amount of water discharge released
from the channel to the rice fields. This measuring
building determines the amount of water that is in
accordance with the water needs of each plot of rice
terraces. As time goes by and the age of the measuring
building which is more than 25 years, the physical
condition of the building and the condition of the
channel flow upstream and downstream of the
measuring building have changed. The current
problem related to the measuring building is the
mismatch between the resulting discharge and the
flow formula used in the current measuring building.
This condition affects the accuracy of water
availability in the paddy fields which results in a
decrease in farmers' grain production. The basic
formula for the flow of water from the existing
measuring building does not take into account the
coefficient of flow either caused by the velocity of the
water or caused by the cross-sectional shape of the
building.
Given the problem with the inaccuracy of the
debit recording, it is necessary to carry out an analysis
to correct/calibrate the measuring building to obtain
the formula that is most appropriate to the current
condition of the measuring building. The results of
this calibration analysis are expected to have an effect
on the efficiency of drainage that can be carried out
in the entire Ayung river irrigation area.
Furthermore, the results of this calibration can be
used as guidelines in the implementation of water
supply operations throughout the Ayung river
582
Pw, I., Mudhina, M., Parwita, I., Trinadi, I. and Sukarmawati, Y.
Building Calibration Analysis Measure Ayung River Irrigation Area Case Study of Kedewatan Dam.
DOI: 10.5220/0011843300003575
In Proceedings of the 5th International Conference on Applied Science and Technology on Engineering Science (iCAST-ES 2022), pages 582-588
ISBN: 978-989-758-619-4; ISSN: 2975-8246
Copyright © 2023 by SCITEPRESS – Science and Technology Publications, Lda. Under CC license (CC BY-NC-ND 4.0)
irrigation area. Based on the background above, the
problems that can be conveyed are what is the current
condition of drainage and what is the flow formula
that should be in accordance with the current
condition of the building?
2 METHODS
2.1 Research Design
The research implementation is generally carried out
in the form of instantaneous discharge measurements
and calibration implementation. The instantaneous
discharge measurement is carried out by using the
one-point method into the water with several drains.
The determination of the number and width of the
drain is adjusted to the width of the existing channel
in the field. The density of the inter-pias point
determines the level of accuracy of the discharge
measurement, but in this study the width is satisfied
every 20 cm. Instantaneous discharge measurements
were carried out 10 times with different discharge
variations. While the calibration analysis is carried
out by determining the average coefficient value of
each measurement produced. From the 10 times the
flow coefficient, the trendline analysis was analyzed
to get the average flow coefficient value.
The research work steps are outlined in the form
of a research flow chart that describes the complete
stages from beginning to end sequentially to the end
with a duration of one year of research
2.2 Data Collection
The source of data for calibration activities is carried
out at the agency that is the goal in providing
calibration results, in this case the Bali Provincial
PUPR Service and other agencies that provide similar
data in the operational field of measuring buildings
for irrigation, namely the Bali Penida River council.
In conducting the survey, several activities were
carried out related to the current operating and
maintenance system for measuring buildings.
Searched data
a. Location of the building measure
b. Physical condition of the measuring building
c. Current flow formula
d. Building accuracy problems
e. The current measuring building OP system
manual
f. Policy of irrigation building management
system
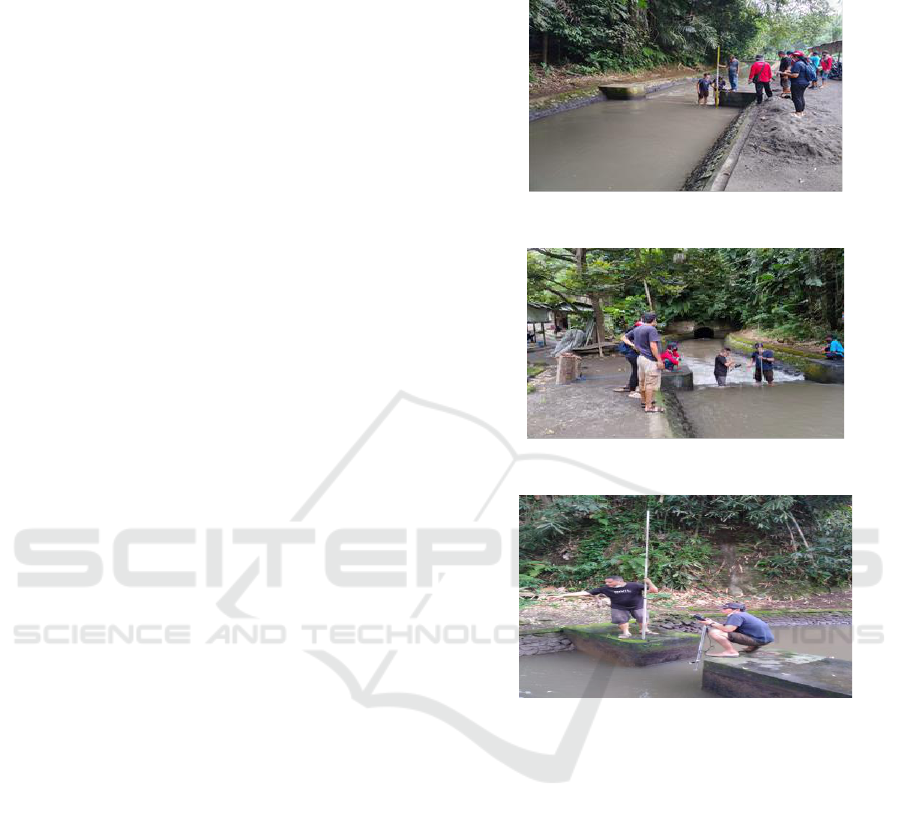
Pictures of the current condition of the building can
be seen in the figure 1.2 and 3.
Figure 1: BLG 1.
Figure 2: BLG 2.
Figure 3: BM 1A.
2.3 Necessary Equipment
The equipment needed to support calibration
activities consists of several equipment, namely:
1. Meter
The meter needed is a short 5 m meter and a 50 m
long meter. This meter is needed to measure the
dimensions of the measuring building as well as to
measure the depth of the water.
Building Calibration Analysis Measure Ayung River Irrigation Area Case Study of Kedewatan Dam
583
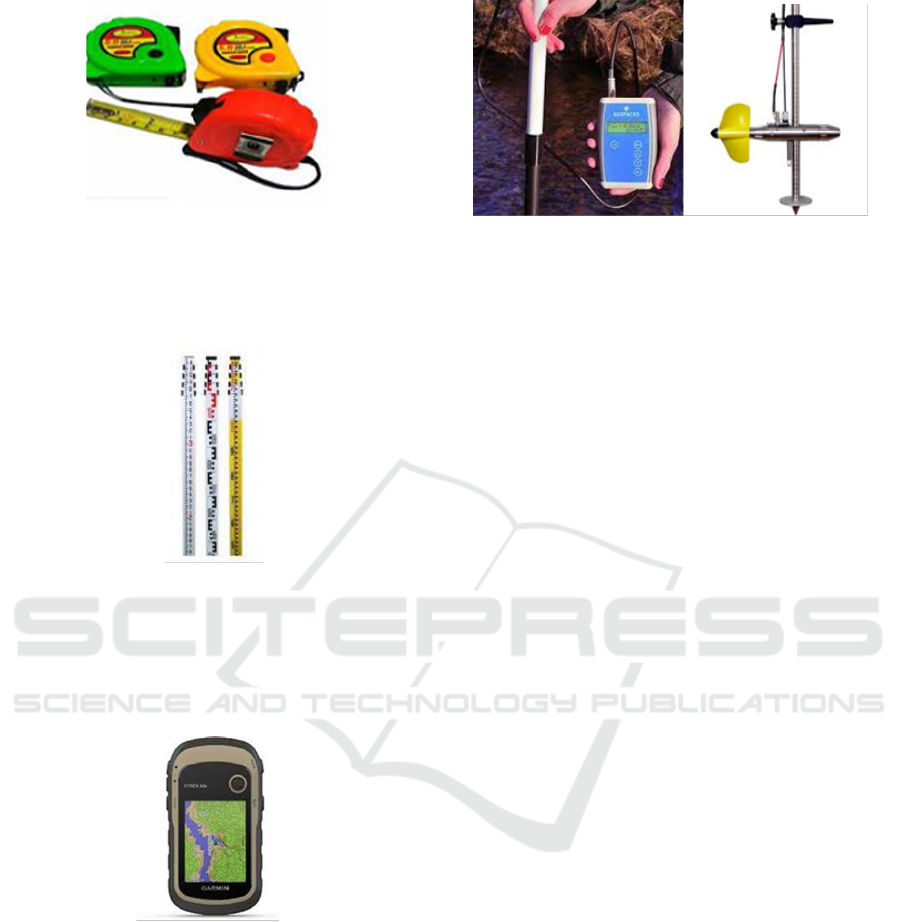
Figure 4: Meter (source: Onda).
2. Measuring sign
Measuring signs are needed to determine the water
depth in the measuring building.
Figure 5: Measuring sign (source: Indogeotech Darma).
3. Geographic Information System (GPS)/Mobile
GPS is a tool used to determine the geographical
position of measuring buildings in accordance with
existing coordinates.
Figure 6: GPS (Source: Garmin).
4. Survey Form
The survey form is a tool for recording depth and
water, the amount of water, weather information,
recording staff and special conditions in the field
when taking measurements.
5. Current Meter
The current meter is the main tool used to measure the
speed of water in meters/second.
Figure 7: Current meter (source: Seba Hydrometrie).
2.4 Calibration Stage
Calibration is an activity to test the current ar flow
formula by comparing the factual discharge with the
theoretical discharge (Shock, Barnum, and Seddigh
1998), (Asmiwyati et al. 2015), (Jaiswal et al. 2012),
(Kroc and Zumbo 2018), (Xu et al. 2021).
1. Instantaneous discharge measurement
Measurement of instantaneous discharge is a very
important activity to determine the amount of
discharge that exists at a certain time. At the time of
measurement can be done with the method of one
point, two points or three points according to the
depth of the water.
2. Flow coefficient value
The flow coefficient is sought to obtain the true
value of C by comparing the factual discharge with
the theoretical discharge. To obtain maximum results,
the instantaneous discharge data should be sought
with a longer or more duration (Collectives n.d.),
(Vermillion et al. 1999), (Akkuzu, Ünal, and Karataş
2007), (Badan standar Nasional Indonesia 1992)
3. Regression analysis
Regression analysis was carried out to obtain the
coefficient value that most closely matched the
distribution of the discharge measurements that had
been carried out (Armstrong 2012), ( et al. 2017)
4. Pairing with the old streaming formula
Pairing can be done when the actual discharge
data has been compared with the theoretical discharge
compared to the existing formula. From the formula
used today, it is compared with the formula obtained.
5. Calibration
Calibration is the final step to obtain the most
suitable C value after several tests. This calibration
number becomes a benchmark in determining the
actual value of C.
iCAST-ES 2022 - International Conference on Applied Science and Technology on Engineering Science
584
3 RESULTS AND DISCUSSION
3.1 Existing Condition of Building
Measure
There are six measuring buildings in the Kedewatan
dam which are spread over the irrigation network.
Kedewatan irrigation area Measurement Buildings
are located in six locations, namely in Kedewatan
Village BLG 1 (left), BLB 1 (right), BLK, BLM, BS1
and BS3 in Lambing Mambal Village. In general the
condition of the building is very well maintained and
can operate well. The problem in general is the
presence of sediment in the channel which affects the
flow. This sedimentation is caused by the remnants of
the downstream building that enter the channel which
causes disturbances upstream.
3.2 Instantaneous Discharge
Measurement
Instantaneous discharge measurement is carried out
to determine the amount of discharge that occurs
factually. This discharge measurement was carried
out repeatedly with 10 measurement trials. The
results of the instantaneous discharge measurements
in each building can be seen in Table 1 to Table 6.
3.3 Calibration
Calibration is carried out based on the results of the
calculation of the instantaneous discharge to obtain
the coefficient of flow (Cd) and the coefficient of
water velocity (Cv). Based on the values of Cd and
Cv, regression analysis was performed to determine
the distribution of Cd and Cv values compared to the
debit values.
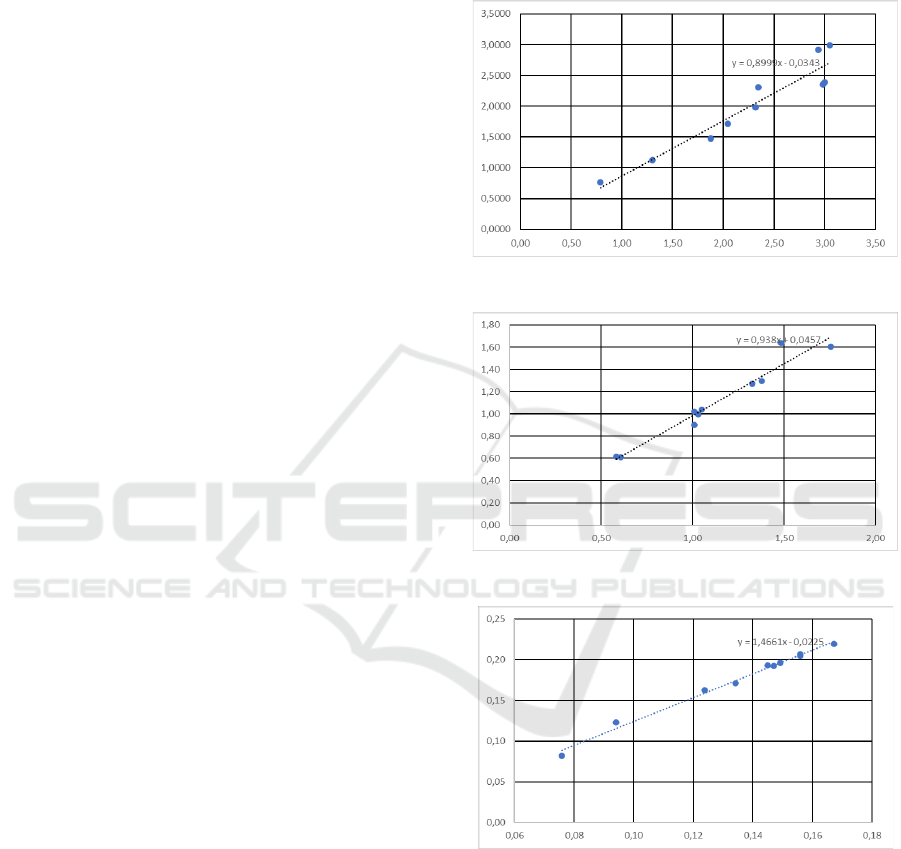
Regression analysis was conducted to determine the
relationship between discharge on the horizontal axis
with a value of 1.705 Bh
3/2
on the vertical axis. This
analysis provides equations and trendlines for all
existing relationships. With this regression analysis,
it can be seen the closeness of the distribution of the
data that we get during the 10 experiments carried
out. If inconsistent data is found, it must be re-
checked until a uniform distribution is obtained and
an equation can be drawn. Regression analysis is
shown in the figure 8-13. The coefficient analysis is
determined from two components, namely the result
of the shape of the building (Cd) and the effect of the
speed (Cv). Of the 10 times the experiment was
carried out, 1 value of Cd and Cv was obtained. Then
from the values of cd and cv that have been collected,
calibration analysis is carried out. The analysis of Cd
and Cv is shown in Table 1-6. Calibration Result
Recapitulation show in Table 7.
Figure 8: Regression analysis for BLG 1.
Figure 9: Regression analysis for BLB 1.
Figure 10: Regression analysis for BLK.
Building Calibration Analysis Measure Ayung River Irrigation Area Case Study of Kedewatan Dam
585
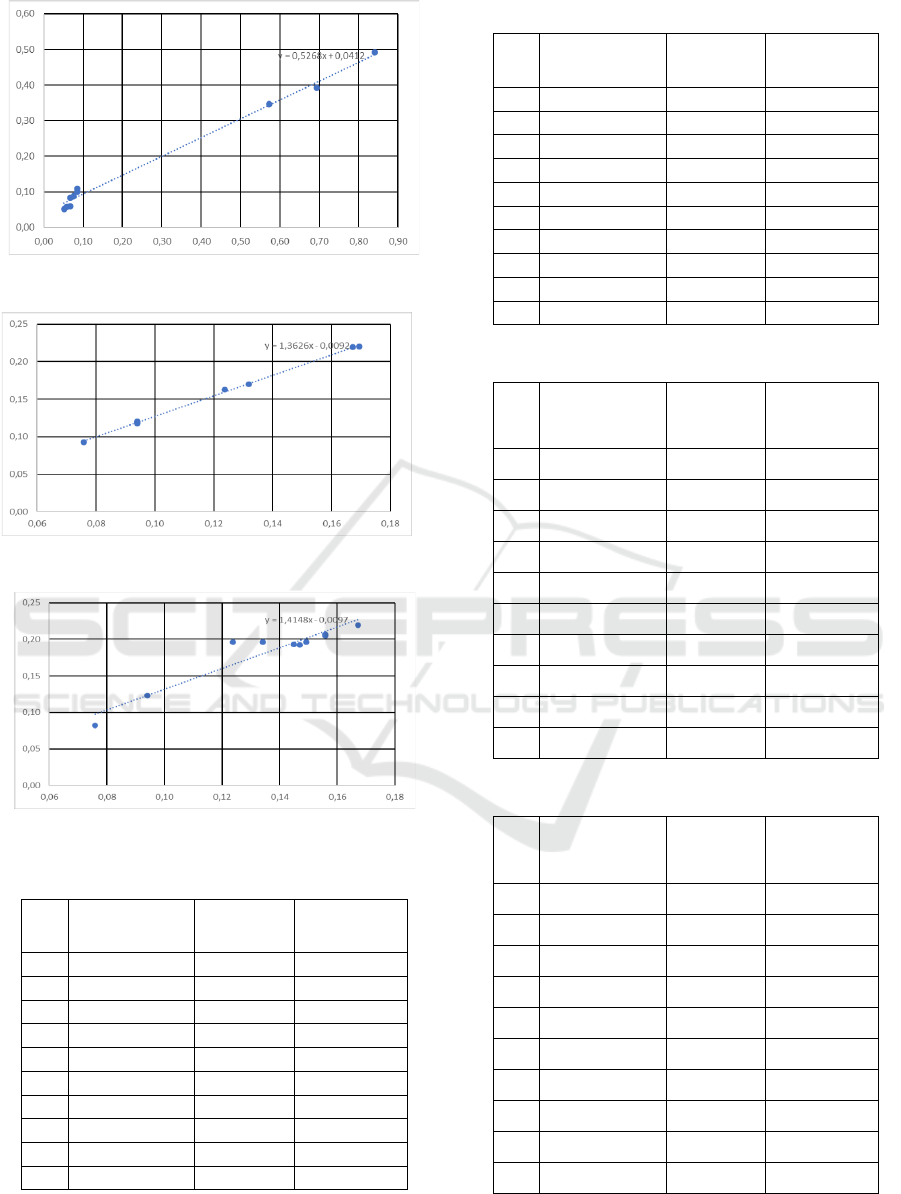
Figure 11: Regression analysis for BLM.
Figure 12: Regression analysis for BS1.
Figure 13: Regression analysis for BS3.
Table 1: Cd and Cv for BLG 1.
No
Experiment
Q
Cd, Cv
(m
3
/dt)
1
1
0.79
1.03
2
2
1.30
1.16
3
3
1.88
1.27
4
4
2.32
1.17
5
5
3.00
1.25
6
6
3.05
1.02
7
7
2.35
1.02
8
8
2.04
1.18
9
9
2.98
1.27
10
10
2.94
1.01
Table 2: Cd and Cv for BLB 1.
No
Experiment
Q
Cd, Cv
(m
3
/dt)
1
1
1.76
1.09
2
2
1.36
1.06
3
3
1.03
1.04
4
4
0.61
0.99
5
5
0,58
0.95
6
6
1.33
1.04
7
7
1.01
0.99
8
8
1.01
1.12
9
9
1.48
0.91
10
10
1.05
1.01
Table 3: Cd and Cv For BLK.
No
Experiment
Q
Cd, Cv
(m
3
/dt)
1
1
0.17
1.28
2
2
0.16
1.31
3
3
0.09
1.08
4
4
0.12
1.31
5
5
0.22
1.31
6
6
0.19
1.33
7
7
0.21
1.33
8
8
0.21
1.32
9
9
0.20
1.32
10
10
0.19
1.31
Table 4: Cd and Cv for BLM.
No
Experiment
Q
Cd, Cv
(m
3
/dt)
1
1
0.10
1.19
2
2
0.06
0.88
3
3
0.05
1.01
4
4
0.08
1.24
5
5
0.09
1.15
6
6
0.06
0.98
7
7
0.35
0.61
8
8
0.49
0,5900
9
9
0.39
0.57
10
10
0.11
1.28
iCAST-ES 2022 - International Conference on Applied Science and Technology on Engineering Science
586
Table 5: Cd and Cv for BS1.
No
Experiment
Q
Cd, Cv
(m
3
/dt)
1
1
0.17
1.29
2
2
0.16
1.31
3
3
0.09
1.22
4
4
0.12
1.28
5
5
0.22
1.31
6
6
0.22
1.30
7
7
0.12
1.27
8
8
0.12
1.28
9
9
0.12
1.25
10
10
0.12
1.25
Table 6: Cd and Cv For BS3.
No
Experiment
Q
Cd, Cv
(m
3
/dt)
1
1
0.19
1.46
2
2
0.19
1.59
3
3
0.08
1.08
4
4
0.12
1.31
5
5
0.22
1.31
6
6
0.19
1.33
7
7
0.21
1.33
8
8
0.21
1.32
9
9
0.20
1.32
10
10
0.19
1.31
Table 7: Calibration Result Recapitulation.
No
Name
Old Formula
New Formula
1
BLG 1
Q = 1,71 b h
1,5
Q = 1,53 b h
3/2
2
BLB 1
Q = 1,71 b h
1,5
Q = 1,60 b h
3/2
3
BLK
Q = 1,71 b h
1,5
Q = 1,26 b h
3/2
4
BLM
Q = 1,71 b h
1,5
Q = 0,9 b h
3/2
5
BS 1
Q = 1,71 b h
1,5
Q = 2,31 b h
3/2
6
BS 3
Q = 1,71 b h
1,5
Q = 2,40 b h
3/2
4 CONCLUSSION
Based on the results of measurements that have been
carried out in the field, it shows that the current
condition of the drainage has undergone several
changes due to sediment and changes in the shape of
the measuring building. In more detail, the following
conclusions can be drawn:
1. The flow has been using the flow formula with the
same formula, namely Q = 1.705 B H
3/2
while the
measurement results show that there is a
coefficient of C whose value varies as the
influence of the speed and shape of the building.
The formula obtained from the measurement
results Q = 1.705 C B H
3/2
2. Based on the calibration results, a new formula is
obtained from the flow with the following
formula: BLG 1A has the formula Q = 1.53 b h
3/2
,
BLB 1a has the formula Q = 1.60 b h
3/2
, BM 1a =
Q = 0.9 b h
3/2
, BLK has the formula Q = 1.26 b
h
3/2
, BS 1 has the formula Q = 2.31 b h
3/2
, BS 3
has the formula Q = 2.40 b h
3/2
, BLK 2 has the
formula = Q = 2, 51 b h
1,5
, the overflow formula
is 0.17 B H
3/2
ACKNOWLEDGMENTS
Thank you to the water engineering team and the Bali
State Polytechnic and the Bali Provincial Public
Works Department for all their help and guidance
REFERENCES
Ahmed, Bayan. 2020. “Characterization And Redesigning
Of Mada Batu Small Scale Irrigation Scheme West Arsi
Zone Of Oromia Region International Journal of
Engineering Research-Online.” 8(3).
Akkuzu, Erhan, Halil Baki Ünal, and Bekir Sitki Karataş.
2007. “Determination of Water Conveyance Loss in the
Menemen Open Canal Irrigation Network.” Turkish
Journal of Agriculture and Forestry 31(1): 11–22.
Armstrong, J. Scott. 2012. “Illusions in Regression
Analysis.” SSRN Electronic Journal (July 2012).
Asmiwyati, I Gusti Agung Ayu Rai, Made Sudiana
Mahendra, Nurhayati Hadi Susilo Arifin, and Tomohiro
Ichinose. 2015. “Recognizing Indigenous Knowledge
on Agricultural Landscape in Bali for Micro Climate
and Environment Control.” Procedia Environmental
Sciences 28(SustaiN 2014): 623–29.
http://dx.doi.org/10.1016/j.proenv.2015.07.073.
Aviral Gupta, Akshay Sharma, and Dr. Amita Goel. 2017.
“Review of Regression Analysis Models.”
Building Calibration Analysis Measure Ayung River Irrigation Area Case Study of Kedewatan Dam
587

International Journal of Engineering Research and
V6(08): 58–61.
Badan standar Nasional Indonesia. 1992. “SNI Metode
Pengukuran Debit Sungai Dan Saluran Terbuka
Dengan Pelampung Permukaan.”
Collectives, Recherches. Calibration of Acoustic
Instruments.
Jaiswal, Shiv Kumar, Sanjay Yadav, A. K.
Bandyopadhyay, and Ravinder Agarwal. 2012. “Global
Water Flow Measurement and Calibration Facilities:
Review of Methods and Instrumentations.” Mapan -
Journal of Metrology Society of India 27(2): 63–76.
Kroc, Edward, and Bruno D. Zumbo. 2018. “Calibration of
Measurements.” Journal of Modern Applied Statistical
Methods 17(2).
Lisa Guppy; kelsey Anderson; Mehta; P.; Nagabhatla; N.
and, and Qadir; M. 2017. “Global Water Crisis : The
Facts.” : 1–3. http://inweh.unu.edu.
Shock, Clinton C, J Michael Barnum, and Majid Seddigh.
1998. “Calibration of Watermark Soil Moisture Sensors
for Irrigation Management.” Proceedings of the
International Irrigation Show (September): 139–46.
https://www.researchgate.net/publication/228762944.
Vermillion, Douglas L et al. 1999. An Assessment of the
Small-Scale Irrigation Management Turnover Program
in Indonesia.
Xu, Hu, Zhenhua Wang, Wenhao Li, and Qiuliang Wang.
2021. “Assessment of Water Measurements in an
Irrigation Canal System Based on Experimental Data
and the CFD Model.” Water (Switzerland) 13(21).
iCAST-ES 2022 - International Conference on Applied Science and Technology on Engineering Science
588
