
Detection and Classification Rice Plant Quality Through
UAV Imagery Using Yolo V5 Algorithm
Adi Suheryadu, A. Sumarudin, Alifia Puspaningrum and Renold N. K. Natasasmita
Politenik Negeri Indramayu, Jalan Raya Lohbener lama no 08, Indramayu, Jawa Barat, Indonesia
Keywords: Artificial Intelligence, Smart Farming, UAV Imagery, YOLO Algorithm, Rice Plants, Detection and
Classification Object.
Abstract: Smart farming is an important technology in supporting agriculture 4.0. Farmers can solve some problems by
utilizing this smart farm, including monitoring crops in agricultural areas. The large area of agricultural land
owned by farmers makes it difficult for farmers to monitor the quality of rice crops on their land. In
overcoming this problem, an intelligent system is needed to detect the quality level of rice crops and classify
them appropriately, and the scope of detection is broad. By detecting and classifying rice plants using one of
the artificial intelligence methods, namely YOLO, farmers can find out the quality of their rice plants through
images taken using UAVs. For this YOLO algorithm to detect the quality level of rice plants from each field,
datasets taken through aerial imagery or drone technology are needed, these datasets will be used to train
models to detect the quality level of rice plants. The YOLO algorithm can see the quality level of rice crops
based on the point of interest in the image uploaded by the farmer to the server. Images processed using the
YOLO algorithm produce output from bounding boxes and confidence scores for each detected object. The
yield of mAP@0.5 (mean average precision) was 93.69%.
1 INTRODUCTION
The industrial revolution is developing until now. The
technology is used to facilitate human activities to be
more effective and efficient by automating and
optimizing surveillance and production processes
(Hudson, P. 2014) The development of technology
also has an impact on the agricultural sector. The
result of agricultural technology is expected to help
increase agricultural output to meet the food demand
of around 10 billion people by 2050, as stated by the
World Resources Institutes (WRI) in 2018 (Ayaz, M.
Ammad-Uddin 2018).
Indonesia is one of the world's largest agricultural
countries, with a harvested area of agricultural land,
especially rice, reaching around 10.41 million
hectares, with rice production in 2021 of 54.42
million tons of GKG. If converted into rice, rice
production in 2021 will get about 31.36 million tons
(Badan Pusat Statistik, Luas Panen dan Produksi Padi
di Indonesia 2021). In addition, some Indonesians
have a livelihood as farmers or grow crops. The
agricultural sector is vital in improving the economy
and meeting food needs because paying attention to
its quality is necessary. Technology with the proper
methods to obtain product quality and build
sustainability in the agricultural sector is needed
(Lakshmi, V., & Corbett, J. 2020).
The increasing need for agricultural products with
better environmental quality protection has
encouraged the birth of smart farming with the term
Agriculture 4.0. The idea of Agriculture 4.0 attracted
the attention of agricultural actors in supporting the
development of modern agriculture combined with
digital information technology, mainly supported by
big data, mobile internet, and cloud computing. Some
of the technologies developed, including Unmanned
Aerial Vehicles (UAV) (Radoglou-Grammatikis,
2020), the use of Computer Vision (CV), and the
continuous improvement of Artificial Intelligence
(AI) (Kashyap, Anand. 2021), have undergone severe
improvements to new quality standards (Siniosoglou,
2020).
Combining UAV technology and deep learning
has provided information that has not been possible
so far, such as crop quality status, soil type, and
disease/pest attacks, among others (Bouguettaya,
2022). Precise and automated classification of plants
using UAV-based remote sensing imagery and deep
learning techniques have been widely used to perform
crop quality monitoring. Gao et al. (Gao, Z., Luo, Z.,
Suheryadu, A., Sumarudin, A., Puspaningrum, A. and Natasasmita, R.
Detection and Classification Rice Plant Quality Through UAV Imagery Using Yolo V5 Algorithm.
DOI: 10.5220/0011843200003575
In Proceedings of the 5th International Conference on Applied Science and Technology on Engineering Science (iCAST-ES 2022), pages 577-581
ISBN: 978-989-758-619-4; ISSN: 2975-8246
Copyright © 2023 by SCITEPRESS – Science and Technology Publications, Lda. Under CC license (CC BY-NC-ND 4.0)
577
2020) reviewed the latest deep learning-based
computer vision algorithms for detecting plant stress.
Nguyen Cao Tri et al. (Tri, N. C., Hoai, 2016)
proposed using CNN and unmanned aerial vehicles
(UAVs) to assess the quality of rice fields. The UAV
is responsible for taking pictures of rice fields at low
or very low altitudes. Then, the neural network will
process these high-resolution images to produce low-
quality and high-quality classifications of the rice
fields. The accuracy result they got was about 72%.
Then in the study (i, N. C., Duong, H. N., 2017), we
proposed an approach using DNN, a UAV, to assess
rice field yields. They used UAVs to collect high-
resolution imagery of rice fields from low altitudes.
Then, DNN is used to classify images for evaluating
rice field yields.
In this study, we will create a classification model
to obtain rice quality information as an effort to
monitor using YOLO v5 Deep learning.
2 COMPARISON METHOD
The classification algorithm used in this study is
YOLO V5 by includes inputs of Mosaic data,
enhancement, adaptive anchor, calculation, and
adaptive image scaling. The technology used in the
'Backbone' consists of the Focus structure and CSP
(Common Spatial Pattern) structure with techniques in
the 'Neck' section, including the FPN + PAN structure;
YOLO v5 is less capable than its predecessor YOLOv4
in terms of performance, but it is much more flexible
and faster than YOLOv4, so it has an advantage in the
use of its model. Yang et al. (Yang, D., Cui, Y., 2021).
YOLO accepts an input image divided into a grid
of S x S and sent to a neural network to create a
bounding box and prediction class. Each grid cell
predicts the bounding box and confidence score of
each box. This confidence score reflects how
confident the model has that the object in the box is
predicted. YOLO rates confidence as Pr (Object) *
IOU truth (Intersection of Union). Most previous
detection systems used a classifier or localizer to
perform the detection by applying the model to the
image in multiple locations and assigning confidence
to the image as a material for detection. YOLO uses
a different approach to the previous algorithm:
applying a single neural network to the entire image.
This network will divide the image into regions and
then predict the bounding box and probability, for
each bounding region box weighed its probability of
classifying as an object or not.
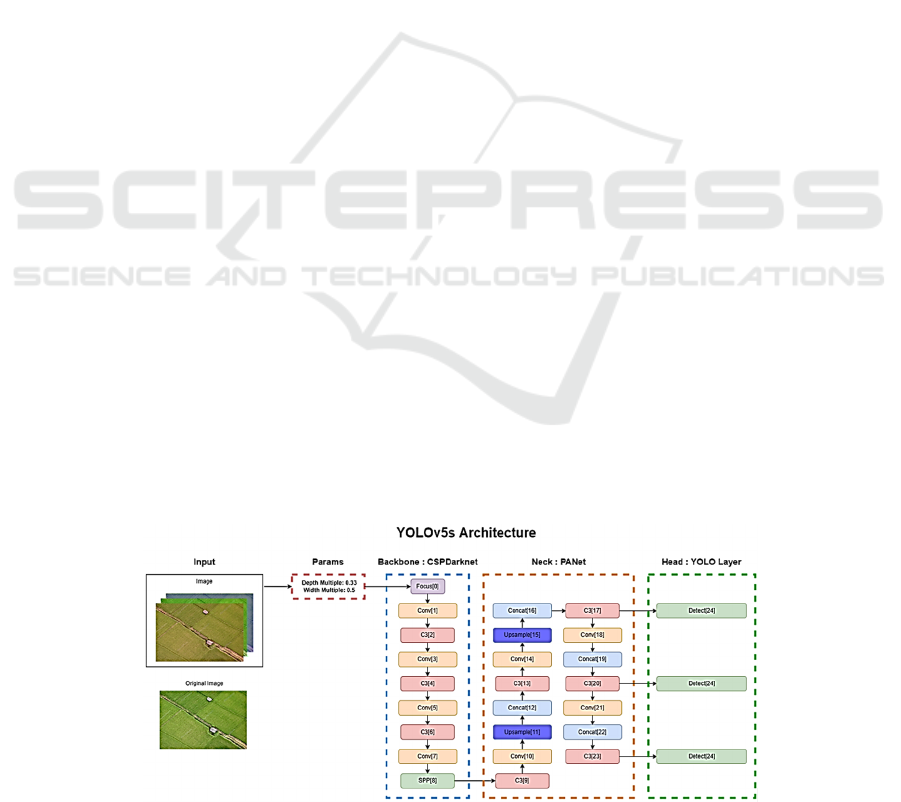
YOLOv5 has three important parts, namely
Backbone, Neck, and Head. The Backbone model on
YOLOv5 includes CSP (Cross Stage Partial
Networks), which extract informative features from
input images. CSP showed a significant improvement
in processing time with deeper networks. In the
Backbone process, the image will be extracted using
CSPNet, storing important information from the image
while reducing complex models. The next layer is the
Neck model used to generate the feature pyramid.
Pyramid features help the model to identify the
same object with different sizes and scales in a way
that is well generalized in scaling its objects. Feature
pyramids are very useful, and help models work on
invisible data, YOLO v5 uses PANet to obtain or
generate feature pyramids. In the Neck process of
information generated by the backbone, the Neck is
used to create helpful information at each feature
level that will spread directly to the sub-network. The
Head of the Output model is used to perform a part of
the final detection; this model applies boxes,
accuracy, and classes to the objects detected in the
image. Model Head will produce three different layer
sizes to achieve multi-scale detection; multi-scale
detection will ensure that the model can keep up with
the size changes. Next, the layer will generate
predictions such as class, accuracy and bounding box
(Muhammad, M. A., & Mulyani, Y., 2021). The
architecture of YOLOv5s is shown in figure 1.
Figure 1: YOLOv5s Architecture.
iCAST-ES 2022 - International Conference on Applied Science and Technology on Engineering Science
578
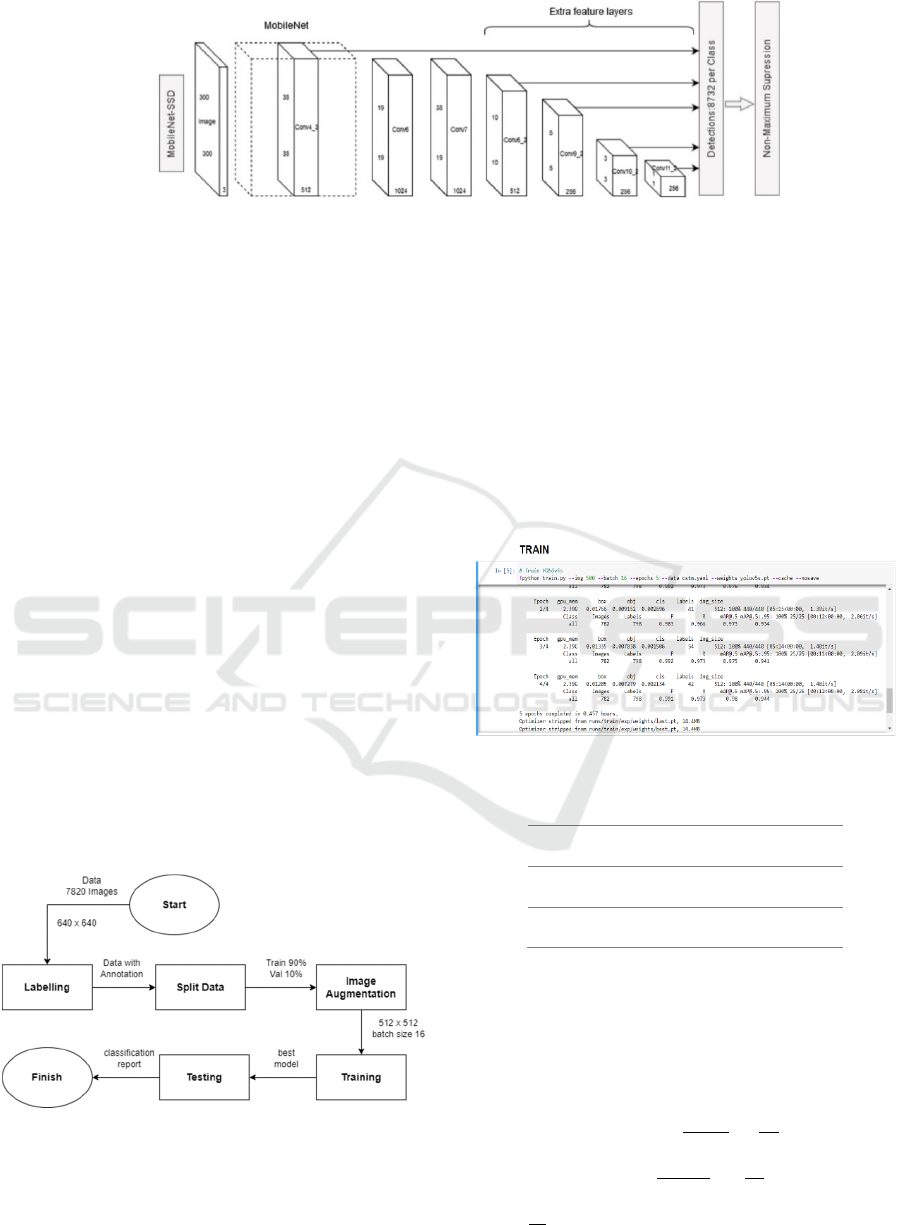
Figure 2: SSDMobileNetV2 Architecture.
This study was also tested using the
SSDMobileNetV2 architecture designated in figure 2.
This architecture consists of an SSD that acts as a base
model and MobileNet as a Network Model. The SSD
will set up object detection by creating a bounding
box. MobileNet will work to extract features that will
later be classified. The merging of SSD and
Mobilenet will help in the process of creating an
object detection application. An object detection
application takes an SSD to create an image
localization to determine the object’s position.
Meanwhile, Mobilenet will be needed to help classify
objects contained in an image. The classification will
result in categories for each object, namely Good and
Bad.
3 RESULT AND DISCUSSION
The rice plant data used as a training dataset consists
of two labels Healthy and Unhealthy label contains
3.610 images with a size of 640 x 640 pixels, and the
Unhealthy label contains 4.210 images with a size of
640 x 640 pixels. The data is an image of a rice plant
taken through aerial or drone imagery (Anuar
Marzhar. 2021).
Figure 3: Process Diagram.
The flow diagram is processed to create a deep
learning model, as shown in figure 3. Starting with
labelling, the dataset is given a bounding box and
annotations or labels at this stage. The following
process is splitting data or dividing data into train
folders and validation with a ratio of 9 to 1 or 90% to
10% as shown in table 1. Then Image Augmentation
or known as image augmentation, image
augmentation is a process of modifying data to
become another shape, such as the size that was
originally 640 x 640 to 512 x 512. The training
process aims to train the model to be used to detect;
the training process produces two models, namely,
last and best weights. The last stage is testing; testing
is carried out to see how high the accuracy is, the
model that has been trained against the new data.
Figure 4: Training Implementation.
Table 1: Training Data.
Data Training
90% 7038
Data Validation
10% 782
Total Data
100% 7820
The measurement matrices used in this study are
Precision, Recall, mAP@0.5, mAP@.5:.95, detection
time and file size of each model. The confusion
matrix can be used to determine precision and recall.
To determine the precision, you can use the equation
below (Hidayatullah, P., 2021).
precision
(1)
recall
(2)
AP
xAP
0 AP
0,1. . . AP
1,0 (3)
Detection and Classification Rice Plant Quality Through UAV Imagery Using Yolo V5 Algorithm
579
mAP
∑
(4)
where TP is true positive, FP is false positive, FN is
false negative, AP is Average Precision and mAP is
Mean Average Precision.
The training process on the first model was
completed within 0.457 hours with quite good results,
with a Precision value of about 0.991, Recall around
0.973, mAP@0.5 around 0.979 and mAP@0.5:0.95
around 0.944. And the second model using SSD was
completed within 0,25 hours, with a Precision of
about 0,850, Recall of about 0,907, mAP@0,5 about
0,946, and mAP@0,5:0.95 of about 0,851. The
hyperparameter settings used are shown in table 2.
Table 2: Hyperparameter setting.
Parameter Value
lr0 0.01
lrf 0.01
Momentum 0.937
weight_decay 0.0005
warmup_epochs 3.0
warmup_momentum 0.8
warmup_bias_lr 0.1
Box 0.05
Cls 0.5
cls_pw 1.0
Obj 1.0
obj_pw 1.0
iou_t 0.2
anchor_t 4.0
hsv_h 0.015
hsv_s 0.7
hsv_v 0.4
Translate 0.1
Scale 0.5
Fliplr 0.5
mosaic 1.0
The dataset for testing was taken directly from
farms located in Indonesia part of the districts of
Majalengka, Cirebon and Indramayu, there are about
100 data with 111 bounding boxes in the picture,
including 40 pictures of rice fields with healthy
quality labels with 47 bounding boxes and 60 images
of rice fields with unhealthy quality labels with 64
bounding boxes taken using drone technology. This
test aims to select the best model to be used or
implemented. The tests in this study will compare two
models, namely the results of yolov5s training and
SSDMobileNetV2. The resulting output is Precision,
Recall, mAP@0.5, mAP@.5:.95. The result of
comparison testing is shown in table 3 and figure 5.
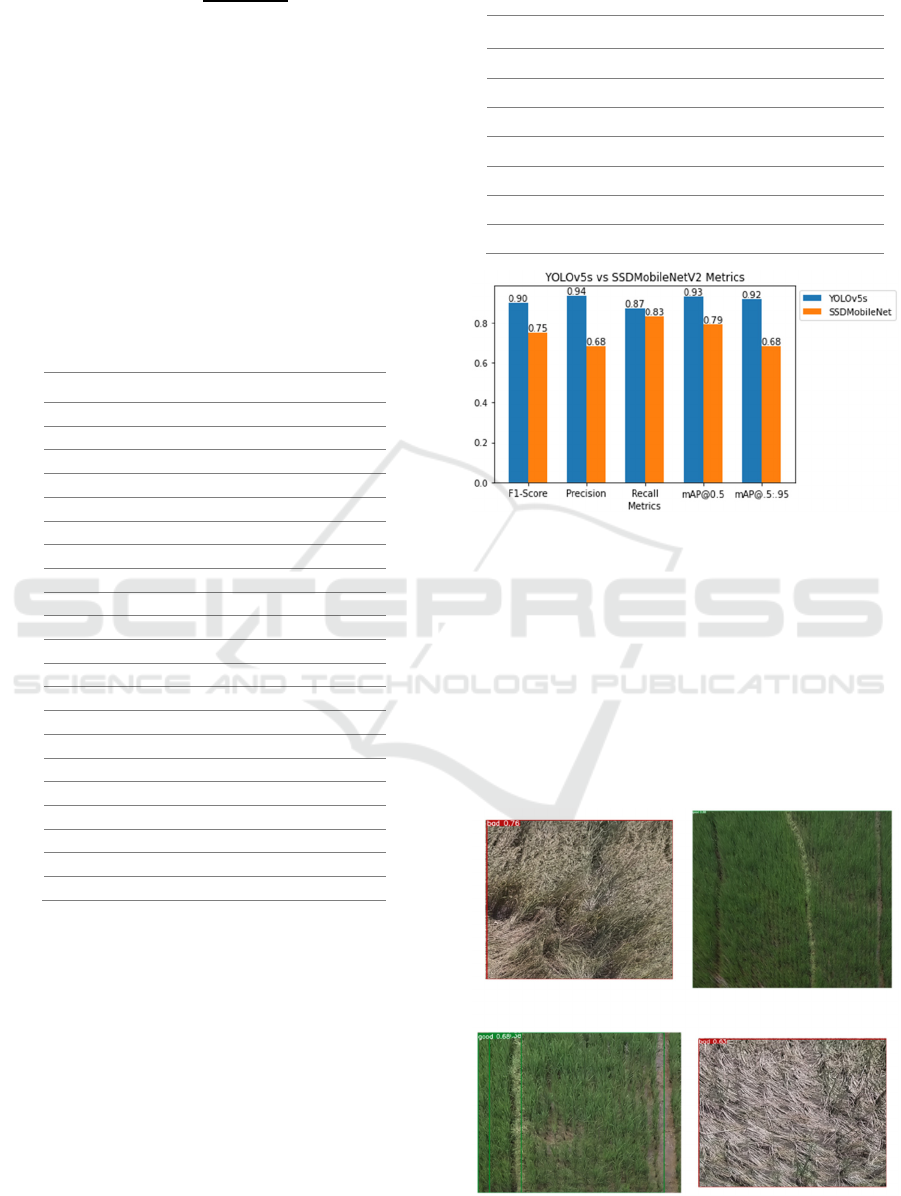
Table 3: Result Testing.
Metrics YOLOv5s SSDMobileNetV2
F1-Score
0,90 0,750
Precision
0,936 0,683
Recall
0,87 0,832
mAP@0.5
0,93 0,790
mAP@.5:.95
0,916 0,683
time
0,063s 0,144s
Size model
14,4Mb 18,4Mb
Figure 5: YOLOv5s vs SSDMobileNetV2 Metrics.
From the results of the test above, YOLOv5s
is relatively better and can work faster than
the SSDMobileNetV2 and the detection time and file
size of the model are also smaller. YOLOv5s have
advantages in F1-Score, Precision, Recall and mAP
(mean average precision) values. This means that
the resulting FPS will be much higher, and
the computation time will also be relatively faster.
The example result of the classification is shown in
figure 6.
Figure 6: Result of Classification.
iCAST-ES 2022 - International Conference on Applied Science and Technology on Engineering Science
580

4 CONCLUSIONS
The detection system for the quality level of rice
plants built using the YOLOv5s Algorithm when
compared to SSDs gets relatively quite good results.
From the training time, the SSD is almost 50% faster,
but when the model has been formed and the testing
process is carried out, the results obtained by YOLO
are more detectable. The system can detect two
quality labels based on training results using the
dataset that has been collected. The accuracy results
(mAP@0.5) obtained using the YOLOv5 model were
0.9369.
REFERENCES
T. S. Ashton, P. Hudson, The industrial revolution, 1760-
1830, Oxford University Press, Oxford, 1997
Ayaz, M.; Ammad-Uddin, M.; Sharif, Z.; Mansour, A.;
Aggoune, E.H.M. Internet-of-Things (IoT)-Based
Smart Agriculture: Toward Making the Fields Talk.
IEEE Access 2019, 7, 129551–129583.
Lakshmi, V., & Corbett, J. (2020). How artificial
intelligence improves agricultural productivity and
sustainability: A global thematic analysis.
Radoglou-Grammatikis, P.; Sarigiannidis, P.; Lagkas, T.;
Moscholios, I. A compilation of UAV applications for
precision agriculture. Comput. Netw. 2020, 172,
107148.
Kashyap, P.K.; Kumar, S.; Jaiswal, A.; Prasad, M.;
Gandomi, A.H. Towards Precision Agriculture: IoT-
Enabled Intelligent Irrigation Systems Using Deep
Learning Neural Network. IEEE Sens. J. 2021, 21,
17479–17491.
Anand, T.; Sinha, S.; Mandal, M.; Chamola, V.; Yu, F.R.
AgriSegNet: Deep Aerial Semantic Segmentation
Framework for IoT-Assisted Precision Agriculture.
IEEE Sens. J. 2021, 21, 17581–17590.
Siniosoglou, I.; Argyriou, V.; Bibi, S.; Lagkas, T.;
Sarigiannidis, P. Unsupervised Ethical Equity
Evaluation of Adversarial Federated Networks. In
Proceedings of the 16th International Conference on
Availability, Reliability and Security, Vienna, Austria,
17–20 August 2021; Association for Computing
Machinery: New York, NY, USA, 2021.
Badan Pusat Statistik, Luas Panen dan Produksi Padi di
Indonesia 2021. 05100.2203. 2022-07-12
Bouguettaya, A., Zarzour, H., Kechida, A., & Taberkit, A.
M. (2022). Deep learning techniques to classify
agricultural crops through UAV imagery: a review.
Neural Computing and Applications, 1-26.
Gao, Z., Luo, Z., Zhang, W., Lv, Z., & Xu, Y. (2020). Deep
learning application in plant stress imaging: a review.
AgriEngineering, 2(3), 29.
Tri, N. C., Hoai, T. V., Duong, H. N., Trong, N. T., Vinh,
V. V., & Snasel, V. (2016, December). A novel
framework based on deep learning and unmanned aerial
vehicles to assess the quality of rice fields. In
International Conference on Advances in Information
and Communication Technology (pp. 84-93). Springer,
Cham.
Tri, N. C., Duong, H. N., Van Hoai, T., Van Hoa, T.,
Nguyen, V. H., Toan, N. T., & Snasel, V. (2017,
October). A novel approach based on deep learning
techniques and UAVs to yield assessment of paddy
fields. In 2017 9th International Conference on
Knowledge and Systems Engineering (KSE) (pp. 257-
262). IEEE.
Yang, D., Cui, Y., Yu, Z., & Yuan, H. (2021). Deep
learning based steel pipe weld defect detection. Applied
Artificial Intelligence, 35(15), 1237-1249.
Muhammad, M. A., & Mulyani, Y. (2021, October).
Library Attendance System using YOLOv5 Faces
Recognition. In 2021 International Conference on
Converging Technology in Electrical and Information
Engineering (ICCTEIE) (pp. 68-72). IEEE.
Anuar Marzhar, “Paddy Field Health”. kaggle.com.
https://www.kaggle.com/datasets/marzharanuar/paddy
-field-health. (accessed oct 3, 2022).
Hidayatullah, P (2021). Buku Sakti Deep Learning
Computer Vision Menggunakan YOLO untuk Pemula.
Detection and Classification Rice Plant Quality Through UAV Imagery Using Yolo V5 Algorithm
581
