
Research on Quantitative Investment Strategy of Stock Index Futures
Based on XGBoost Model
Hongxin Zhu and Anmin Zhu
College of Software Engineering, Shenzhen University, Shenzhen University, Nanshan District, Shenzhen, China
Keywords: XGBoost Model, Stock Index Futures Prediction, Quantitative Investment.
Abstract: In the past two decades, China’s economy has been developing continuously. The emergence of various
emerging industries has continuously introduced more value choices to the financial market, which has also
made the stock market more volatile. People have been studying and predicting the stock market for a long
time, hoping to find the rule of stock price fluctuations. It is believed that similar stock price fluctuations will
occur in the previous performance of stock price fluctuations at a certain time in the future, therefore
improving the accuracy of stock forecasts. In this paper, the prediction of the CSI 300 Index Futures is studied
based on the XGBoost model. It designs a quantitative investment strategy to trade the CSI 300 Index Futures
based on the prediction, to study the accuracy of the XGBoost model applied to financial market forecasts.
1 INTRODUCTION
As of August 2021, there are already more than 4,000
stocks in the Chinese stock market. At the same time,
the types of data provided by the exchanges are
constantly enriching, and the frequency of data
updates is constantly increasing. At present, the
monthly market data of the A-share market has
exceeded 1000G. In the A-share market, most private
investors invest in stocks through personal intuition,
experience, or policy analysis. But because of the lack
of scientific basis, there are great risks. Quantitative
investment can make trading strategies more
scientific and more systematic so that it can reduce
investment risks. It analyses historical data through
mathematical models to replace human subjective
judgments and obtains the investment portfolio that
obtains excess returns on the largest probability field.
Quantitative investment is to replace human
subjective judgments with mathematical models. It
uses data analysis technology to calculate the
investment portfolio that can obtain excess returns
from a large amount of historical data. In the 1970s,
quantitative investment began to develop in the US.
By the end of the third quarter of 2019, the scale of
quantitative hedge funds in the United States had
reached 1 trillion dollars. Well-known quantitative
investment companies such as Bridgewater,
Renaissance, and AQR Capital Management had
exceeded 60 billion dollars and obtained generous
returns for investors. In China, three major stock
index futures were launched in 2010 and the national
policy allowed private equity funds to participate in
the capital market in a more legal capacity in 2013,
which promoted the development of quantitative
investment in China. 2010 to 2015 is the golden
period of quantitative investment in the domestic
development. The scale of quantitative investment
has reached the level of ten billion RMB. After 2015,
due to the stock market turbulence, stock index
futures discounts and the failure of traditional
quantitative models, quantitative investment entered
a low ebb in 2016 and 2017. But after 2018, with the
maturity of the market and the promotion of relevant
policies on stock index futures, China's quantitative
investment has begun a new round of rapid growth.
By 2021, China's quantitative investment
management scale has exceeded 500 billion yuan.
Financial derivatives are constantly being enriched
and improved, market mechanisms are constantly
being optimized, and market transaction volume and
volatility are constantly being enlarged. There is still
broad room for development in China's quantitative
investment industry.
The technologies of machine learning and deep
learning are constantly developing. Applying them in
the financial field has played an important role in
promoting the development of quantitative
investment. SVM is a data mining method developed
Zhu, H. and Zhu, A.
Research on Quantitative Investment Strategy of Stock Index Futures Based on XGBoost Model.
DOI: 10.5220/0011825700003612
In Proceedings of the 3rd International Symposium on Automation, Information and Computing (ISAIC 2022), pages 31-36
ISBN: 978-989-758-622-4; ISSN: 2975-9463
Copyright
c
2023 by SCITEPRESS – Science and Technology Publications, Lda. Under CC license (CC BY-NC-ND 4.0)
31

from statistical theory, which is suitable for solving
small-sample, nonlinear and high-dimensional
pattern recognition problems (Li & Wang, 2018).
Machine learning was applied in the domestic
financial field 10 years ago. Wang Dong used the
SVM model and BP neural network to predict the
SSE 50 Index (Wang, 2007). The result shows that
the deviation of the SVM model is smaller than that
of the BP model and it has a higher direction
prediction accuracy. Until now, scholars have been
exploring and strengthening the application of
machine learning to stock forecasting. In the research
on the short-term stock price prediction of 10 stocks
using the SVM model with the RBF kernel function
(Liu et al., 2020), it was found that the prediction
model based on the support vector machine has
higher accuracy and better prediction effect than the
original prediction algorithm.
The XGBoost model is a machine learning model
proposed by Chen Tianqi (Chen & Guestrin, 2016). It
is a decision tree algorithm proposed based on the
idea of boosting, which has the advantages of fast
training speed, high training accuracy, and not easy to
overfit. Many scholars apply the XGBoost model to
the financial field to test whether the model can
achieve better results. Li Xiang (Li, 2017) applies the
XGBoost model to quantitative stock selection. The
research results show that the designed quantitative
stock selection program can outperform the market
return, and the total return of the selected stock
portfolio is 287%. In comparing the prediction effects
of neural network, SVM, and XGBoost models on 1-
minute high-frequency financial data (Huang & Xie,
2018), they selected CSI 300 stock index future as the
research data. It found that the predictive ability of the
XGBoost model is better than the traditional neural
network and SVM model. In the study of applying
XGBoost model to stock selection strategy (Li &
Zhang, 2019), it constructs a dynamic weighted
multi-factor stock selection strategy. The result
indicate that the model can improve the performance
of multi-factor stock selection strategies. Yan Wang
and Yuankai Guo (Wang & Guo, 2020) proposed the
DWT-ARIMA GSXGB hybrid model, which made
improvements on the XGBoost model. They found
that compared with the original model, the model has
better approximation ability and generalization
ability in stock price prediction. Yang Yang (Yang,
2021) proposed a predictive model of stock trading
behaviour selection and hyperparameter optimization
based on XGBoost model. Research has found that it
can effectively analyse attributes of different
dimensions and predict stock prices.
Stock index futures play an important role in risk
hedging in investment strategies. It has the
characteristics of hedging, value discovery and
investment arbitrage. The CSI 300 Index covers a
wide range. Its price changes are mainly affected by
systemic risks, so it is easier to predict than stocks.
Changes in stock index prices play an important
guiding role in the investment of individual stocks
and futures. Therefore, it is of great practical
significance to make accurate judgments on the rise
and fall of stock indexes. This paper will use the
XGBoost model to predict the rise and fall of the CSI
300 Index Futures prices. Then, according to the
forecast results, an investment strategy is constructed
to trade the main CSI 300 contracts. In the design of
price fluctuation prediction, the price fluctuation
judgment is designed into three situations, namely
"rising", "falling", and "fluctuating", rather than just
judging price rises and falls. Then, through empirical
testing, it studies the prediction effect of the XGBoost
model on the three types of price fluctuations of the
CSI 300 Index Futures and the profitability of the
constructed investment strategy.
The structure of this article is as follows. Chapter
One is Introduction. It briefly describes the research
background and status of applying machine learning
to the financial field, as well as the main research
content and structural arrangement of this paper. The
second chapter mainly introduces the relevant
theories of the XGBoost model. Chapter 3 describes
the construction and optimization of the model and
explains the investment strategy designed. The fourth
chapter uses historical data to train the model and
empirically test the model in the actual financial
market, and analyses the experimental results. The
fifth chapter summarizes this paper.
2 XGBoost MODEL
The XGBoost model is based on the idea that all base
classifiers of the Boosting algorithm are connected.
Each split of the tree in the model will generate a new
tree in the direction of the negative gradient of the
previous training. After training, the sum of all tree
scores is taken as the sample prediction value. The
goal of the algorithm is to have a considerable
generalization ability while the error of the
algorithm's predicted value is small. Because the
XGBoost model is based on the engineering of the
GBDT decision tree algorithm, it is also an additive
model composed of multiple decision trees. When
each leaf node of the tree is split, the model
enumerates all different tree structures. It uses a
ISAIC 2022 - International Symposium on Automation, Information and Computing
32
scoring function to find an optimal structure of the
tree and adds it to the model, which uses a greedy
algorithm to repeat this process. When traversing all
the feature points, in order to limit the depth of the
tree, the model adds a threshold. The leaf nodes are
split only when the gain is greater than the threshold.
In order to prevent over-fitting, the model adds a
regular term to the objective function. The objective
function of the XGBoost model is as follows:
𝑂𝑏𝑗
𝑙𝑦
, 𝑦
Ω
𝑓
𝐶
(1)
𝑦
𝑦
𝑓
𝑥
(2)
𝑓
𝑇
1
2
‖
𝑤
‖
(3)
In formula (1), 𝑙is the loss function,
𝑓
is
the regular term function, where
is the
hyperparameter, and 𝑇 is the total number of leaf
nodes.
‖
𝑤
‖
is the L2 regular term, where 𝑤 is
the weight of the leaf node. Penalizing leaf nodes with
larger weights through the L2 regular term can reduce
the occurrence of over-fitting. 𝐶 is a constant term.
Unlike the GBDT model, the XGBoost model
uses Taylor's second-order expansion, which is more
conducive to the speed and accuracy of gradient
descent. The formula of the XGBoost model after
Taylor's second-order expansion is as follows:
𝑂𝑏𝑗
𝑙
𝑦
,𝑦
𝑔
𝑓
𝑥
1
2
ℎ
𝑓
𝑥
𝑓
𝐶
(4)
𝑔
𝐿𝑦
,𝑦
𝑦
(5)
ℎ
𝐿𝑦
,𝑦
𝑦
(6)
When the tree is split according to the objective
function, the model cannot be split endlessly. So the
maximum depth of the tree and the sample weight
threshold need to be set in the model. When the
maximum depth is exceeded or when the sum of the
sample weights is less than the set threshold, the
splitting of the tree needs to be stopped to prevent
overfitting.
3 MODEL BUILDING
3.1 Feature Engineering
Because the research is to predict the rise, fall and
flutuation of the CSI 300 Index Futures. According to
the momentum effect, that is, the stock return tends to
continue the original direction of movement, the
research selects the momentum factor as the leading
technical indicator as the input feature. The research
selected 15 input features, namely, opening price
(open), highest price (high), lowest price (low),
closing price (close), trading volume (volume),
Moving Average Convergence and Divergence
(macd), logarithmic rate of return (logreturn),
amplitude (diffreturn), William index (lwr1, lwr2),
differential Value (dif), means of similarities and
slow smooth moving average (dea), moving average
indicator (ma, mar10, mar50). The model training
data has 1500 trading days of the CSI 300 Index
Futures trading data. In order to test the effectiveness
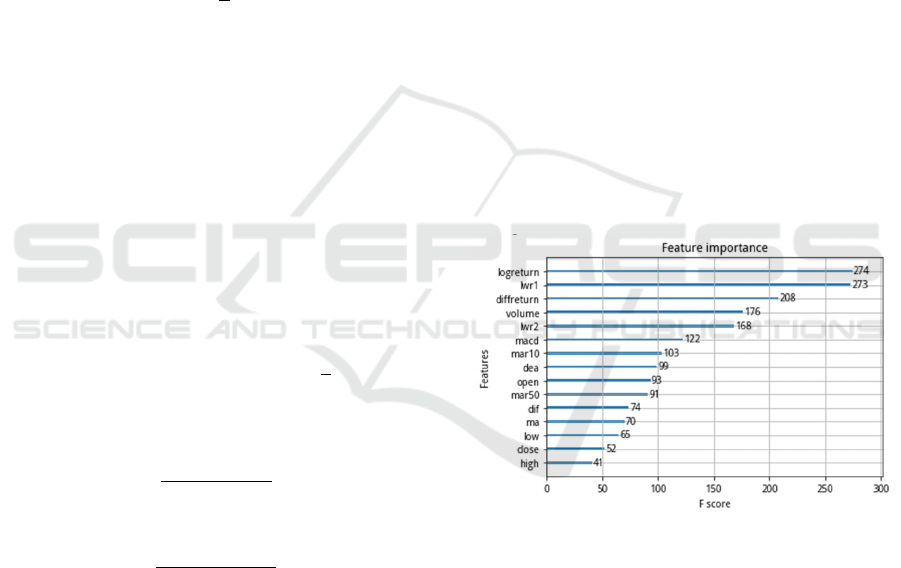
of the feature vector, this paper uses the XGBoost
model to calculate the information gain of the initial
feature vector, which is used to express the
importance of each feature value. The result is shown
in Figure 1.
Figure 1: Feature Importance.
Among them, the greater the information gain of
the feature, the stronger the classification ability. It
can be seen from the figure that each feature vector
has a certain degree of contribution to the model。
This guarantees the validity of each feature vector.
The most important thing in the process of
building a model is to learn the relationship between
the training sample set and the label. The appropriate
label is related to the effect and direction of the model
learning. Since this article designs three types of price
change trends: "rising", "falling" and "fluctuating",
the labels of stock index rise and fall should also be
Research on Quantitative Investment Strategy of Stock Index Futures Based on XGBoost Model
33
designed into three. Table 1 illustrates the logic of the
label design.
Table 1: Interpretation table of the label.
Label Condition
+1
𝑚𝑎5
𝑚𝑎5
0
and 𝑃
𝑃
0
-1
𝑚𝑎5
𝑚𝑎5
0
and 𝑃
𝑃
0
0 othe
r
When today’s 5-day moving average is greater
than yesterday’s 5-day moving average, and today’s
price is greater than yesterday’s closing price, it
means a rising situation. Then the y label is recorded
as "+1". When today’s 5-day moving average is
smaller than yesterday’s 5-day moving average, and
today’s price is lower than yesterday’s closing price,
it means a falling situation. Then the y label is
recorded as "-1". Other conditions are price
fluctuations, and the y label is recorded as "0".
Finally, the XGBoost model is used to learn the
correlation between the input vector and the results of
the CSI 300 Stock Index to study the accuracy of the
model’s prediction of the stock index and the return
of the quantitative investment strategy based on the
XGBoost model.
3.2 Model Optimization
Different combinations of model parameters will
have different effects on the results of the model. In
order to find the optimal combination of parameters,
this paper adopts a grid search to optimize the model
so that the model can obtain the highest rate of return.
For the parameters of the XGBoost model, four key
parameters, the number of iterations (n_estimators),
learning rate (learning_rate), maximum tree depth
(max_depth), and gamma were selected for tuning in
this paper. The specific method is to specify the
number of iterations parameter candidate sequence as
[30,50,100,150,300,400], the learning rate parameter
candidate sequence as [0.01,0.05,0.1,0.3,0.5], and the
maximum tree depth parameter candidate sequence as
[ 4,5,6,7,8], specify the gamma parameter candidate
sequence as [0.1,0.2,0.3,0.4], and then use the grid
search method to select the most suitable parameter
from each parameter candidate sequence for the
model to use.
3.3 Model Optimization
After constructing a prediction model based on the
XGBoost model, this paper will use the model to
predict the price fluctuation trend of the CSI 300
Index Futures. Then it combines the prediction results
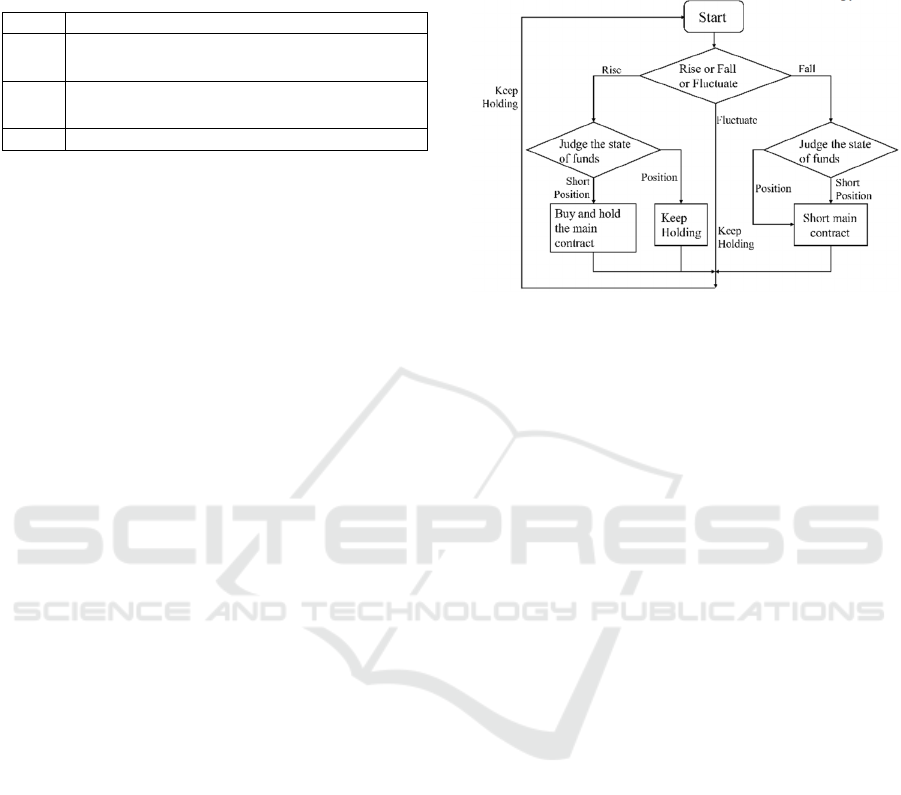
of the model to design investment strategies. Figure 2
shows the framework of the investment strategy.
Figure 2: Investment strategy framework.
The main idea of the investment strategy is to
judge the position status when the forecast result is
that the price change trend of the next trading day is
rising. If the position is short, it will buy the nearest
CSI 300 main contract, and if the position is open, it
will keep the position unchanged. When the forecast
result is that the price change trend of the next trading
day is down, it will judge the position status. If the
position is open, it will close the position. If it is a
short position, it will perform short selling. The rest
is that if the price trend of the next trading day
fluctuates, the position will continue to be
maintained. In order to keep up with the market trend,
the model makes daily judgments and conducts
transactions based on investment strategies. Since this
investment strategy is to verify the actual effect of the
forecasting model, there is no division processing in
the investment strategy.
4 EMPIRICAL TEST
All the data in this article comes from the Jukuan
quantitative trading platform, and the investment
strategy backtest is carried out on this platform. In
this range, the market returns not only rise and fall,
but also have more volatility. It can effectively test
whether the XGBoost model can judge different stock
index trends and show the return of quantified
investment strategies based on the XGBoost model.
This chapter shows the strategy backtest graph based
on the XGBoost model and the strategy backtest
graph after optimizing model parameters using grid
search.
ISAIC 2022 - International Symposium on Automation, Information and Computing
34
4.1 Strategic Performance
This article uses historical data for backtesting on the
JoinQuant quantitative trading platform. This article
uses historical data for backtesting on the Jukuan
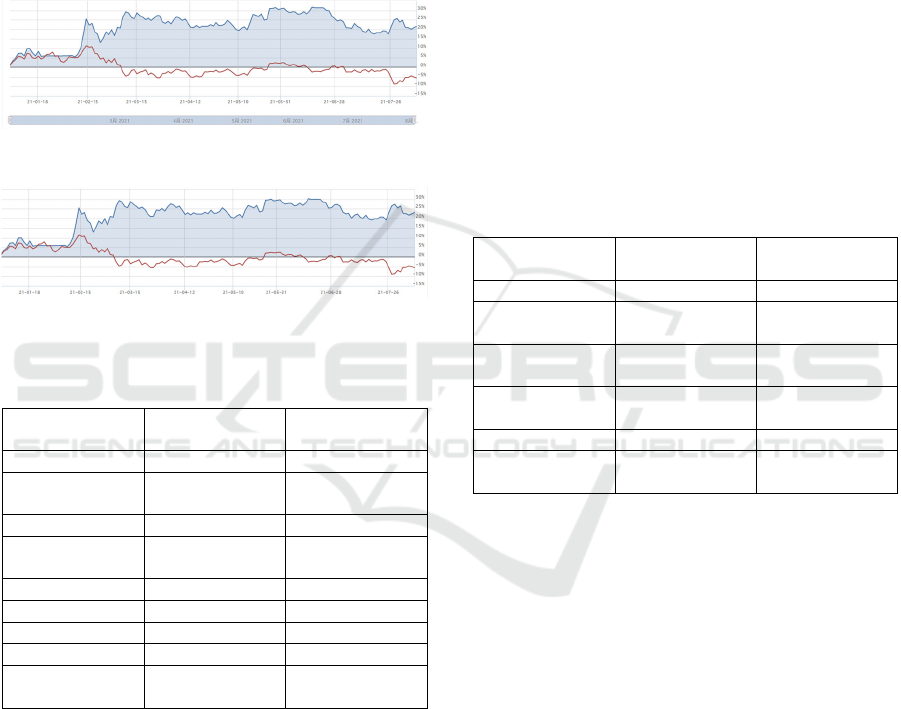
quantitative trading platform. Figure 3 and Figure 4
show the investment strategy return graphs obtained
by the experimental model in the real market. The
blue line represents the return of the strategy, and the
red line represents the benchmark return of the
market.
Figure 3: Original model backtesting result.
Figure 4: Backtesting result after optimization.
Table 2: Comparison of strategy backtesting results of
before optimization and after optimization.
Before
O
p
timization
Optimized
Return 21.61% 23.21%
Annualized
Rate of Return
40.11% 43.32%
Excess Return 28.76% 30.47%
Benchmark
Rate of return
-5.56% -5.56%
Al
p
ha 0.385 0.419
Beta 0.181 0.192
Sharpe 1.326 1.455
Winning Rate 0.250 0.222
Maximum
Drawdown Rate
9.86% 9.86%
From Figure 3 and Table 2, it can be seen that the
cumulative return of the strategy after grid search
optimization is 23.21%, which is higher than the
benchmark return. The annualized rate of return is
43.32%, the Alpha value is 0.419, the Beta value is
0.192, the Sharpe ratio is 1.455, and the maximum
drawdown rate is 9.86%. It can be seen that the return
of strategy can effectively lead the benchmark return
of the market. This shows that the XGBoost model is
accurate in predicting the ups and downs and
volatility trends of stock indexes. However,
considering that when designing an investment
strategy, the stock index price was always held when
the stock index price fluctuated, which resulted in the
stock index futures not making buying and selling
operations during the small fluctuations during the
fluctuations. So the rate of return remains at a leading
position of about 20%. However, the model can still
effectively predict and carry out buying and selling
operations in the case of large rises and falls, and
obtain high profits. Therefore, in general, the
quantitative investment strategy of stock index
futures based on the XGBoost model is effective.
The original XGBoost model has accurately
predicted a large increase and decrease. The
parameter combination optimized by grid search has
brought an overall improvement to the prediction
result. The parameter comparison before and after
optimization is shown in Table 3.
Table 3: Comparison of model parameter settings before
and after optimization.
Parameter
Before
O
p
timization
Optimized
Learning Rate 0.05 0.3
Iteration
(
n
_
estimatiors
)
400 100
Maximum
Depth
4 8
Minimum Child
Weight
5 1
Gamma 0.1 0.1
Experiment
Time
344s 172s
Due to the reduction in the number of iterations,
the backtest time has also been largely optimized. The
backtest time is reduced to half of the original model.
4.2 Result Analysis
The XGBoost model can be effectively applied to the
forecast of the target price in the financial market. It
performs well in predicting the future trend of the CSI
300 Index Futures. The investment strategy
constructed based on the three stock price fluctuations
(rising, falling, and flutuating) established based on
price fluctuation forecasts is also effective. However,
holding futures contracts when stock prices fluctuate
in the stock index futures market will have an impact
on earnings. After optimizing the parameters, the
prediction performance of the XGBoost model has
also been improved, and the backtest time has been
greatly improved. It is of great significance in the
second-level trading operation process in the current
financial market.
Research on Quantitative Investment Strategy of Stock Index Futures Based on XGBoost Model
35

5 CONCLUSION
As one of the popular directions of artificial
intelligence, machine learning has made great
achievements in speech recognition, text mining, and
autonomous driving. How to apply machine learning
in the field of financial investment is also a problem
that the industry and academia have been actively
exploring in recent years. This paper applies the
XGBoost model to the CSI 300 Index Futures. It
forecasts and builds a quantitative investment
strategy based on the forecast to test the model. Data
such as the opening price, trading volume and
logarithmic rate of return can be used as input
variables to effectively predict the future trend of the
CSI 300 Index Futures. Moreover, the CSI 300 Index
is designed to have three states as "rising", "falling"
and "fluctuating", which is more suitable to the
fluctuation of the CSI 300 Index. Finally, the excess
return is obtained through the investment strategy
test. The effectiveness of machine learning in the field
of financial asset price prediction is proved. By
optimizing the parameters of the XGBoost model, the
prediction performance of the model can be improved
to a certain extent. Therefore, the strategy can obtain
higher returns.
The XGBoost model uses the first and second
derivatives in the process of optimizing the loss
function, and adds a regular term to control the
overfitting problem, which improves the prediction
accuracy of the model. This method can also be used
to construct investment strategies in combination
with the selection of stock factors or be applied to
more financial investment fields.
ACKNOWLEDGEMENTS
This work was partly supported by the Natural
Science Foundation of China (61273354) and
Shenzhen stability support program for university
(20200812112522002).
REFERENCES
Chen, T., & Guestrin, C. (2016). XGBoost: A Scalable Tree
Boosting System. Proceedings of the 22nd ACM
SIGKDD International Conference on Knowledge
Discovery and Data Mining, Association for
Computing Machinery, New York, USA, 785–794.
Huang, Q., & Xie, H. (2018). Research on the Application
of Machine Learning Methods in Stock Index Futures
Forecasting--Comparative Analysis Based on BP
Neural Network, SVM and XGBoost. Practice and
Understanding of Mathematics, 48(08), 297-307. (in
Chinese)
Li, H., & Wang, H. (2018). Stock Index Prediction Model
Based on Improved Fractal Interpolation and SVM
Model. Journal of Jishou University (Natural Science
Edition), 39(03), 14-19. (in Chinese)
Li, J., & Zhang, R. (2019). Dynamic Weighting Multi
Factor Stock Selection Strategy Based on XGboost
Machine Learning Algorithm. Proceedings of 2018
IEEE International Conference of Safety Produce
Informatization, IICSPI 2018 2018 IEEE International
Conference of Safety Produce Informatization, IICSPI
2018, December 10, 2018 - December 12, 2018,
Chongqing, China.
Li, X. (2017). Design of Multi-factor Quantitative Stock
Selection Based on XGBoost Algorithm, Unpublished
master’s thesis, Shanghai Normal University. (in
Chinese)
Liu, Z., Dang, Z., & Yu, J. (2020). Stock price prediction
model based on RBF-SVM algorithm.Proceedings -
2020 International Conference on Computer
Engineering and Intelligent Control, ICCEIC 2020
2020 International Conference on Computer
Engineering and Intelligent Control, ICCEIC 2020,
November 6, 2020 - November 8, 2020, Virtual,
Chongqing, China.
Wang, D. (2007). Research on Timing and Stock Selection
Based on Support Vector Machine. Unpublished
doctoral disseration, Shanghai Jiaotong University.
Wang, Y., & Guo, Y. (2020). Forecasting Method of Stock
Market Volatility in Time Series Data Based on Mixed
Model of ARIMA and XGBoost. Chinese
Communications, 17(03), 205-221. (in Chinese)
Yang, Y. (2021). Market Forecast using XGboost and
Hyperparameters Optimized by TPE.2021 IEEE
International Conference on Artificial Intelligence and
Industrial Design, AIID 2021 2021 IEEE International
Conference on Artificial Intelligence and Industrial
Design, AIID 2021, May 28, 2021 - May 30, 2021,
Virtual, Guangzhou, China.
ISAIC 2022 - International Symposium on Automation, Information and Computing
36
