
A New Method in Performance Test of Electric Vehicle Battery
Using Water Rheostat
I Wayan Jondra
1a
, I Gusti Agung Made Sunaya
1
, I Gusti Putu Arka
1
, I Gusti Ketut Abasana
1
and I Wayan Sudiarsa
2
1
Electrical Department, Politeknik Negeri Bali, Jalan Kampus Bukit Jimbaran, Kabupaten Badung, Indonesia
2
Computer System Department, Institut Bisnis dan Teknologi Indonesia,
Jl. Tukad Pakerisan No. 97 Denpasar, Bali, Indonesia
Keywords: Water, Resistance, Load.
Abstract: Nowadays, the electric vehicles uses is increased, both for private and public transportation. The electric
vehicles increasing is supported by the battery technology innovation. A reliable, inexpensive and large
capacity of the battery are created but less attend to battery instrument to review the real battery performance.
This paper are discussion a new method in performance test of electric vehicle battery using water rheostat
to review the real battery performance. The water rheostat are consist of two set aluminum electrode plate.
To increase the current discharge value is done by added water to soak the electrode plate. The data logger
collected the voltage, and discharge current of times. The data analysis indicated this water rheostat dummy
load have a good performance to instrumented the battery performance. The finding of this paper is: 1. The
discharge current are inversely proportional with the battery terminal voltage. 2. On the discharge current
value is 2.17 Ampere in voltage 83.64 volt, the water resistivity is 2,698.06 Ohm-meters and than go down
to 73.87 Ohm-meters on the voltage value 46.00 Volt and the discharge current 43.53 Ampere. 3. The
discharge current a inversely with the area of electrode. 4. The water resistivity are linear function to the
resistance of water rheostat. 5. Water rheostat with two sets of electrodes dimensions of 35 x 36 centimeters
can be use as a dummy load of up to 2.3 KW in a voltage of 66 Volt DC.
1 INTRODUCTION
Nowadays, the use of electric vehicles is growing,
both for private and public transportation. The
electric vehicles using is in line to the Bali State
Polytechnic as a centre of excellence for green
tourism technology. Electric vehicles are chosen at
this time because they do not cause noise pollution,
low operating costs, and light vehicles (Srinivas,
2019). The growth in the use of electric vehicles
contributes to pollution reduction, cost efficiency,
reducing road damage due to lighter electric vehicles
(Sudjoko,2021). The very worrying pollution caused
by the vehicles age and engine combustion system
has a strong correlation in producing CO and HC
values (Dinda et al., 2020). Electric vehicles would
reduces air pollution like nitric oxide (Daniel et al.,
2021; Ernani F. at al., 2020)
a
https://orcid.org/0000-0001-6800-6415
Pollution remains unresolved even though efforts
have been made to utilize the radiator heat as a heat
source to heat the combustion system (Wiryanta,
2019). The electric vihicle must growing, the electric
vehicles growth is supported by the growing of cheap
design of batteries, so that the price is cheap, large
capacity and long life (Michael et.al, 2018). Various
shapes, types and capacities of batteries are made by
industry. The dimensions of the battery are smaller
but with greater capacity. To support the performance
of electric vehicle batteries, smart charging has been
designed to improve battery performance (Bowen,
2019). The greater battery capacity, affect to the
longer times to use the battery for the same load.
There are also a lot of batteries sold in retail, so
technicians can assemble custom batteries as needed.
Vehicle battery customized can be done in terms of
shape and capacity requirements.
Jondra, I., Sunaya, I., Arka, I., Abasana, I. and Sudiarsa, I.
A New Method in Performance Test of Electric Vehicle Battery Using Water Rheostat.
DOI: 10.5220/0011759500003575
In Proceedings of the 5th International Conference on Applied Science and Technology on Engineering Science (iCAST-ES 2022), pages 271-277
ISBN: 978-989-758-619-4; ISSN: 2975-8246
Copyright © 2023 by SCITEPRESS – Science and Technology Publications, Lda. Under CC license (CC BY-NC-ND 4.0)
271

The electric vehicles growing, has been supported
by the construction of charging centers also (Zhuk A
and Buzoverov E, 2018). The inventions of design
and control batteries charging gave rise to
increasingly sophisticated charging stations. The
current sophistication of charging stations makes it
easy for electric vehicle users to recharge their
batteries. Ease is felt in the ease of connection without
having to open the battery. The sophistication of the
charging station is also evidenced by the shorter
charging time of the battery for the same capacity.
The sophistication of the charging station is also
supported by the sophistication of the control battery
management system (BMS) which can control the
condition of the battery carefully and smartly because
through a bluetooth device the battery condition
status can be monitored remotely from a smart phone.
Industries and researchers, while that instrument is
very important to guarantee the quality of batteries,
because the battery has come from various factories.
Battery is also to many much implemented for solar
power generation (Wirajati et al., 2021) . The Dummy
Load as described in this paper is a solution to get a
battery capacity test instrument.
2 RESEARCH METHOD
2.1 Research Approach and Concept
This research was designed as a quantitative approach
study to find the design of a water rheostat, which can
be used as an artificial load in testing battery quality.
This water rheostat is designed by utilizing the
resistivity of water to soak two positive and negative
electrode plates.
The concept of this research is applied research,
by applying the basic law of Ohm's law and the
resistance formula, into a water rheostat, the area of
this resistor is largely determined by the area of the
electrode plate and the limit distance from the
electrode plate, to solve the problem of the absence of
a battery test instrument with inexpensive but large
capacity. The wider the plate electrode affect to
decreasing the resistance value, this ratio is in line to
the conductor, the wider area of the conductor affect
to the smaller of the resistance value. Likewise, the
smaller the distance between the negative plate and
the positive plate affect to the decreasing the
resistance value, this is in line with the conductor, the
shorter of the conductor affect to the smaller of the
resistance value. The small resistance of the water
rheostat will be a big load for the battery, the parallel
connection of several electrodes decreases resistance
value.
2.2 Total Sample
This research was conducted with a sample of water
rheostat, the collection was carried out with a total of
20 data for each indicator. To take the 20 of data is
done by regulated the water level from zero to
maximum and measured the value of voltage and
current flow to the water rheostat.
2.3 Variable Operational Definition
The focus of this study to observing the magnitude
of the variable of this research, that are : The first
independent variable is the area of the electrode that
is soak in the water, and the second is the time of
testing. Meanwhile, the first dependent variable is the
discharge current of the battery increases caused by
the increased the area of the electrode soak in water,
and the second dependent variable is the voltage are
decreases caused by the increases of discharge current
of the battery. Voltage is amount in volt of potential
test voltage between two terminal of the battery. The
current is amount in ampere of electron flow to the
electrode. The area of the electrode in square meters
is obtained by measuring the depth of the water
multiplied by the width of the electrode plate
multiplied by the number of electrodes inserted into
the water.
2.4 Data Analysis
Data obtained from the test results are processed
quantitatively. Data is processed mathematically and
statistically by finding the data variation on the step
by step the water level. The data are processed
mathematically to obtain the voltage and current
discharge at the initial of the test, and finally when the
water box is fully, the test is stop. The output
mathematically data is processed trough statistically
to obtain the average data, data sequence, which is
also displayed graphically.
3 WATER RESISTIVITY
All of materials have electrical properties
characteristic, such as resistivity, likewise water has
resistivity properties. The resistivity of water causes
an low electric flow current in the water even though
that it is not as smooth as an electric current flowed
in gold or copper. This water resistance property can
iCAST-ES 2022 - International Conference on Applied Science and Technology on Engineering Science
272
be utilized for low resistors with large power
capacities.
The resistivity of water used in low voltage power
machinery and other heavy equipment laboratories,
there is a universal need for a compact, rugged, yet
flexible and continuously variable rheostat (Engle,
1952). This water rheostat are available for so many
applications as: dc motor starting, dc and ac single
and 3-phase loading, wound-rotor induction motor
speed control. Water rheostat like balanced 3-phase
load, that is equivalent delta AC circuit, water
rheostat which also may be used in DC and AC
single-phase circuits. The untreated city tap water that
has an average resistivity of 4,600 ohms per inch cube
at 20° Centigrade, and for a single rheostat unit will
dissipate up to 75 kw (Engle, 1952). The resistivity of
water is strongly influenced by the substances
contained. Water with a higher salt content will have
a lower resistivity. The low resistivity of this water
can be used to make a water rheostat with a higher
capacity.
Water rheostat has the potential as an dummy load
with a very large capacity if a large capacity water
reservoir is provided. to increase the capacity can be
done by expanding the electrodes used, increasing the
volume of water. Because the water resistance (R) is
strongly influenced by the resistivity of water (𝜌, the
area of the electrode (A) and the distance between the
electrodes(𝑙, which can be explained by the formula
below.
𝑅
𝜌. 𝑙
A
(1)
Based on formula (1) above, it can be explained
that to get a low resistance (R) of the water rheostat,
it can be done by expanding the surface area of the
water (A) in contact with the electrode surface. On the
other hand, to get a higher resistance (R) of the water
rheostat, it can be done by narrowing the surface area
of the water (A) in contact with the electrode surface.
While Ohm's law states that voltage (V) is strongly
influenced by current (I) and resistance (I), if a
substitution is made, the amount of current (I) that
flows is strongly influenced by voltage (V) and is best
proportional to resistance (R). The substitution results
for Ohm's law can be assumed by formula (2) below.
𝐼
𝑉
R
(2)
Meanwhile, the power (P) released by the battery
is strongly influenced by the current flowing (I) and
the resistance value (R) through which the current
flows, this opinion can be explained by the formula
below.
𝑃𝑉.𝐼
(3)
Based on formula (3) it can be explained that to
be able to discharge the electric power (P) in the
battery, it is done by increasing the current (I) flowing
at the same voltage (V). So to regulate the amount of
discharge power is done by increasing the flowing
current. while in ohm's law as outlined in formula (2)
the value of the current (I) that flows will be greatly
influenced by the resistance value (R), the smaller the
resistance value, the current value will increase at the
same voltage. So based on formulas (1) (2) and (3) it
can be understood that to be able to deliver a large
discharge power (P) it can be done by reducing the
resistance value by expanding the surface (A).
4 THE WATER RHEOSTAT
DESIGN
To make a water rheostat, components are needed,
including: water box, electrode plate, plate barrier, tie
fasteners, nuts and bolts, cables and cable shoes. Data
Logger is used to record the value of current and
voltage within a certain time interval. The shape of
the water rheostat can be depicted in the following
figure at below.
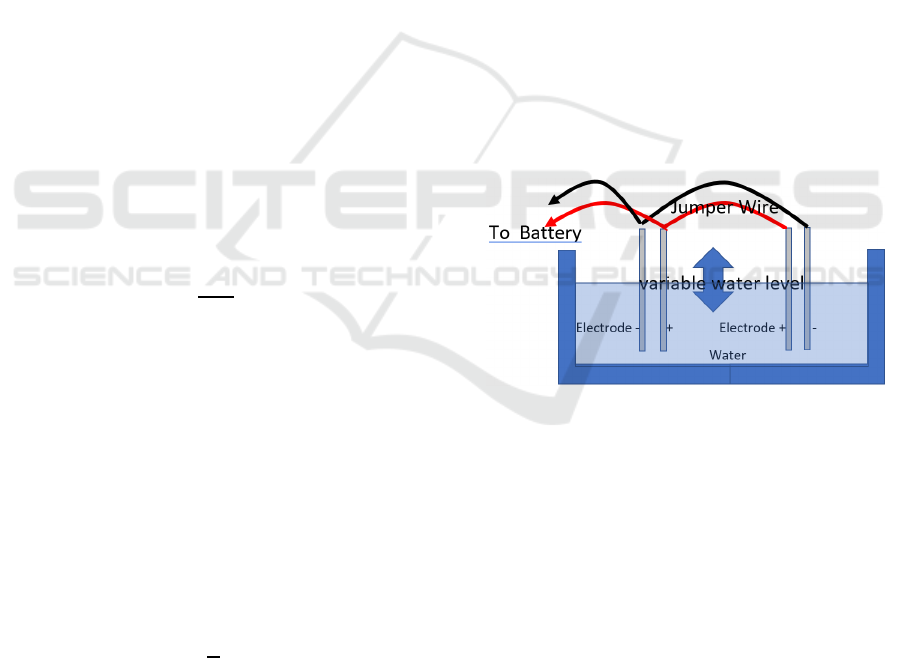
Figure 1: Water rheostat diagram.
Like in the figure 1 can be describe the red cable
is connected to positive of the battery terminal and
electrode, the black one is connected to negative of
the battery terminal. In the connected condition
between the battery terminal with the wet electrode,
the current will be flowed from positive terminal to
the positive electrode, trough the water from positive
to negative electrode, the finally to negative terminal
of the battery. This current flowed process will
discharge the energy in the battery.
The high or low current flowed affected to the
duration time of discharge process(Ioannou et all.,
2017). The high flowed current affected to the faster
discharge, and than the low current flowed affected to
the lower discharge process. The high of the current
flow depend the water rheostat resistance. The low of
A New Method in Performance Test of Electric Vehicle Battery Using Water Rheostat
273
water rheostat resistance affect to the high current
flow, and the high water rheostat resistance affect to
low current flow.
The high or low of water rheostat resistance
depended of the water level to burial the electrode in
the fixed of the space between positive electrode dan
negative electrode. The high of water level will be
reduced the water rheostat resistance and the lower
one will be upgrade the resistance. Like as described
to fix water rheostat resistance, must be keep the
water level. The water rheostat must be designed by
the system to keep the water level like in figure at
below.
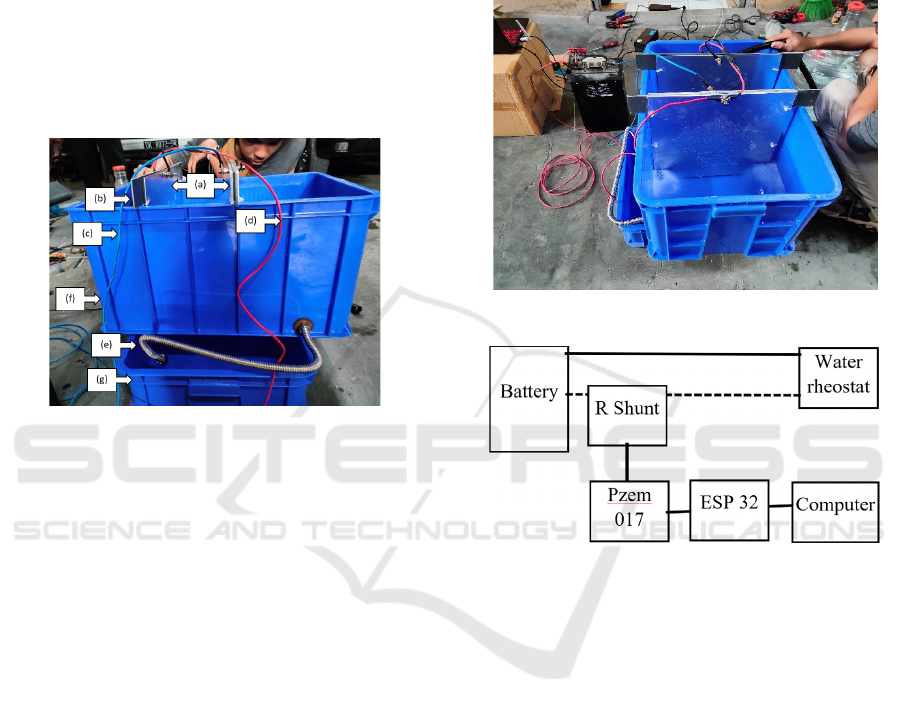
Figure 2: Water rheostat design.
As shown in the figure 2, the main component of
water rheostat consists of: electrode, water and box.
The detail of the water rheostat design consists of: (a)
two set electrode as dummy load, (b) fresh water
supply pipe to keep the water level, (c) negative cable
to connected the battery terminal, (d) positive cable to
connected the battery terminal, (e) overflow pipe to
control the level of water, (f) main water box to
collect the water capacity, (g) reservoir to collect the
over flow water.
5 RESULT AND DISCUSSION
The results of the research are shown in numbers
arranged in a table. The data from the test results are
discussed by analysing mathematically and
statistically, which is finally displayed in the form of
a graph.
5.1 Result
The study was conducted by testing a battery with a
voltage stated on the nameplate of 72 Volt 30 amperes
hours. The battery is charged first to full, after being
fully charged the battery is discharged by connecting
the battery to a water rheostat via a miniature circuit
breaker as shown in the figure below.
The test is carried out as shown in Figure 3 below.
The red wire is connected to a positive voltage source,
while the black wire is connected to a negative
voltage source. The test was carried out using two sets
of water rheostat electrodes.
Figure 3: Tested process.
Figure 4: Block diagram.
The analogue Voltage and current flowing to the
electrodes are converted to digital by a DC
communication module which can measure DC
power up to 300 VDC and current measurement in an
external shunt mounting range of 50A to 300A. The
measurement results are processed by the Pzem-017
converter and read by the ESP-32 data logger, the
data is then sent to the Blynk application on the
computer to displayed the value of the voltage,
current, Power, energy, time at below and also on
Google Spread Sheet as shown at the figure 5. The
data from this spreadsheet is then taken as much as 20
data according to the water level step in the box as
describe on the table 1. The electrode used in this
study is aluminium material, with a thickness of 3.5
cm.
iCAST-ES 2022 - International Conference on Applied Science and Technology on Engineering Science
274

Figure 5: Measurement display.
Table 1: Test result.
Voltage
(
Volt
)
Current
(
Am
p)
Water Deep
(
M
)
Duration
(
second
)
83.64 2.17 0.02 180
82.62 4.35 0.04 180
81.60 6.53 0.06 180
80.61 8.71 0.08 180
79.62 10.89 0.1 180
78.64 13.07 0.12 180
77.68 15.25 0.14 180
76.73 17.43 0.16 180
75.79 19.61 0.18 180
74.86 21.79 0.2 180
73.94 23.97 0.22 180
73.03 26.15 0.24 180
72.14 28.33 0.26 180
71.25 30.51 0.28 180
68.00 32.69 0.3 180
66.00 34.87 0.32 180
60.00 37.05 0.34 180
56.00 39.23 0.36 180
50.00 41.41 0.38 180
46.00 43.59 0.4 180
Total 3600
5.2 Discussion
Based on the data in table 1, the area of the submerged
electrode can be calculated as follows:
Electrode width : 0.35 meters
Water deep : 0.02 meters
The area is = 0.35 x 0.02
= 0,007 ~ 0,01 meter
2
The power discharge of the battery can be
explained by the formula below.
𝑃𝑉.𝐼
𝑃 66 𝑥 34.87: 1000 2,3 𝐾𝑊
Resistance which can be explained by the formula
below.
𝑅
𝜌 . 𝑙
A
The water resistivity which can be explained by the
formula below.
𝜌
𝑅 . 𝐴
𝑙
𝑉 . 𝐴
I . 𝑙
𝜌
83.64 . 0.01
2.17 . 0.001
385 𝑂ℎ𝑚 𝑀𝑒𝑡𝑒𝑟
Through the same analysis as above, this study
found the value of electrode area, water resistivity,
and load like in the table 2 at below.
Table 2: Analysed electrode area and water resistivity.
Electrode
Area
(M
2
)
Load
(KW)
Voltage
(Volt)
Current
(Amp)
Water
Resistivity
(Ohm-m)
0.01 0.18 83.64 2.17 2698.06
0.03 0.36 82.62 4.35 1329.46
0.04 0.53 81.60 6.53 874.78
0.06 0.70 80.61 8.71 647.81
0.07 0.87 79.62 10.89 511.78
0.08 1.03 78.64 13.07 421.19
0.10 1.18 77.68 15.25 356.56
0.11 1.34 76.73 17.43 308.14
0.13 1.49 75.79 19.61 270.53
0.14 1.63 74.86 21.79 240.48
0.15 1.77 73.94 23.97 215.92
0.17 1.91 73.03 26.15 195.50
0.18 2.04 72.14 28.33 178.24
0.20 2.17 71.25 30.51 163.47
0.21 2.22 68.00 32.69 145.61
0.22 2.30 66.00 34.87 132.49
0.24 2.22 60.00 37.05 113.36
0.25 2.20 56.00 39.23 99.92
0.27 2.07 50.00 41.41 84.52
0.28 2.00 46.00 43.53 73.87
Average 71.41 22.88 453.08
Figure 6 shows that when the discharge current
increases, the battery voltage drops(Changseng L.
and Xingxing Z., 2022). Drastic drop in battery
voltage at loads above nominal battery current. The
loading is done repeatedly like figure 6, it is estimated
that the discharge current will decrease, so that can be
predicted of the life cycle of the battery.
A New Method in Performance Test of Electric Vehicle Battery Using Water Rheostat
275
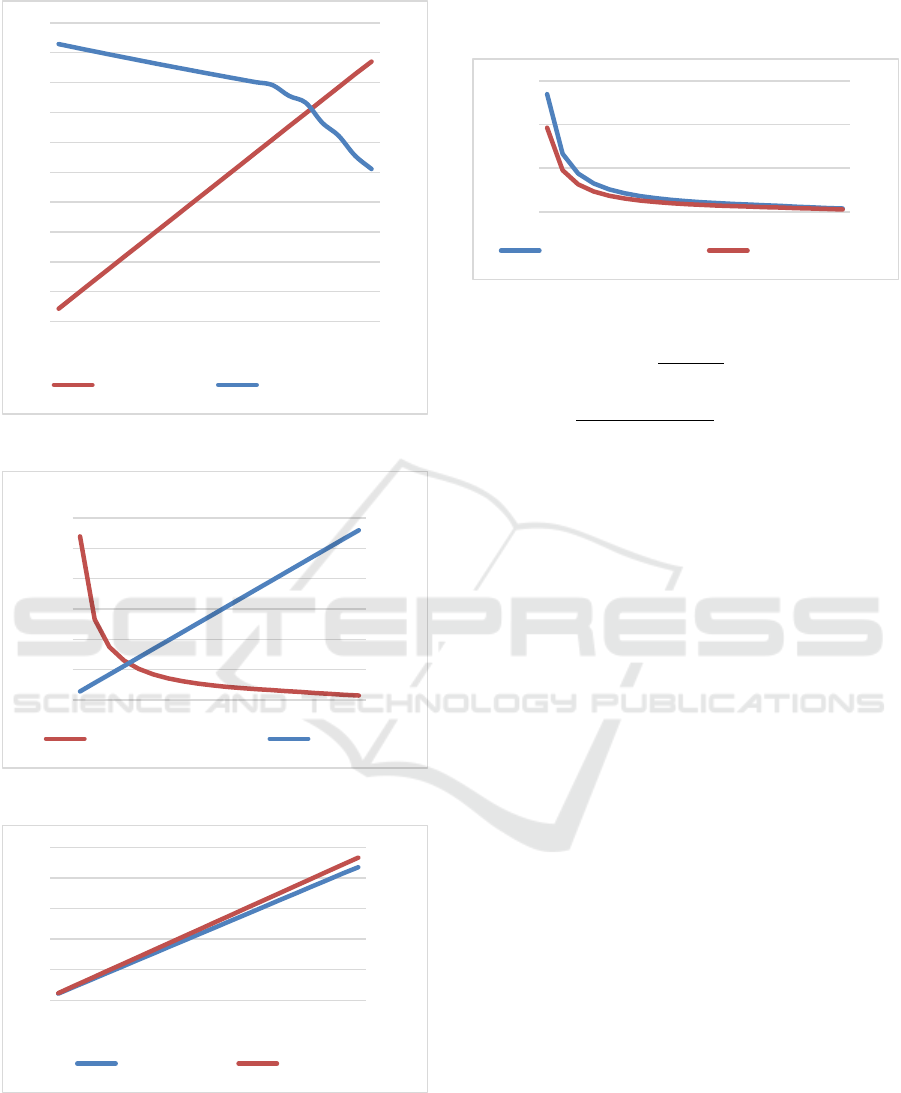
Figure 6: Voltage and current are inverseley proportional.
Figure 7: Water resistivity graph.
Figure 8: Current and Area Linearity.
The battery sample tested in this study was a 72
Volt (30 Ah) battery. Based on table 2, the average
battery voltage is 71.41 Volts, with an average
discharge current of 22.88 Amperes, within 1 hour, so
the real battery capacity being tested is according to
the calculation below.
Figure 9: Water resistivity and resistance of water rheostat.
𝑊
%
𝑉1. 𝐼1. 𝑡
𝑉2. 𝐼2. 𝑡
𝑥100%
𝑊
%
72 𝑥 30 𝑥 1
71.41 𝑥 22.28𝑥1
𝑥100% 74.59%
If this test is done repeatedly, it will result in a
decrease in battery performance, so that the battery
life can be predicted graphically (David, 2019).
6 CONCLUSIONS
Based on the results of testing and analysis can be
concluded as follows:
1. The discharge current are inversely
proportional with the battery terminal
voltage.
2. Portion the discharge current value is 2.17
Amperes in voltage 83.64 volt, the water
resistivity is
2, 698.06 Ohm-meters and than
go down to 73.87 Ohm-meters on voltage
46.00 Volt and the discharge current 43.53
Amperes.
3. The discharge current a inversely with the
area of electrode.
4. The water resistivity are linear fuction to the
resistance of water rheostat.
5. Water rheostat with two sets of electrodes
dimensions of 35 x 36 centimeters can be
use as a dummy load of up to 2.3 KW in a
voltage of 66 Volt DC.
ACKNOWLEDGEMENTS
This research was funded by DIPA Politeknik Negeri
Bali Year 2021. We thank Director of Politeknik
Negeri Bali for his support to this research..
0
10
20
30
40
50
60
70
80
90
0
5
10
15
20
25
30
35
40
45
50
1 3 5 7 9 1113151719
CURRENT(A) VOLTAGE(VOLT)
0,00
0,05
0,10
0,15
0,20
0,25
0,30
0
500
1000
1500
2000
2500
3000
135791113151719
RESISTIVITY(OHM‐M) AREA(M2)
0,00
0,05
0,10
0,15
0,20
0,25
0,30
0
10
20
30
40
50
135791113151719
CURRENT(A) AREA(M2)
0
20
40
60
0
1000
2000
3000
RESISTIVITY(OHM‐M) Resistance(ohm)
iCAST-ES 2022 - International Conference on Applied Science and Technology on Engineering Science
276

REFERENCES
Bowen Xu. (2019). Research on Charging Strategy
Optimization of Electric Vehicle based on AGA. 5th
International Conference on Vehicle, Mechanical and
Electrical Engineering, ICVMEE 2019. Copyright ©
2020 by SCITEPRESS – Science and Technology
Publications, Lda.
Changseng L. and Xingxing Z. (2022). Lithium-ion battery
capacity configuration strategy for photovoltaic
microgrid. International Journal of Low-Carbon
Technologies 2022, 17, 850–855.
Daniel E H., Jordan L Schnell, Daniel R Peters, David C
Wong, Xi Lu, Hao Gao, Hongliang Zhang, Patrick L
Kinney. (2021). Effect of adoption of electric vehicles
on public health and air pollution in China: a modelling
study. The Lancet Planetary Health, Volume 5, Special
Issue, S8, APRIL 01.
David A. Howey. (2019). Tools for battery health
diagnostics and prediction. The Electrochemical
Society Interface, Volume 28, Number 1. URL: Tools
for Battery Health Diagnostics and Prediction -
IOPscience.
Dinda One Mulyaningtyas, I Ketut Widnyana, and Sang
Putu Kaler Surata. (2020). The impact of motorized
vehicle activity on the level of air pollution in bali
island. Granthaalayah International Journal of
Research, Vol.8 (Iss.4): April 2020. URL :
https://www.granthaalayahpublication.org/journals/ind
ex.php/granthaalayah/article/view/IJRG20_B04_3299
Engle J. F..(1952). A water rheostat using untreated water.
In Transactions of the American Institute of Electrical
Engineers Part III: Power Apparatus and Systems, vol.
71, no. 1, pp. 18-21, Jan. 1952.
URL: https://ieeexplore.ieee.org/stamp/stamp.jsp?tp=
&arnumber=4498441&isnumber=4498435.
Ernani F.Chomaa, John S.Evans, James K.Hammitt, José
A.Gómez-Ibáñez, John D.Spengler. (2020). Assessing
the health impacts of electric vehicles through air
pollution in the United States. Environment
International, Volume 144.106015
Ioannou S., K. Dalamagkidis, E. K. Stefanakos, K. P.
Valavanis, and P. H. Wiley. (2017). Runtime, Capacity
and Discharge Current Relationship for Lead Acid and
Lithium Batteries. Researchgate. https://www.
researchgate.net/publication/301496300
Michael J. Safoutin, Joseph McDonald and Ben Ellies.
(2018). Predicting the Future Manufacturing Cost of
Batteries for Plug-In Vehicles for the U.S.
Environmental Protection Agency (EPA) 2017–2025
Light-Duty Greenhouse Gas Standards. In World
Electric Vehicle Journal, 2018, 9, 42.
Srinivas Mutyala, M.Tech. (2019). Design And
Development Of Electric Motorbike. In International
Research Journal of Engineering and Technology
(IRJET),Volume: 06 Issue: 12. www.irjet.net.
C Sudjoko et al. (2021). Utilization of electric vehicles as
an energy alternative to reduce carbon emissions. IOP
Conf. Ser.: Earth Environ. Sci. 926 012094
Wirajati I G. A. B., I Dewa Made Cipta Santosa, I Bagus
Aditya Jaya Pramana, I Putu Gede Suka Haryasa, Ida
Ayu Gede Bintang Madrini. (2021). Solar Power
System Design Applications For Pool Water Pump
Operation At Tourist Accomodation. LOGIC Jurnal
Rancang Bangun dan Teknologi Vol. 21 No. 3
November 2021
Wiryanta, .... (2019). Redesign of Clove Dryer Simulation
Machine Using Heat Waste of Radiator as the Heat
Source. Logic : Jurnal Rancang Bangun Dan
Teknologi, 19(1), 7-13. doi:10.31940/logic.v19i1.1101.
Zhuk A and Buzoverov E. (2018). The impact of electric
vehicles on the outlook of future energy system. IOP
Conf. Series: Materials Science and Engineering, 315
(2018) 012032. doi:10.1088/1757-899X/315/1/012032.
A New Method in Performance Test of Electric Vehicle Battery Using Water Rheostat
277
