
Experimental Study of Circular Tunnel of Vertical Axis Wind
Turbine of Savonius Type-U
Delffika Canra
1 a
, Muhammad Luthfi
1 b
, Ruzita Sumiati
2 c
and Adriansyah
2
1
Politeknik Negari Indramayu, Jalan Lohbener Lama no. 8, Indramayu, Indonesia
2
Politeknik Negeri Padang, Kampus Limau Manis Padang, Indonesia
Keywords: Vertical Axis Wind Turbine (Vawt), Savonius Type-U, Circular Tunnel.
Abstract: Much research has been conducted to develop the construction of wind turbine thus produces the optimum
electrical power. The construction development that has been carried out is by varying the shape of blade,
angle of blade, number of blades, staging blade, shield, and deflector. Author tried to optimize the use of
shield construction (guided-box tunnel) by making the variation of circular shape. By guiding wind to the
blade that is dragged can increase turbine power proportional to the torque value. Therefore, the aim of this
research is to find Coefficient of Power (Cp) and torque value of deconstructed Savonius wind blade type U
using circular tunnel. The designed rotor is a savonius type -U of 2 blade rotor. The dimensions of the rotor
are designed to be smaller than the previous research which has the diameter of savonius rotor of 250 mm and
an aspect ratio of 1: 1. Circular tunnel dimensions was slightly widened, with the diameter of 270 mm and
height of 400 mm. Cp with circular tunnel increase 2,5 times of the value Cp without circular tunnel.
Meanwhile, the addition of circular tunnel caused the decrease of torque value even though it was not
significant.
1 INTRODUCTION
The Savonius wind turbine is a type of Vertical Axis
wind Turbine (VAWT). This turbine has been already
studied since 1920 until now by many researchers.
The working principle of this turbine is based on the
difference of drag force that hit the surface of
semicircular of the rotor. The sum of this drag force,
if it is positive, can rotate of the turbine shaft
(D.S.Hasan, et al., 2013). Theoretically, the relation
between Cp value and Tip Speed Ratio (TSR) for
Savonius Turbine is shown in Figure 1.
Much research has been conducted to develop the
construction of wind turbine thus produces the
optimum electrical power. The construction
development that has been carried out is by varying
the shape of blade, angle of blade, number of blades,
staging blade, shield, and deflector. Therefore, there
are many types of blades of this turbine, such as type
U that is the conventional type, type L, twisted blade,
a
https://orcid.org/0000-0002-0298-4627
b
https://orcid.org/0000-0003-2544-7151
c
https://orcid.org/0000-0003-4659-0029
Figure 1: Relation between Cp and TSR.
multistage blade, or various radius and width of the
arc.
There are some methods to increase the
performance of the Savonius U-type wind turbine.
One of which is by applying guide-box tunnel, that
can be seen in Figure 2(a), as wind deflector to
prevent returning blade. By using this type, Cp can
increase until 50% for three blades but the
Canra, D., Luthfi, M., Sumiati, R. and Adriansyah, .
Experimental Study of Circular Tunnel of Vertical Axis Wind Turbine of Savonius Type-U.
DOI: 10.5220/0011758500003575
In Proceedings of the 5th International Conference on Applied Science and Technology on Engineering Science (iCAST-ES 2022), pages 263-270
ISBN: 978-989-758-619-4; ISSN: 2975-8246
Copyright © 2023 by SCITEPRESS – Science and Technology Publications, Lda. Under CC license (CC BY-NC-ND 4.0)
263

disadvantage of this type is its complex construction.
The sixth method is by modifying the blade by
applying geometrical parameter value difference,
such as overlap and angle between blades as can be
seen in Figure 2(b). This can increase the Cp value up
to 60% dan producing high vibration (Mohamed
Hasan A. M, 2011). The sixth method is always used
to design the turbine blade because it is proven to
increase Cp more significantly than the conventional
blade design (Delffika Canra. et al, 2018).
(a) (b)
Figure 2: (a) Guide-box tunnel (b) Overlap geometri rotor
Author tried to optimize the use of shield
construction (guided-box tunnel) by making the
variation of circular shape. By using this method, it is
intended to increase the Cp and torque value on the
wind blade. This tunnel construction can guide the
wind to the surface of the blade and prevent the wind
to push the returning blade. By guiding wind to the
blade that is dragged can increase turbine power
proportional to the torque value. Therefore, the aim
of this research is to find Cp and torque value of
deconstructed Savonius wind blade type U using
circular tunnel.
2 RESEARCH METHODS AND
PREPARATION
The research method that is used, is experiment with
the steps are explained in Figure 3.
Figure 3: Research flow.
The first step was designing prototype model by
using CAD software to produce design model and
drawing. The drawing is used to make the prototype
(wind turbine). The designed rotor is a savonius type
-U of 2 blade rotor. The dimensions of the rotor are
designed to be smaller than the previous research
which has the diameter of savonius rotor of 250 mm
and an aspect ratio of 1: 1. Circular tunnel dimensions
was slightly widened, with the diameter of 270 mm
and height of 400 mm as shown in Figure 4.
This circular tunnel was varied by applying guide
on the inlet of the wind as seen in Figure 5. There was
variation of guide angle by 0° and 45°. By applying
this guide, it was intended to increase the wind power
to rotate the wind turbine.
Wind tunnel was prepared with the dimension of
750 mm x 20 mm x 250 mm and equipped with
honeycomb inside. The function of honeycomb is to
guide the wind to be homogeneous in one direction.
The material of the rotor that was used was
aluminium due to its lightness and ease of formation
and fabrication. Meanwhile, the material of the
Circular Tunnel was the steel plate with the thickness
of 1 mm.
Figure 4: Design of Rotor and Circular tunnel.
(a) (b)
Figure 5: Variation of Design of Circular tunnel (a) guide
of inlet 0
0
(b) guide of inlet 45
0
.
Prototype design and research was done in the
laboratory of Mechanical Engineering Department of
Polindra while the turbine was manufactured in the
workshop of Mechanical Engineering Department of
Polindra. The process was then continued to the data
retrieval. The wind speed used for this research was
4-9 m/s with the resolution of 0,5 m/s by using Axial
Blower Fan. The wind speed was measured when the
wind flowed through and exited from the rotor by
using anemometer. The other required data was the
rotational speed of rotor by using tachometer.
Meanwhile, to know the produced torque, load
prototype
production
data retrieval
data processing
and analysis
Rotor
Circular Tunnel
iCAST-ES 2022 - International Conference on Applied Science and Technology on Engineering Science
264
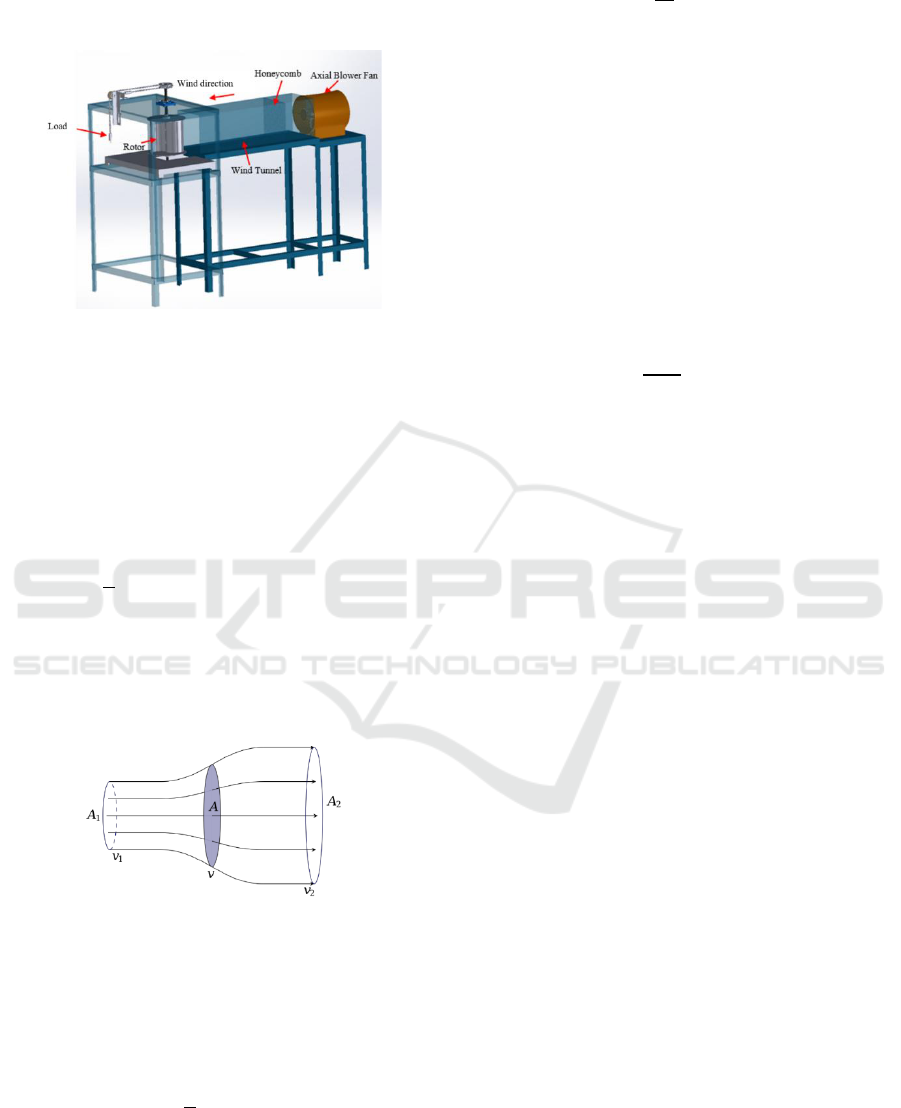
addition to the rotor system was needed and the load
was measured by using small weight scale as can be
seen in Figure 6.
Figure 6: Prototype Design.
The collected data then were processed according
to the basic theory of wind turbine, such as turbine
power calculation, wind power and the produced
torque. By using Betz momentum theory in which the
wind speed v
1
flowing through the turbine blades
experiences the speed change of v
2
, the mechanical
power then could be calculated by using the following
formula.
(1)
Where: P = turbine mechanical power (W)
= density of wind (kg/m
3
)
A = sweep area (m
2
)
v = velocity of wind (m/s)
Figure 7: Change of wind speed after flowing through the
turbine blade.
The Cp defines the performance of the wind
turbine and the wind power defines the amount of
kinetic power of the wind that flow through the wind
turbine blade and can be formulated by
(2)
where
= wind power (W)
Therefore, the Cp of the turbine was calculated by
(3)
Calculating the amount of torque is also
important. Torque can be defined as the measure of
force effectiveness to produce the rotation around the
axis. The amount of torque can be formulated by
(4)
Where : T = Torque (Nm)
m = mass (kg)
r = radius of pulley (m)
g = gravitation (m/s
2
)
Meanwhile the tip speed ratio can be calculated by
(5)
Where : D = diameter of blade (m)
v = velocity of wind (m/s)
n = blade rotation speed (rpm)
3 RESULT AND DISCUSSION
3.1 Experiment-1 (E-1): Rotor Without
Circular Tunnel
The first experiment is testing the turbine withour
using the circular tunnel. The result of data processing
of turbine power, wind power and Coefficient of
Power can be represented in Table 1 and Figure 8,
where the author used Equation 1.
The highest Coefficient of power (Cp) was
obtained at the wind speed of 6,5 m/s. After that, the
Cp decreases as the wind speed increases.
The construction ratio of 1:1 caused the Cp value
lower than that of the construction ratio of 1:4. This
is proven by the highest Cp value that was obtained
was 0,1031. The typical Cp value of Savonius Type
C is usually up to 0,3 (Mohamed Hasan A. M, 2011).
However, in this research, the author focused on the
difference of Cp value in the utilization of circular
tunnel.
Experimental Study of Circular Tunnel of Vertical Axis Wind Turbine of Savonius Type-U
265
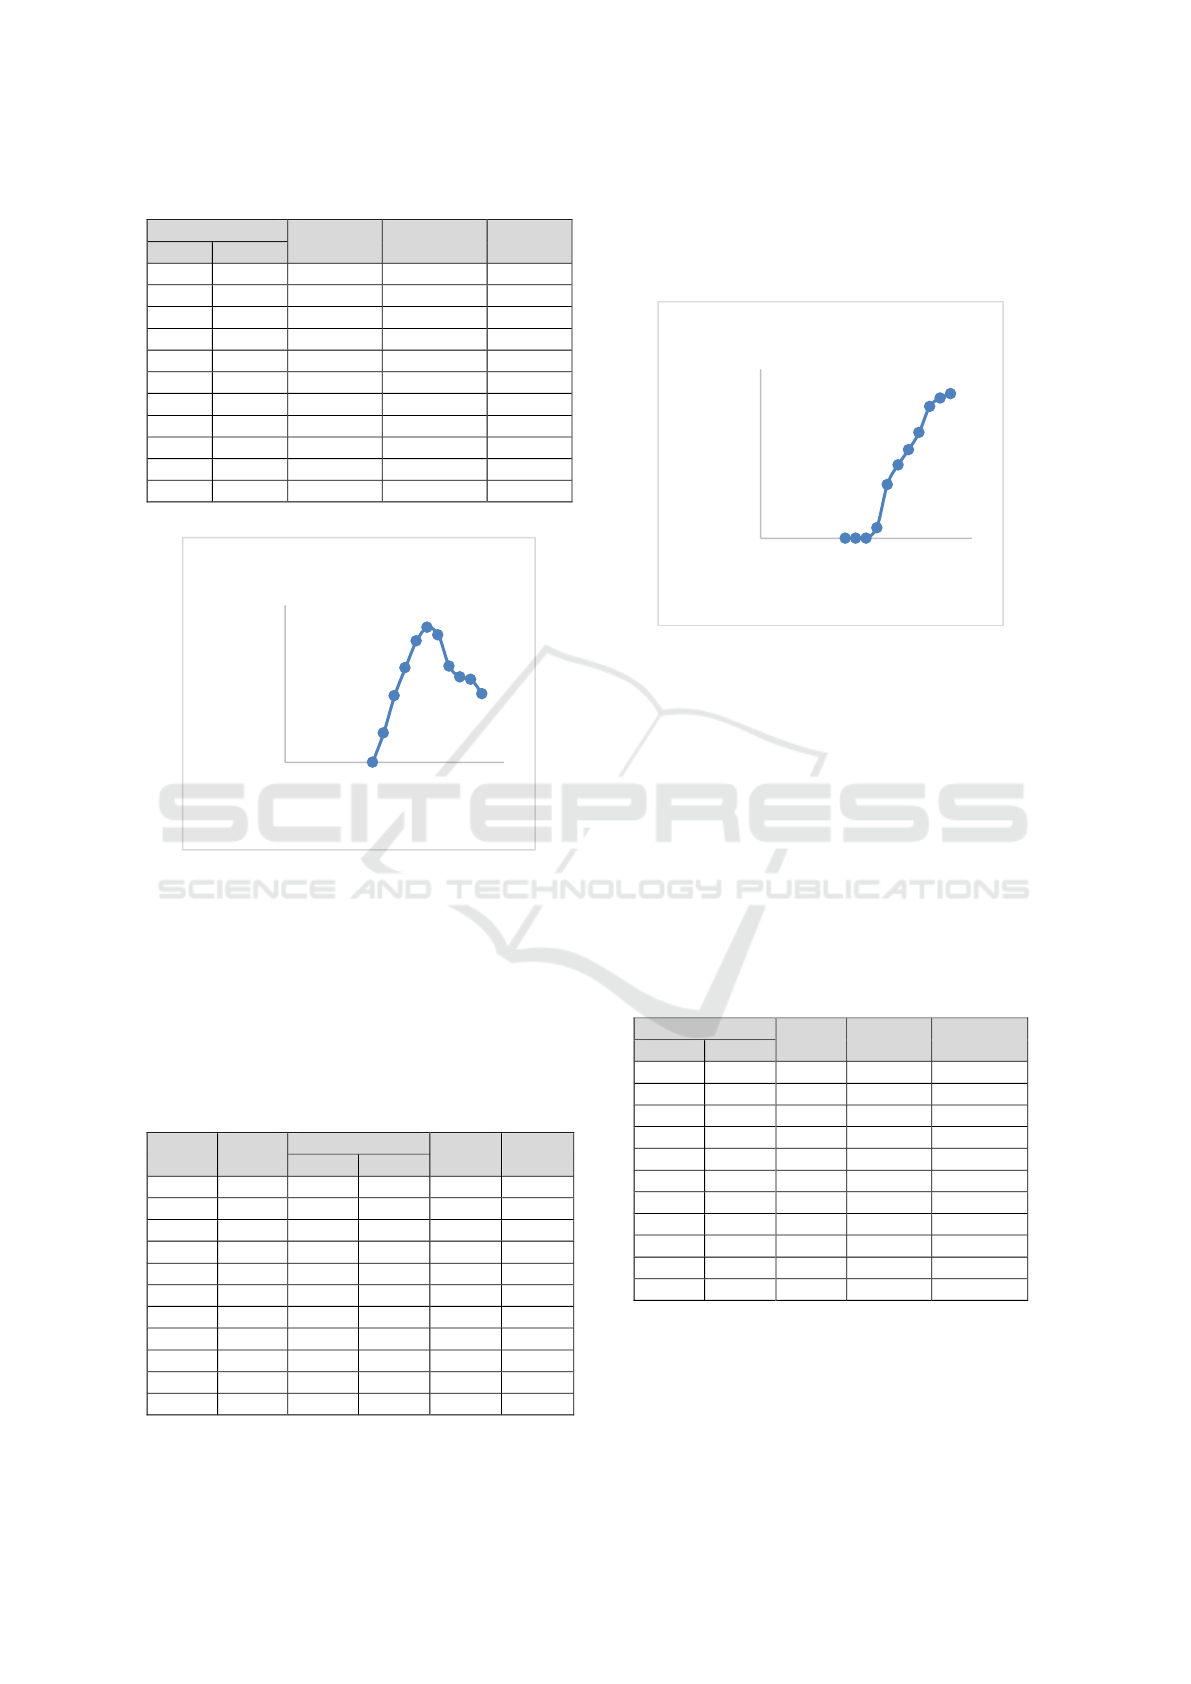
Table 1: Data Processing Result of Cp (E-1).
v [m/s]
P
[watt]
P
0
[watt]
Cp
1 (in)
2 (out)
9
6,8
1,5414
29,3878
0,0524
8,5
6,2
1,5674
24,7569
0,0633
8
5,8
1,3463
20,6400
0,0652
7,5
5,3
1,2487
17,0068
0,0734
7
4,6
1,3468
13,8272
0,0974
6,5
4,2
1,1409
11,0708
0,1031
6
4
0,8063
8,7075
0,0926
5,5
3,9
0,4850
6,7070
0,0723
5
3,8
0,2554
5,0391
0,0507
4,5
3,8
0,0820
3,6735
0,0223
4
0
0,0000
2,8500
0,0000
Figure 8: The Graph of the Relation between v
1
and Cp (E-
1).
By using equation 4 and 5, the author processes
the data of wind speed, rotational speed of rotor, and
the given load to the system. The result of this was the
torque value (T) and Tip Speed Ratio (λ) that can be
seen in Table 2 and Figure 9.
Table 2: Result of Data Processing of Torque and TSR (E-
1).
v
1
[m/s]
n
[rpm]
m [kg]
T
[Nm]
λ
(TSR)
m
1
m
2
9
580
0,725
0,39
0,1027
0,9443
8,5
530
0,68
0,355
0,0996
0,9137
8
490
0,645
0,34
0,0935
0,8975
7,5
440
0,545
0,3
0,0751
0,8597
7
359
0,485
0,28
0,0628
0,7515
6,5
280
0,41
0,24
0,0521
0,6312
6
180
0,295
0,17
0,0383
0,4396
5,5
105
0,155
0,13
0,0077
0,2797
5
75
0,07
0,07
0,0000
0,2198
4,5
50
0
0
0,0000
0,1628
4
0
0
0
0,0000
0,0000
The resulted torque increased proportionally as
the inlet wind speed increased, and inversely related
to the increase of Cp. This concluded that the torque
was not affected by Cp.
Figure 9: The Graph of the Relation between v
1
and T (E-
1).
The data of the first experiment became the
comparison value to the next experiment.
3.2 Experiment-2 (E-2): Rotor with
Circular Tunnel
The second experiment was the turbine simulation
with circular tunnel. The result of data processing of
turbine power, wind power, and Cp can be
represented on Table 3 and Figure 10, where the
equation 1,2, and 3 were used.
Table 3: Data Processing Result of Cp (E-2).
v [m/s]
P
[watt]
P
0
[watt]
Cp
1 (in)
2 (out)
9
5,5
1,7901
14,6939
0,1218
8,5
4,9
1,7502
12,3785
0,1414
8
4
1,9350
10,3200
0,1875
7,5
3,2
1,9939
8,5034
0,2345
7
2,9
1,6772
6,9136
0,2426
6,5
2,5
1,4513
5,5354
0,2622
6
2,4
1,0971
4,3538
0,2520
5,5
2,3
0,8050
3,3535
0,2400
5
2,2
0,5689
2,5195
0,2258
4,5
2,1
0,3831
1,8367
0,2086
4
2,05
0,2318
1,2900
0,1797
The trend of the graph line was not significantly
different from the first experiment, but the highest Cp
value increased by three times at the wind speed of
6,5 m/s. From this data, it could be proven that the
circular tunnel could increase the Cp of turbine.
0
0,02
0,04
0,06
0,08
0,1
0,12
0 2 4 6 8 10
Coefficient of power
(Cp)
Wind-in (V
1
)[m/s]
V
1
vs Cp
0
0,02
0,04
0,06
0,08
0,1
0,12
0 2 4 6 8 10
Torque (T) [Nm]
Wind-in (V
1
)[m/s]
V
1
vs T
iCAST-ES 2022 - International Conference on Applied Science and Technology on Engineering Science
266

Figure 10: The Graph of the Relation between v
1
and Cp (E-
2).
Torque (T) dan Tip Speed Ratio (λ) result can be
seen in Table 4 and Figure 11. The result of data
processing of wind speed, rotational speed of rotor,
and the given load to the system used Equation 4 and
5.
The second experiment shows that the torque
value increased as the wind speed increased which
was identical with the first experiment. The torque
decreased compared tto the first experiment at the
same wind speed though. This could be caused by the
decrease of wind volume flowing through the turbine
and it was suspected that there was turbulence around
zje circular tunnel plate thus the rotational speed of
rotor decreased dramatically.
Table 4 : Result of Data Processing of Torque and TSR (E-
2).
v
1
[m/s]
n
[rpm]
m [kg]
T
[Nm]
λ
(TSR)
m
1
m
2
9
230
0,5
0,275
0,0690
0,3745
8,5
223
0,475
0,255
0,0674
0,3844
8
206
0,44
0,22
0,0674
0,3773
7,5
188
0,395
0,215
0,0552
0,3673
7
169
0,33
0,205
0,0383
0,3538
6,5
139
0,25
0,16
0,0276
0,3134
6
95
0,155
0,12
0,0107
0,2320
5,5
75
0,08
0,065
0,0046
0,1998
5
63
0
0
0,0000
0,1846
4,5
40
0
0
0,0000
0,1303
4
23
0
0
0,0000
0,0843
Figure 11: The Graph of the Relation between v
1
and T (E-
2).
3.3 Experiment-3 (E-3): Rotor with
Circular Tunnel Inlet 0
0
The third experiment was the turbine simulation with
circular tunnel inlet 0°. The result of data processing
of turbine power, wind power, and Cp can be
represented on Table 5 and Figure 12, where the
equation 1,2, and 3 were used.
Table 5: Data Processing Result of Cp (E-3).
v [m/s]
P
[watt]
P
0
[watt]
Cp
1 (in)
2 (out)
9
4,5
2,7551
14,6939
0,1875
8,5
4,3
2,2756
12,3785
0,1838
8
4
1,9350
10,3200
0,1875
7,5
3,9
1,4890
8,5034
0,1751
7
3,7
1,1743
6,9136
0,1699
6,5
3,5
0,9070
5,5354
0,1639
6
3,3
0,6833
4,3538
0,1569
5,5
3,1
0,4992
3,3535
0,1489
5
2,9
0,3511
2,5195
0,1394
4,5
2,8
0,2126
1,8367
0,1158
4
2,7
0,1141
1,2900
0,0885
Circular tunnel with inlet 0° resulted in the Cp up
to 0,1875 at wind speed of 9 m/s and the trend
increased as the wind speed increased. During the
data collection at simulated turbine, there was indeed
the turbulence that caused the decrease of turbine
power and wind power compared to the second
experiment.
Looking at Figure 12, the Cp increased as the
wind speed increased and there was no decrease sign.
The was possibility that the Cp peak was not reached.
Due to the limitation of axial fan blower, the data
collection could not be proceed further.
0
0,05
0,1
0,15
0,2
0,25
0,3
0 2 4 6 8 10
Coefficient of power
(Cp)
Wind-in (V
1
)[m/s]
V
1
vs Cp
0
0,02
0,04
0,06
0,08
0,1
0 2 4 6 8 10
Torque (T) [Nm]
Wind-in (V
1
)[m/s]
V
1
vs T
Experimental Study of Circular Tunnel of Vertical Axis Wind Turbine of Savonius Type-U
267
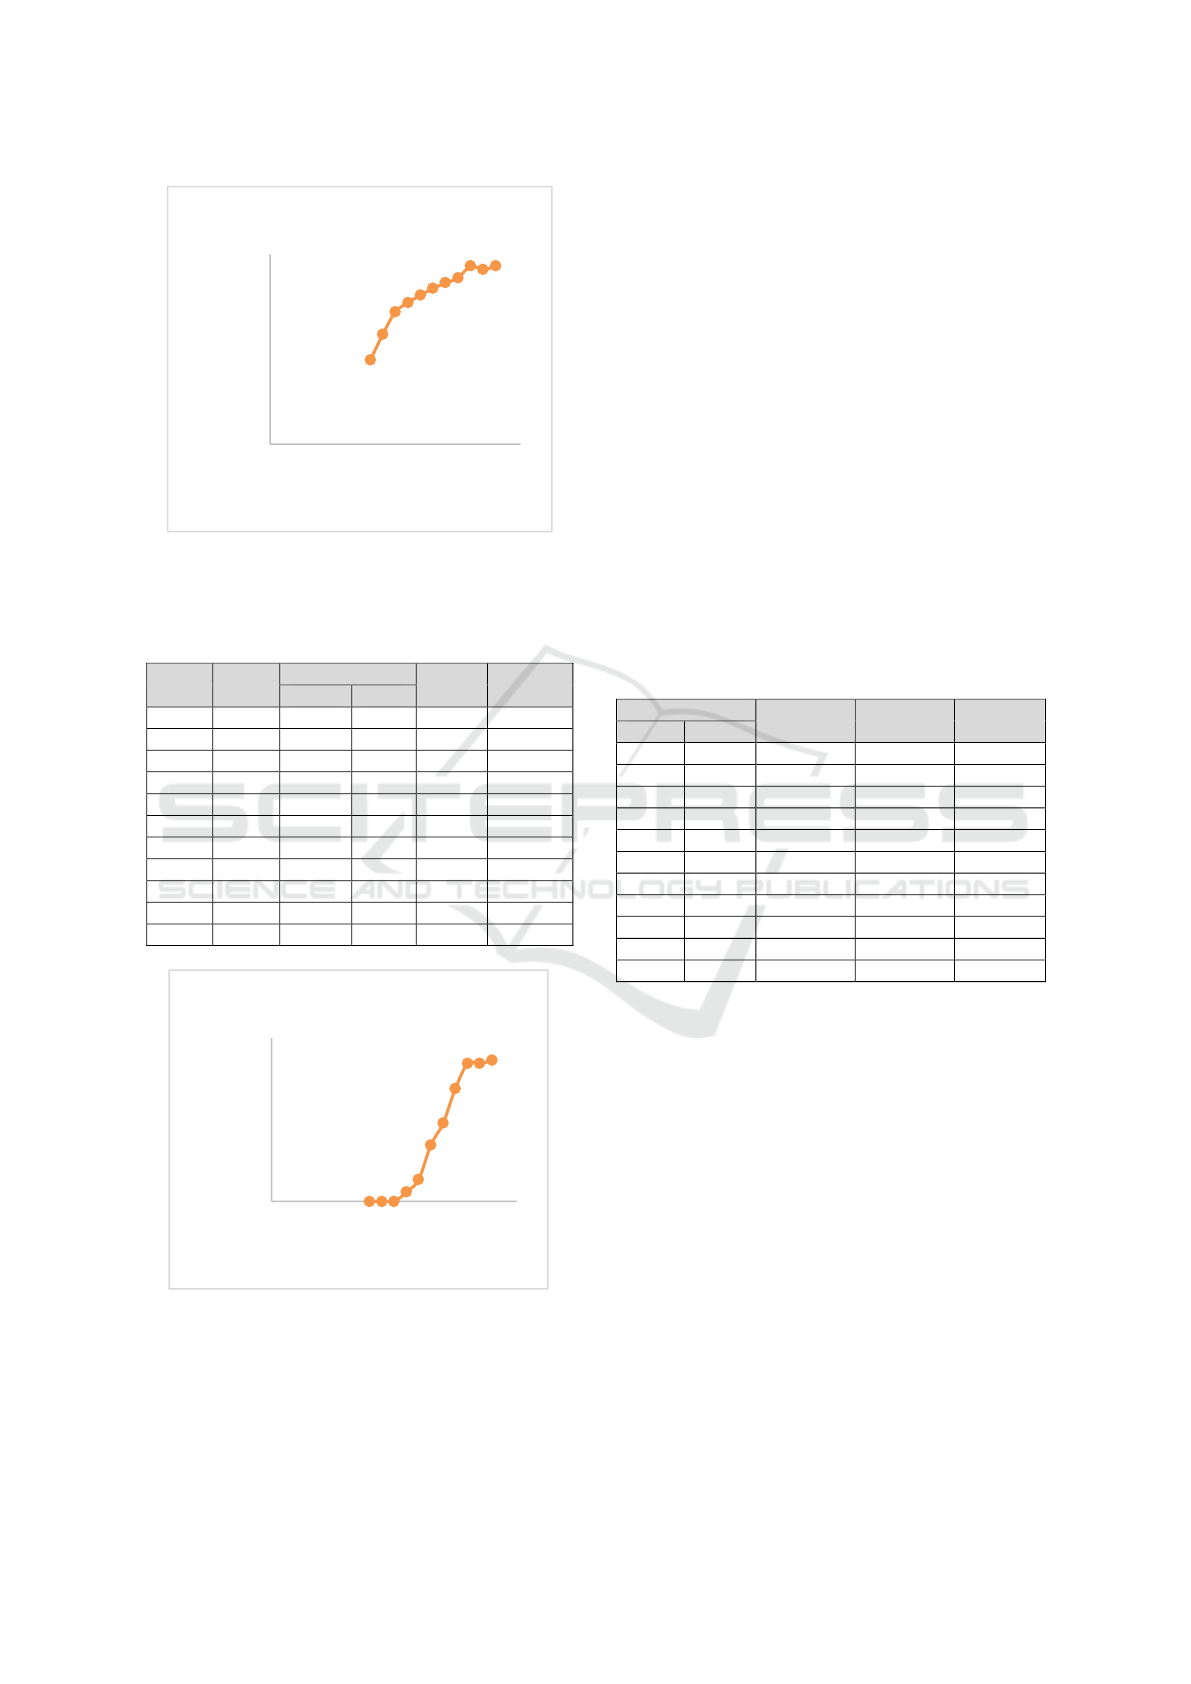
Figure 12: The Graph of the Relation between v
1
and Cp (E-
3).
Table 6: Result of Data Processing of Torque and TSR (E-
3).
v
1
[m/s]
n
[rpm]
m [kg]
T
[Nm]
λ
(TSR)
m
1
m
2
9
230
0,5
0,275
0,0690
0,3745
8,5
223
0,475
0,255
0,0674
0,3844
8
206
0,44
0,22
0,0674
0,3773
7,5
188
0,395
0,215
0,0552
0,3673
7
169
0,33
0,205
0,0383
0,3538
6,5
139
0,25
0,16
0,0276
0,3134
6
95
0,155
0,12
0,0107
0,2320
5,5
75
0,08
0,065
0,0046
0,1998
5
63
0
0
0,0000
0,1846
4,5
40
0
0
0,0000
0,1303
4
23
0
0
0,0000
0,0843
Figure 13: The Graph of the Relation between v
1
and T (E-
3).
The third experiment shows that the torque value
increased as the wind speed increased that can be seen
in Figure 13 and was identical with the first and
second experiment. The highest torque value that was
obtained was 0,0690 at the wind speed of 9 m/s that
can be seen in Table 6. The torque decreased
compared to the first experiment at the same wind
speed but equivalent to the torque value of second
experiment.
The resulted torque value of the third experiment was
insignificantly different from that of the second
experiment. By adding the guide of inlet 0°, it caused
more turbulence but did not affect the torque much.
3.4 Experiment-4 (E-4): Rotor with
Circular Tunnel Inlet 45
0
The fourth experiment was the simulation of turbine
by using circular tunnel with inlet 45°. The result of
data processing of turbine power, wind power, and Cp
can be represented on Table 7 and Figure 14, where
the equation 1,2, and 3 were used.
Table 7: Data Processing Result of Cp (E-4).
v [m/s]
P
[watt]
P
0
[watt]
Cp
1 (in)
2 (out)
9
5,3
1,9730
14,6939
0,1343
8,5
5,1
1,5844
12,3785
0,1280
8
4,9
1,2494
10,3200
0,1211
7,5
4,6
1,0256
8,5034
0,1206
7
4,3
0,8302
6,9136
0,1201
6,5
4,1
0,6153
5,5354
0,1112
6
3,8
0,4780
4,3538
0,1098
5,5
3,5
0,3628
3,3535
0,1082
5
3,2
0,2678
2,5195
0,1063
4,5
2,9
0,1909
1,8367
0,1039
4
2,6
0,1304
1,2900
0,1011
Circular tunnel with inlet 45° resulted in the Cp
up to 0,1343 at wind speed of 9 m/s and the trend
increased as the wind speed increased as seen in
Figure 14. This Cp was lower than that of the third
experiment. The same case might occur as the third
experiment that there was much turbulence causing
the decrease of turbine power and wind power.
The result of the fourth experiment was identical
with the third experiment. However, there was
decrease of Cp in the fourth experiment the
experiment cannot be conducted further due to the
limitation of the experiment apparatus.
0
0,05
0,1
0,15
0,2
0 2 4 6 8 10
Coefficient of power
(Cp)
Wind-in (V
1
)[m/s]
V
1
vs Cp
0
0,02
0,04
0,06
0,08
0 2 4 6 8 10
Torque (T) [Nm]
Wind-in (V
1
)[m/s]
V
1
vs T
iCAST-ES 2022 - International Conference on Applied Science and Technology on Engineering Science
268
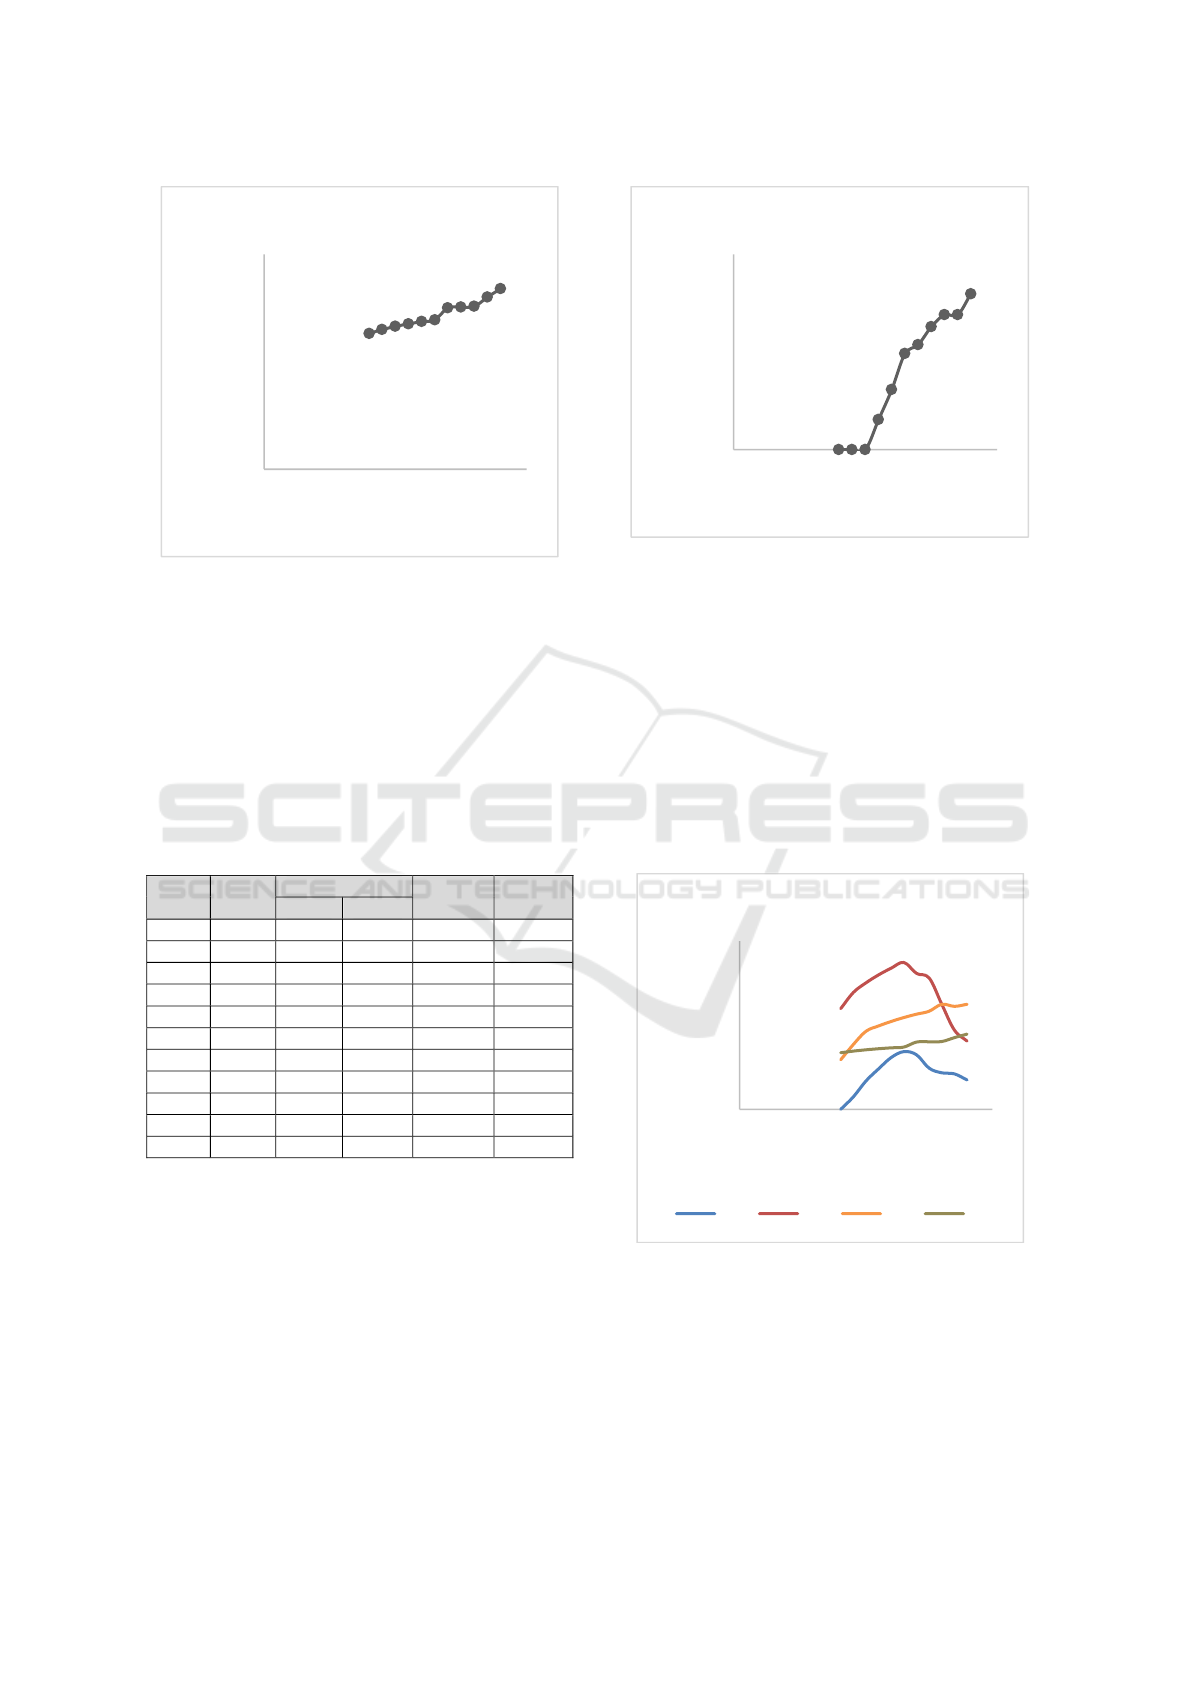
Figure 14: The Graph of the Relation between v
1
and Cp (E-
4).
Because the fourth experiment was identical to the
third experiment, the torque value was thus not
different much. The highest torque was 0,0797 at the
maximum wind speed of 9 m/s as seen in Table 8.
This proves that the addition of inlet, either inlet 0° or
inlet 45°, did not affect the torque value even though
the turbulence increased a little.
Table 8: Result of Data Processing of Torque and TSR (E-
4).
v
1
[m/s]
n
[rpm]
m [kg]
T
[Nm]
λ
(TSR)
m
1
m
2
9
290
0,545
0,285
0,0797
0,4722
8,5
250
0,49
0,265
0,0690
0,4310
8
225
0,465
0,24
0,0690
0,4121
7,5
200
0,405
0,2
0,0628
0,3908
7
172
0,345
0,17
0,0536
0,3601
6,5
147
0,325
0,165
0,0491
0,3314
6
115
0,25
0,15
0,0307
0,2809
5,5
96
0,13
0,08
0,0153
0,2558
5
70
0
0
0,0000
0,2051
4,5
52
0
0
0,0000
0,1693
4
32
0
0
0,0000
0,1172
Figure 15 shows the same case as the previous
experiment. There was no significant difference
between them. The torque value increased as the wind
speed increased.
Figure 15: The Graph of the Relation between v
1
and T (E-
4).
3.5 Comparison of all Experiment
Results
As can be represented by Figure 16, the highest Cp
value was obtained in the second experiment by
0,2622 at the wind speed 6,5 m/s while the Cp of
0,1031 was obtained at the same wind speed in the
first experiment. This differed from the third
experiment, where the highest Cp were 0,1875 and
0,1343 respectively.
Figure 16: The Graph of the Relation between v
1
and Cp.
0
0,02
0,04
0,06
0,08
0,1
0,12
0,14
0,16
0 2 4 6 8 10
Coefficient of power
(Cp)
Wind-in (V
1
)[m/s]
V
1
vs Cp
0
0,02
0,04
0,06
0,08
0,1
0 2 4 6 8 10
Torque (T) [Nm]
Wind-in (V
1
)[m/s]
V
1
vs T
0
0,05
0,1
0,15
0,2
0,25
0,3
0 2 4 6 8 10
Coefficient of power
(Cp)
Wind-in (V
1
)[m/s]
V
1
vs Cp
E-1 E-2 E-3 E-4
Experimental Study of Circular Tunnel of Vertical Axis Wind Turbine of Savonius Type-U
269

Figure 17: The Graph of the Relation between v
1
and T.
Figure 18: The Graph of the Relation between λ and Cp.
The torque value in all experiment increased as
the wind speed increased but the highest torque was
obtained in the first experiment as seen in Figure 17.
In the second until the fourth experiment, there was
decrease of torque compared to the first experiment
but this was not significant. This was suspected that
the cause of this was circular tunnel.
Looking at the comparison graph of Cp and TSR
in Figure 18, only the first and second experiment that
had the typical Savonius wind turbine graph
characteristic in general. Meanwhile, in the third and
fourth experiment, there was still possibility of
increase then decrease of value until the TSR reached
1 or more.
4 CONCLUSION
From the result of all experiment, it can be concluded
that the use of circular tunnel affects the Cp increase,
especially in the second experiment, where there was
increase of value of Cp by 2,5 times of the value of
Cp in the first experiment, which was 0,2622 at the
wind speed of 6 m/s. The same case occurred in the
third and fourth experiment, that the obtained Cp was
higher than the Cp in the first experiment by 1,8 and
1,3 times respectively. Another word that Cp with
circular tunnel increase 2,5 times of the value Cp
without circular tunnel.
Meanwhile, the addition of circular tunnel caused
the decrease of torque value even though it was not
significant.
REFERENCES
Ahmad Farid, 2014, " Optimasi Daya Turbin Angin
Savonius dengan Variasi Celah dan Perubahan Jumlah
Sudu", Prosiding SNST ke-5, Fakultas Teknik
Universitas Wahid Hasyim Semarang, ISBN 978-602-
99334-3-7
Burcin Deda A. 2008. “An Experimental study on
improvement of a savonius rotor performance with
curtaining.” Experimental Thermal and Fluid Science.;
l (32) : 1637-1678.
Delffika Canra. dkk, 2018, “ Analisa Aliran Angin Pada
Sudu Turbin Angin Savonius Tipe-U Berbasis Software
“, Jurnal Teknologi Terapan Vol. 4, No. 2, Politeknik
Negeri Indramayu, 2018.
Delffika Canra. dkk, 2019, “ Pengaruh Busur Sudu Turbin
Angin Savonius Tipe-U Menggunakan Perangkat
Lunak “, Jurnal Simetris Vol. 10, No. 1, Universitas
Muria Kudus, 2019
Delffika Canra. dkk, 2021, “ Kaji Eksperimental Turbin
Angin Hybrid Savonius-Darrieus Eggbeater Bertingkat
Banyak “, Prosiding IRWNS ke-12, Politeknik Negeri
Bandung, 2021
M. Haydarul H. dkk, 2013, "Rancang Bangun Turbin Angin
Vertikal Jenis Savonius dengan Variasi Jumlah Blade
Terintegrasi Circular Shield untuk Memperoleh Daya
Maksimum", Jurnal Teknik POMITS Vol. 7, No.7 ,
(2013) 1-6
Mohamed Hasan A. M, 2011, "Design Optimazation of
Savonius and Wells Turbines", Desertation University
of Magdeburg
Nakhoda Y.I.. 2015. “Rancang Bangun Kincir Angin
Sumbu Vertikal Pembangkit Tenaga Listrik Portabel.”
Seminar Nasional Sains dan Teknologi Terapan.; l (3) :
59-67. Institut Teknologi Adhi Tama Surabaya.
D.S.Hasan, dkk., 2013 “Studi Eksperimental Vertical Axis
Wind Turbine Tipe Savonius dengan Variasi Jumlah
Fin pada Sudu,” Jurnal Teknik Pomits, vol. 2 no. 2, pp
B-350-B-355, 2013.
White F.M. Mekanika Fluida. Jilid 3. Edisi Kedua. Penerbit
Erlangga, Jakarta. 2005
0
0,02
0,04
0,06
0,08
0,1
0,12
0 2 4 6 8 10
Torque (T) [Nm]
Wind-in (V
1
)[m/s]
V
1
vs T
E-1 E-2 E-3 E-4
0
0,1
0,2
0,3
0 0,5 1
Coefficient of power
(Cp)
Tip Speed Ratio (λ)
λ vs Cp
E-1 E-2 E-3 E-4
iCAST-ES 2022 - International Conference on Applied Science and Technology on Engineering Science
270
