
A Research on the Relevance of the Crime and the Housing Price
Based on the Linear Regression Model
Jiali Guo
1,*,†
, Zitao Ying
2,*,†
, Zhengqi Sun
3,*,†
and Yuxiang Zhu
4,*,†
1
Shanghai University of Finance and Economics, SUFE Shanghai, China
2
Zhejiang University, ZJU, Hangzhou, China
3
Queen’s University, QU, Wuhan, China
4
Nanjing University Business School, NJU, Nanjing, China
†
These authors contributed equally
Keywords: House Price, Criminal, Manhattan, Regression Model.
Abstract: As the most expensive area to live in the United States, Manhattan's housing prices are influenced by many
factors, with crime rates being one of the most important factors affecting Manhattan's housing prices.
Under this situation, this paper will explore the relationship between house prices and crime rates in
Manhattan through the house prices and crime rate data in 2016-2017, by using python and R to build a
simple linear regression model to find the relationship between the average house price and crime rate. As
for the conclusion section, this paper will give the results of the analysis of the data with the conclusion and
the practical implications of this conclusion.
1 INTRODUCTION
The house is the most important source to every
civilian not only as a place to live but also as a kind
of property. Therefore, it is quite important to know
what affects housing price and how they affect it.
In a market economy, housing price is also
determined by markets, this paper found out what
influence the demanding at the very beginning.
Among those factors, the influx of people could
definitely boost the demand, but this is on a city
level, which is not what this paper is going to
research. When it is on an individual level, the will of
purchasing also makes a difference to the demand.
Both internal and external attributes of a house
affect a buyer’s purchasing will. Internal attributes
include the area, the layout of the room the floor it
locates etc. And the external attributes, namely the
location, which directly decides its traffic and
neighborhood quality, also weigh a lot.
Neighborhood quality includes the infrastructure
around and the security etc.
Considering the real estate market is a highly
complex and challenging one to understand, this
paper chooses one aspect to study. Given that
location and time period become determinants of
real estate prices (Huang, et al. 2010), the paper
decided to pick out a factor influenced by location as
this research objected. This research tries to figure
out whether the security of its neighborhood does
indeed affect the housing price.
Security is a broad concept, here this paper used
crime cases to study on. So, this research will
analyze the relationship between the crime situation
and housing price.
The paper chooses Manhattan’s housing price to
research on. For in the last 5 years, Manhattan was
still one of the most expensive places to live in the
world, while the owner-occupied housing unit rate
from 2015 to 2019 is 24.1%, which means there is at
least 75% of people in Manhattan who need to
purchase or rent houses.
Another reason to choose Manhattan is that the
housing price of Manhattan shows the opposite trend
compared to the crime rate. The crime data from
New York Police Department (NYPD) reflects that
Manhattan has the second-highest crime rate in five
regions of New York.
In this paper, this paper will focus on the
relationship between housing prices in Manhattan
and the crime rate of Manhattan from 2016 to 2017.
The paper believed that the environment will be
an important factor that will cast direct force on the
692
Guo, J., Ying, Z., Sun, Z. and Zhu, Y.
A Research on the Relevance of the Crime and the Housing Price Based on the Linear Regression Model.
DOI: 10.5220/0011754800003607
In Proceedings of the 1st International Conference on Public Management, Digital Economy and Internet Technology (ICPDI 2022), pages 692-698
ISBN: 978-989-758-620-0
Copyright
c
2023 by SCITEPRESS – Science and Technology Publications, Lda. Under CC license (CC BY-NC-ND 4.0)

buyers’ choice of the location of the real estate
which means that they shall have some direct
connection. To make the analysis more accurate and
realistic, the paper assumes that the total supply of
the house is the same in the short term. And all the
other factors that will influence the housing price are
the same in the short term. By comparing the
relevance within the range of the same neighborhood
among all the different neighborhoods, this paper
kept the population and the time at same level,
limiting the effect of the external factors to the
fullest minimize.
Figure 1: Change of the equilibrium output in a common
market.
Just as the graph is shown above (Varian 2004),
the supply level of houses in Manhattan at moment
t1 is S and the demand level is D1, which together
determine the local equilibrium house price as P1.
According to the conclusion that this paper make,
this paper can clearly find the crime rate is
negatively correlated with the level of house demand.
It is quite apparent that the crime will influence the
demand for the house, for the higher rate of the
crime means the more dangerous the neighborhood
would be. Then the demand decline which means
definitely the decline in the price of the house. As a
result, lower the crime rate will increase the total
demand of the house and consequently increase the
equilibrium prices of the house in the market.
Although it seems to be theoretically true and
logical, the research in this area is not to the full.
The crime rate will change through time and so as
the house price. It is worthwhile to work to continue
to focus on the relevance of the crime rate and the
house price, find problems and analyze the reasons.
This paper used python to clean the data by
dropping the useless data as well as matching the
value with time period and the boroughs. Data
processed fits into the linear regression model, in
which housing price is the dependent variable and
number of local crime case is the independent
variable. The negative relationship between the two
variables shows the negative effective the crime
level has on the house marketing. According to this
conclusion, this paper provides suggestions for three
parties concerned—the consumers, real estate
developers and investors and the government.
2 LITERATURE REVIEW
The rates of crime in different blocks will make a
difference to the local housing price in Manhattan.
Thaler (1978) (Thaler 1978) was the first one who
estimates the cost of crime with an implicit price
model using data from Rochester, NY. He finds that
the average property crime lowered house prices by
approximately $1930 in 1995 prices. Studies by
Hellman and Naroff (1979) (Hellman 1979) and
Rizzo (1979) (Rizzo 1979) used census tract data
from Boston and Chicago respectively and confirmed
that crime had a significant impact on house prices.
As a result, this paper believes that there is a
relationship between crime and housing prices. But
when studying whether the effect is negative or
positive, the researchers have given different ideas.
The researchers at first didn’t draw a clear
conclusion on the influence. Keith’s study (2009)
(Ihlanfeldt, Mayock 2009) gave the first critical
review on the extensive literature which has
researched the impact of crime on housing prices,
where he summarized 18 hedonic price studies that
have included neighborhood crime as one
explanatory variable, 14 of the studies found a
negative, relationship between one or more measures
of crime and house value and the other 4 studies did
not find a negative effect. Among all the studies,
only one (Case and Mayer 1996) found a positive
effect.
But as time passed, the researchers gradually
thinking the impact might be negative. Economists
have long documented the negative effects of
reported crime levels on housing prices, and this
effect was especially pronounced during the 1990s
(Hellman 1979, Pope 2012, Schwartz, Ellen, Susin,
and Voicu 2003). Just as Kumar in 2012 resulted,
the number of factors that influence the
identification of a favorable location easily runs into
a few hundred (including floor space area, crime in
the locality and so on) (Kumar, Talasila &
Pasumarthy 2021). Mateusz Tomal in 2020, using
the generalized ordered logit (gologit) model to
explore the factors influencing cluster formation.
And this research concluded that the level of crime
determined the membership of a given housing
market in a given cluster, attributed to bringing
A Research on the Relevance of the Crime and the Housing Price Based on the Linear Regression Model
693

about the classification of the homogeneous clusters
in terms of the size and quality of the housing stock
and price level (Tomal 2021). Researchers illustrated
the unable of the finding the connection might
because of the difficulty to identify different styles
of the crime. Allen (2001) reported that the impact
of the cost of crime on house prices is not uniform
throughout the market (Lynch, and David 2001).
According to Allen’s research, the seriousness of the
crime should be taken into consideration, besides the
crimes reported to the police divided by the
population.
Not only the seriousness of the crime was
regarded as one of the explanations, the kind of
crime also does. Keith selects 2 major categories of
crime —property and violent— finds only violent
crimes exert a meaningful influence upon
neighborhood housing values. Troy Austin (2008)
evaluating the influence of the combined robbery
and rape rates through models were estimated,
including one where selling price was log-
transformed but the distance to park was not, one
where both were log-transformed, a Box-Cox
regression, and a spatially adjusted regression (Troy
and Morgan Grove 2008). And they found that the
further the crime index value is from the threshold
value for a particular property, the steeper the
relationship is between park proximity and home
value.
To sum, crime is a hazard factor that is greatly
likely to hinder the safety of the local residents’ life
and property. So, the customers and the hosts will
both take this factor into their consideration. As a
hypothesis, this paper supposes that the higher the
crime rate the lower the house price will be.
From another perspective, Beck, B. and A.
Goldstein (2018) found the impact the house price
had on the crime rate. They conducted their research
basing on the doubt about the fact that the police
budget continues to grow even after the crime level
reach to the peak. Their data told the fact that the
increase of the economy relies more heavily on the
house price appreciation between the 1990s to the
2000s. And the budget of the police increases
correspondingly. And they made the conclusion that
the housing price growth and mortgage originations
in a city are associated with subsequent growth in
the city’s police expenditure (Troy and Morgan
Grove 2008). And also, it is quite clear that the
opposite direction of the change of the number of
police spending and the crime rate. While the police
spending increases, the crime rate drop dramatically.
Consequently, this paper believed that the house
price might cast some impacts on the crime rate
because of the important role the house price plays
in the housing market.
In summary, to confirm the relationship between
the house price and the criminal may provide some
information to the investors, the house buyers or the
hosts of the houses.
3 METHOD
3.1 Research Design
The subject of this study is the average house price in
the housing market in Manhattan, New York City
and its connection with the crime rate. This study
includes using python and R to build a simple linear
regression model to find the relationship between the
average house price and crime rate. The average
house prices in Manhattan will be classified by
communities and time to compare with crime rate
correspondingly. Manhattan, as the center of New
York, has a more remarkable effect between the
crime rate and the house price. And the premises this
paper chooses Manhattan are based on the following
factors. First of all, Manhattan is the district with the
highest population density among all the five
administrative districts of New York City. As a
result, the influence of the crime rate on the house
price would be more apparent and also applies to the
other districts, even the other cities. Secondly,
Manhattan is described as the economic and cultural
center of the whole United States. It is the central
business district of New York City. Manhattan's real
estate market is also one of the most expensive areas
in the world. Consequently, the fluctuation will cast
an impact on other house markets. Thirdly, it is
notable that the Manhattan is being interrupted by the
increasing number of the crime. Despite the dramatic
growth of the house price, the number of the crime is
growing as well. This result indicates that the house
price and crime rate show a negative correlation with
multiple reasons. Therefore, relation between the
crime and the house price is extremely helpful to give
the house hosts and the property developers to
choose a suitable price for their real estate.
3.2 Data Collection
While the data of the crime is from the New York
Police Department (NYPD), containing the content
of the gender, the type of the complaint, the location,
etc., the data of the house price is from the
government of the New York City. This attention is
paid to the fluctuation of both the crime rate and the
ICPDI 2022 - International Conference on Public Management, Digital Economy and Internet Technology
694

Table 1: Data of the crime and the house price in 2016.
Year 2016 sale price case number
count 39 39
mean 5491155 696.205128
std 8406232 723.948609
min 125000 1
25% 1983582 193.5
50% 3040352 415
75% 5178752 987
max 40710580 3231
Table 2: Data of the crime and the house price in 2017.
Year 2017 sale price case number
count 41 41
mean 3572567 581.6585
std 3593408 618.3382
min 400000 1
25% 1760632 172
50% 2613625 344
75% 4022578 899
max 21248470 2579
house price. The data take both the sales price and the
time into consideration. The crime database, on the
other hand, refers to the number and the place in New
York City. Table 1 describes some data of the time,
the average of the house and the time in 2016 while
Table 2 displays the data of 2017.
On the basis of the statistics, the conclusion can
be drawn that the price in the year 2016 and 2017 are
bot correspond with the change of the number of
3.1the crime in different blocks and neighborhoods.
The aim of this article is to identify the
relationship between crime and house price. In this
article, as a result of taking the same neighborhoods
as the research objects, this paperdo not need to
consider the population or the other factors that
would influence the house price. The selection of the
house price is determined by the blocks.
3.3 Data Analysis
The core idea of the method of analyzing data is to
separate the criminal cases and house prices in both
dataset by time and different neighborhoods in
Manhattan in New York City and using linear
regression model by python or R to find out if there is
any linear relationship between the total number of
criminal cases as well as the number of danger cases
and the mean value of house prices in a specific
neighborhood in Manhattan in New York City.
Moreover, creating some data visualizations about
criminal cases and the mean value of house prices.
The linear regression model is a branch of
regression models. Regression analysis is a statistical
technique for investigating and modeling the
relationship between variables (Hellman and Naroff
1979). Regression is the study of dependence, the
goal of regression is to summarize observed data as
simply, usefully and elegantly as possible (Huang, et
al. 2010). Since there is only one independent
variable in this research, which is the total number of
crime cases, hence the model that is used is called the
simple linear regression model.
𝑦 = 𝛽
+ 𝛽
𝑋 + 𝜀 ·························
1
Equation (1.1) is the basic equation of a simple
linear regression model, where the y is a dependent
variable, which means it will be affected by the
change of X. X is the independent variable, the value
of X will change by itself during the process. In this
research, housing prices in Manhattan will be a
dependent variable, the number of criminal cases
will be an independent variable.
𝐸
𝑦
|
𝑥
= 𝜇
𝑦
𝑥
= 𝐸
𝛽
+ 𝛽
𝑋 + 𝜀
= 𝛽
+ 𝛽
𝑋 ···
2
𝑉𝑎𝑟
𝑦
|
𝑥
= 𝜎
𝑦
𝑥
= 𝑉𝑎𝑟
𝛽
+ 𝛽
𝑋 + 𝜀
= 𝜎
···· (3)
The above two equations show that the expected
value of y and the variance while X is fixed, and the
linear regression model shows that the expected
value of y when X is changed. Hence the linear
regression model usually gives us a straight line that
A Research on the Relevance of the Crime and the Housing Price Based on the Linear Regression Model
695
represents the ideal situation, if the distribution of
data is approximately followed the line, this paper
can say that it can be proven that the fitting of a
linear regression model is successful.
It is clear to see if there is a relationship between
crime cases and house prices by looking at the plot
created by fitting a simple linear regression model.
Before fitting the linear regression model to this
data, it is required to do some work to it. There are
two datasets, one of them represents the total crime
cases in different neighborhoods in New York City
from 2016 to 2017, the other one represents the
house prices and other information from 2016 to
2019 in Manhattan, both data sets are from NYC
open data. Firstly, it is necessary to clean the
datasets before analyzing them, dropping the missing
value is one of the most effective ways to clean the
data, by using the. isnull () function in python, this
paper can drop the missing value in datasets.
The first thing is making sure that the time limit
for both data sets is the same, hence by using
python, it can be done to select data that from 2016
or 2017 in both data sets and automatically drop
those data from other years. The second thing is
setting the geographic range, by the main idea of this
research, it should be limited in Manhattan, hence by
using the unique function in python, it is convenient
to drop the neighborhoods that are not in Manhattan
by comparing the neighborhoods in the dataset to all
neighborhoods in Manhattan. After that, this paper
can write the function in python to calculate the
mean value of housing price and the total number of
criminal cases that are separated by different
neighborhoods in Manhattan.
Lastly, this paper can get a table that shows the
number of criminal cases and a corresponding mean
value of house price in different neighborhoods in
Manhattan, then it satisfies the condition to fit the
simple linear regression model, the plot that is
created by linear regression model shows that the
linear relationship between the mean value of
housing price and the total number of crime cases in
2016 and 2017 exists, which is as the number of
cases increases in a neighborhood, the mean value of
housing price in this neighborhood will decrease.
There are two outliers in these graphs, which are
midtown CBD area and financial in Manhattan,
which is pretty reasonable, since Manhattan is the
financial center of the world, the CBD area and
financial area in Manhattan have the same places as
The Bund in Shanghai, the housing prices in these
areas will be extremely higher than other
neighborhoods.
4 RESULTS
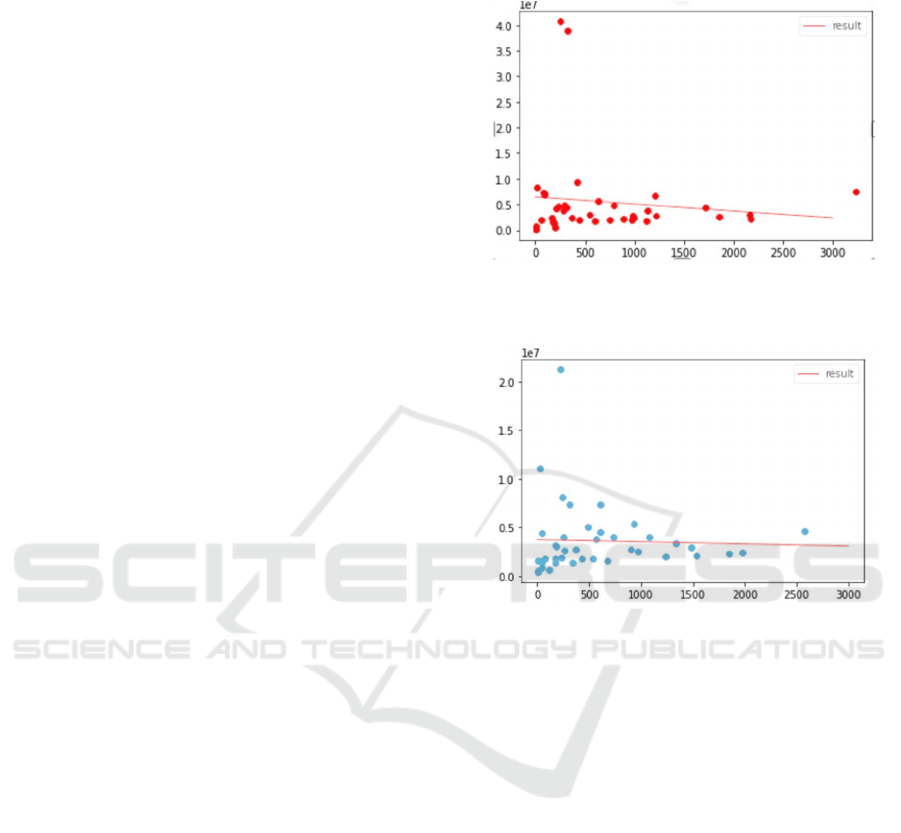
Figure 2: The corresponding point of the house price and
the criminal in 2016 and the regression line.
Figure 3: The corresponding points of the house price and
the criminal in 2017 and the regression line.
Using a Python-based linear regression method, the
correspondence between the number of crimes and
house prices in Manhattan during different time
periods in 2016 and 2017 were analyzed separately
(the left graph shows the results of the analysis in
2016 and the right graph in 2017). As can be seen in
both graphs, house prices and crime rates show a
negative correlation.
The Figure 4 below shows the relationship
between crime rates and housing prices by
combining all data from 2016 and 2017 and using
linear regression methods. From the analysis of the
above data, it can be concluded that there is an
approximate negative relationship between the crime
rate and house prices in Manhattan. This conclusion
is perfectly consistent with the theory of supply and
demand in the real estate market in the introduction.
ICPDI 2022 - International Conference on Public Management, Digital Economy and Internet Technology
696

Figure 4: The relationship between crime rates and
housing prices by combining all data from 2016 and 2017
5 DISCUSSION
Meanwhile, this finding has important practical
implications:
a. For consumers, this finding can provide
important information for consumers to
choose whether to buy a house and choose
the time to buy a house, so that they can make
a more rational decision;
b. For real estate developers and investors, this
finding provides a good entry point and
method to predict the prospects of the local
real estate market, as cities with lower crime
rates tend to have higher house prices and the
market will also be more prosperous and the
return on investment will be greater;
c. For the government, this finding helps the
government to play an economic control role
to assist the market in regulating housing
prices. Since the government has the ability
to obtain more complete and correct crime
rate data, the government can make certain
predictions about the future trend of local
house prices based on the trend of crime rate,
and when house prices may rise or fall too
fast, the government can reduce the
fluctuation of house prices through macro
policies in advance, thus avoiding the huge
losses that may be brought by market failure.
To make this analysis more accurate and realistic,
this paper assumes that the total supply of the house
was the same in the short term. And all the other
factors that will influence the housing price are the
same in the short term. By comparing the relevance
within the range of the same neighborhood among
all the different neighborhoods, this paper keeps the
population and the time the same level, limiting the
effect of the external factors to the fullest minimize.
Just as figure1 shown above, the supply level of
houses in Manhattan at moment t1 is S and the
demand level is D1, which together determine the
local equilibrium house price as P1. According to the
conclusion that this paper make, this paper can
clearly find the crime rate is negatively correlated
with the level of house demand. It is quite apparent
that the crime will influence the demand of the house,
for the higher rate of the crime means the more
dangerous the neighborhood would be. Then the
demand decline which means definitely the decline
of the price of the house. As a result, lower the crime
rate will increase the total demand of the house and
consequently increase the equilibrium prices of the
house in the market.
To a certain extent, this finding can help
consumers predict the trend of Manhattan house
prices, so that they can choose more rationally
whether and when to buy a house. For the
government, this finding can help the government
use macroeconomic policies or remain the trend of
the police expenditure between 1992 and 2010 (Beck
and Goldstein 2018) to regulate the local supply and
demand market and balance house prices, so as to
better perform its functions.
This paper still want to take a more step further
after considering the impact the crime has on the
house price. This paper believe the house price
would also has an influence on the crime rate. It is
clear that as the rise of the crime level will combine
with the decrease of the house price. So, naturally
this paper wants to control the crime level with the
intention to manage the house price. As a result, the
limitation of this research is that this paper does not
use the data which contains adequate samples to
make an accurate forecast. Furthermore, this paper
does not take the difference of the number of the
police and some other factors that will make a
difference to the house price.
6 CONCLUSIONS
The connection between the house price and the
crime level is apparent, while both of them will be
the factors that have influence on the other.
The increase of the house price provides the
space for the budget of the police to increase.
Consequently, the number of the police increase
because of the higher of the salary, representing the
effective restrain of the potential crime and the quick
A Research on the Relevance of the Crime and the Housing Price Based on the Linear Regression Model
697

crack-down on the immediate crime even when the
crime level continue to decrease yearly.
On the other hand, the crime level means the
threat of personal and property safety, reducing the
customers’ willing of the purchase, thus decreasing
the house price. It is no wonder the negative
effective the crime level has on the house marketing.
REFERENCES
Beck, B. and A. Goldstein, “Governing Through Police?
Housing Market Reliance, Welfare Retrenchment, and
Police Budgeting in an Era of Declining Crime.”
Social Forces, 96(3): p. 1183-1209, 2018.
Huang, B., et al., "Geographically and temporally
weighted regression for modeling spatio-temporal
variation in house prices." International Journal of
Geographical Information Science 24(3): 383-401,
2010.
Hal R.Varian, “Intermediate Microeconomics: A Modern
Approach, Ninth Edition”, 204-205, 2004.
Hellman, Daryl A. and Joel L. Naroff, “The impact of
crime on urban residential property values”, Urban
Studies 16, 105-112, 1979.
Kei Ihlanfeldt, Tom Mayock, “Crime and Housing Prices”,
Department of Economics and DeVoe Moore Center,
2009.
Kumar, E. S., Talasila, V., & Pasumarthy, R. “A novel
architecture to identify locations for Real Estate
Investment”. International Journal of Information
Management, 56, 17, 2021.
Lynch, Allen K. and David W. Rasmussen, “Measuring
the impact of crime on house prices”, Applied
Economics 33, 1981-1989, 2001.
Pope, Devin, and Jaren Pope. “Crime and Property Values:
Evidence from the 1990s Crime Drop.” Regional
Science and Urban Economics 42(1): 177–88. 2012.
Rizzo, Mario J., “The cost of crime to victims: An
empirical analysis”, Journal of Legal Studies 8,177-
205,1979.
Schwartz, Amy Ellen, Scott Susin, and Ioan Voicu. “Has
Falling Crime Driven New York City’s Real Estate
Boom?” Journal of Housing Research 14(1): 101–37.
2003.
Thaler, Richard, “A note on the value of crime control:
Evidence from the property market”, Journal of Urban
Economics 5, 137-145, 1978.
Tomal, “Housing market heterogeneity and cluster
formation: evidence from Poland.” International
Journal of Housing Markets and Analysis, ahead-of-
print(ahead-of-print), 2021.
Troy, Austin, and J. Morgan Grove. “Property values,
parks, and crime: A hedonic analysis in Baltimore,
MD.” Landscape and urban planning 87.3, 233-245,
2008.
ICPDI 2022 - International Conference on Public Management, Digital Economy and Internet Technology
698
