
A Meta-Analysis on the Impact of COVID-19 Lockdown on Air
Quality in High and Middle-Income Economies
Shuchen Zheng
Department of Economics, University of California, U.S.A.
Keywords: COVID-19, Lockdown, Air Quality.
Abstract: Various studies have shown the positive impact COVID-19 had on the environment, but findings on different
countries have yet to be reviewed together. The purpose of this paper is to perform a meta-analysis to provide
a cross-country comparison of the impact of COVID-19 lockdown on air quality. 9 papers were chosen,
providing data on at least 3 of the 6 major pollutants of some high-income and middle-income countries. A
meta-analysis is then conducted to pool the results of multiple studies together to see if there is an overall
trend. Data analysis demonstrates that the concentrations of PM
2.5
, PM
10
, NO
2
, SO
2
, and CO decreased and
the concentration of O
3
increased in most countries. Lockdown reduced air pollution significantly in many
countries, especially in middle-income economies. Research on what caused the more significant air pollution
reduction in middle-income economies could be an interesting topic for further studies.
1 INTRODUCTION
The COVID-19 pandemic is one of the worst public
health crises in modern history. The SARS-CoV-2
virus that caused the COVID-19 disease was first
detected in Wuhan, China, in December 2019 and
then spread rapidly across the globe. In an effort to
curb its transmission, countries imposed various
lockdown policies to restrict human and industrial
activities which cost the global economy negatively.
Nevertheless, lockdown brought benefits to the
environment. Numerous studies have investigated the
environmental effect of lockdown, but to my
knowledge, this is the first paper that summarizes and
compares relevant findings of both high-income and
middle-income countries.
Thus, in this paper, the author conducts a country-
level review of the environmental impact of COVID-
19 lockdown by comparing countries’ air pollution
data before and after the implementation of lockdown
policies in 2020. The purpose is to provide
researchers with a synopsis of the air quality change
during the lockdown and how the effect varied among
countries with different income levels. Researchers
can refer to this information for future studies related
to air quality and large-scale lockdown.
The paper covers 8 countries with different
lockdown timelines. India entered a nationwide
lockdown on March 25, 2020, and lasted until May 3
(Mahato, Pal, Ghosh, 2020). In China, lockdown
policies were imposed at the municipal level. The city
of Wuhan, where COVID-19 was initially
discovered, was the first to enter a lockdown on
January 23 (Shi, Brasseur, 2020). The Iraqi
government imposed a series of partial and total
lockdowns starting March 1, 2020 (Hashim, Al-
Naseri, Al-Maliki, Al-Ansari, 2021). Ecuador started
a lockdown on March 17, 2020 (Zalakeviciute,
Vasquez, Bayas, Buenano, Mejia, Zegarra, Diaz,
Lamb, 2020). In Thailand, lockdown went into effect
on March 26, 2020 (Stratoulias, Nuthammachot,
2020). European countries entered lockdown around
mid- or late March 2020 (Balasubramaniam,
Kanmanipappa, Shankarlal, Saravanan, 2020;
Collivignarelli, Abbà, Bertanza, Pedrazzani,
Ricciardi, Carnevale Miino, 2020; Jephcote, Hansell,
Adams, Gulliver, 2021; Velders, Willers, Wesseling,
den Elshout, van der Swaluw, Mooibroek, van
Ratingen, 2021). The United States has never
imposed a national-wide lockdown, but states set
their own policies. California was the first state to
issue a stay-at-home order starting March 19, 2020
(
AJMC, MJH Life Sciences and Center For
Biosimilars, 2020
). Similarly, Canadian provinces
and territories each followed a different timeline but
generally entered lockdown around mid- or late
March (Mashayekhi, Pavlovic, Racine, Moran,
Zheng, S.
A Meta-Analysis on the Impact of COVID-19 Lockdown on Air Quality in High and Middle-Income Economies.
DOI: 10.5220/0011753600003607
In Proceedings of the 1st International Conference on Public Management, Digital Economy and Internet Technology (ICPDI 2022), pages 641-646
ISBN: 978-989-758-620-0
Copyright
c
2023 by SCITEPRESS – Science and Technology Publications, Lda. Under CC license (CC BY-NC-ND 4.0)
641
Manseau, Duhamel, Katal, Miville, Niemi, Peng,
Sassi, Griffin, McLinden, 2021).
This review utilizes 6 major pollutants as
indicators of air quality: particulate matter with
diameters less than 2.5 μm (PM
2.5
) and 10 μm (PM
10
),
nitrogen dioxide (NO
2
), sulfur dioxide (SO
2
), carbon
monoxide (CO), and ozone (O
3
). PM is a pollutant
made up of a mixture of solid and liquid particles in
the air. Its main source includes combustion engines,
mining, and construction. Likewise, NO
2
and SO
2
are
released from the combustion of fossil fuels in
vehicles and other industrial activities. CO is another
pollutant emitted from vehicles as well as home
appliances such as furnaces, gas stoves, and dryers.
O
3
can be good or bad for the environment and human
health depending on where it is found in Earth’s
atmosphere. O
3
in Earth’s upper atmosphere protects
people from ultraviolet rays while ground-level
ozone is harmful. This type of O
3
is produced when
pollutants from vehicles and power plants chemically
react in the presence of sunlight (Gupta, Tomar,
Kumar, 2020).
Google Scholar was the source to search for the
published papers with the following searched
keywords: COVID-19, lockdown, and air quality.
The articles were reviewed in their entirety, and a full
article was obtained if they mentioned at least 3 of the
6 pollutants and indicated their trend. For each study,
the percentage change in each air pollutant’s
concentration after a country’s first lockdown was
identified and summarized in Table 1 and Table 2.
Section 2 discussed findings on air quality
changes in India, then presented findings on China,
Iraq, Ecuador, Thailand, Europe, the United States,
and Canada. Lastly, Section 3 provided a conclusion
and suggested topics for future studies.
2 RESULTS AND DISCUSSION
The initial Google Scholar search retrieved 20
articles. After excluding publications that showed no
percentage data on changes in pollutant
concentrations, 9 articles were identified. 4 papers
investigated the effect of lockdown on India’s air
quality, and the rest explored air quality changes in
China, Iraq, Ecuador, Thailand, Europe, the United
States, and Canada. All of these studies were
published between 2020 and 2021.
2.1 India
During India’s lockdown period, social gatherings
were prohibited, employees and students were asked
to work and learn from home, and transportation and
industrial activities were shut down with exceptions
to essential services. As a result, air pollution in
Indian cities significantly reduced.
Mahato, Pal et al. 2020 (Mahato, Pal, Ghosh,
2020) looked into the impact of lockdown on Delhi’s
air quality using 7 air pollutant parameters. They
obtained the daily or hourly concentrations of the
pollutants before and during the lockdown from the
Central Pollution Control Board (CPCB). The results
showed decreasing trends in the average daily
concentrations of PM
10
, PM
2.5
, NO
2
, SO
2
, and the
average 8-hour concentration of CO by 52%, 53%,
53%, 18%, and 30% respectively. There was a slight
increase in the average 8-hour concentration of O
3
by
0.78%.
A study conducted by Jain and Sharma 2020
(Jain, Sharma, 2020) focused on 5 Indian megacities.
Likewise, they retrieved air quality data from the
Central Pollution Control Board (CPCB) for five
criteria air pollutants, i.e. PM
2.5
, PM
10
, NO
2
, CO, and
O
3
, during both the pre-lockdown and lockdown
periods.
Table 1: Percentage change in air pollutant concentrations in India.
Country/City Author(s) and Year Results
Delhi, India
Mahato, Pal et al. 2020
(Mahato, Pal, Ghosh, 2020)
-53.11% in PM
2.5
, -51.84% in PM
10
, -52.68% in NO
2
, -17.97% in
SO
2
, -30.35% in CO, +0.78% in O
3
India (Delhi + 4 cities)
Jain and Sharma 2020
(Jain, Sharma, 2020)
-14-41% in PM
2.5
, -34-52% in PM
10
, -32-75% in NO
2
, -16-46%
in CO, +3-17% in O
3
in 4 cities but -11% in Bangalore
India (Delhi + 2 cities)
Kumari and Toshniwal 2020
(Kumari, Toshniwal, 2020)
Delhi: -49.34% in PM
2.5
, -55.01% in PM
10
, -60.11% in NO
2
, -
19.51% in SO
2
, +37.35% in O
3
Mumbai: -37.35% in PM
2.5
, -44.61% in PM
10
, -78.12% in NO
2
, -
39.01% in SO
2
, +20.65% in O
3
Singrauli: +15.27% in PM
2.5
, +58.85% in PM
10
, -12.50% in NO
2
,
+11.82% in SO
2
, +35.07% in O
3
India
Bray, Nahas, et al. 2021
(Bray, Nahas, et al. 2021)
-43% in PM
2.5
, -31% in PM
10
, -18% in NO
2
, -10% in CO, +17%
in O
3
ICPDI 2022 - International Conference on Public Management, Digital Economy and Internet Technology
642
The results observed that, compared to pre-
lockdown levels, the average daily concentrations of
PM
2.5
, PM
10
, NO
2
, and CO across the 5 cities
decreased by 14-41%, 34-52%, 32-75%, and 16-46%.
The trend for O
3
was not consistent for all cities as its
average daily concentration increased in 4 cities by 3-
17% but decreased in Bangalore by 11%.
Kumari and Toshniwal 2020 (Kumari, Toshniwal,
2020) investigated the concentrations of 5 key air
pollutants in 3 Indian cities. Air quality data were
collected locally before and after the lockdown from
March to April 2020. The changes were similar in
Delhi and Mumbai, where the average levels of PM
10
,
PM
2.5
, NO
2
, and SO
2
decreased by ~50%, ~43%,
~69%, ~29%, and the average level of O
3
increased
by ~29%. Singrauli, however, did not experience a
notable improvement in air quality.
Another study conducted by Bray, Nahas, et al.
2021 (Bray, Nahas, Battye, Aneja, 2021) examined
improvements in air quality in India using the
changes in the concentrations of 6 air pollutants. The
air quality data for each area were collected from
local satellite and ground-based measurements.
Compared to the pollutants’ average concentrations
from 2015 to 2019, PM
2.5
, PM
10
, NO
2
, and CO levels
decreased by 43%, 31%, 18%, and 10% respectively,
and O
3
levels increased by 17%.
Overall, as a result of restricted social and
industrial activities during the national-wide
lockdown, there have been significant reductions in
the concentrations of 5 of the 6 major air pollutants
PM
2.5
, PM
10
, NO
2
, CO, and SO
2
in India. On the
contrary, the concentration of O
3
increased because it
varies inversely with the concentration of NO
2
. When
averaging the results from these 4 studies, PM
2.5
concentration decreased by 33.1%, PM10
concentration decreased by 30.6%, NO
2
concentration decreased by 46.9%, CO decreased by
24.6%, SO
2
decreased by 16.2%, and O
3
increased by
17.4%.
2.2 Other Countries
Besides India, other countries had also experienced
notable improvements in air quality due to lockdown.
There were 6 articles with detailed findings on China,
Iraq, Ecuador, Thailand, Europe, the United States,
and Canada.
Shi and Brasseur 2020 (Shi, Brasseur, 2020)
quantified the changes in air quality in Wuhan, China,
using data from the China National Environmental
Monitoring Center for January and February 2020.
The researchers found that when comparing the mean
concentrations of 4 air pollutants before and after the
city went into lockdown on January 23, the mean
level of PM
2.5
, NO
2
, and CO decreased by 33%, 55%,
23% respectively. There was also a slight decline in
the average daily concentration of SO2. For O3, its
concentration increased by 108%.
Hashim, Al-Naseri, et al. 2020 (Hashim, Al-
Naseri, Al-Maliki, Al-Ansari, 2021) analyzed the
concentrations of 4 air pollutants, NO
2
, O
3
, PM
2.5
, and
PM
10
, in Baghdad, Iraq. The air pollution data were
collected from World Air Map for a period before
lockdown from January to February 2020 and 4
periods of partial and total lockdown from March to
July 2020. The post-lockdown pollution levels
reflected a straight decrease in the average daily
concentration of NO
2
by 20% and a straight increase
in O
3
by 525%. PM
2.5
concentration fluctuated
throughout the lockdown periods and resulted in a
Table 2: Percentage change in air pollutant concentrations in other countries.
Country/Cit
y
Author(s) and Yea
r
Results
Wuhan, China
Shi and Brasseur 2020
(
Shi, Brasseur, 2020
)
-33% in PM
2.5
, -55% in NO
2
, -23% in CO, +108% in O
3
Baghdad, Iraq
Hashim, Al-Naseri, et al. 2020
(Hashim, Al-Naseri, et al., 2020)
-3% in PM
2.5
, +56% in PM
10
, -20% in NO
2
, +525% in O
3
Quito, Ecuador
Zalakeviciute, Vasquez, et al. 2020
(Zalakeviciute, Vasquez, et al., 2020)
-29% in PM
2.5
, -68% in NO
2
, -48% in SO
2
, -38% in CO
Hat Yai, Thailand
Stratoulias and Nuthammachot 2020
(Stratoulias and Nuthammachot, 2020)
-21.8% in PM
2.5
, -22.9% in PM
10
, -33.7% in NO
2
, 9.9% in
CO, -12.5% in O
3
Europe
Bray, Nahas, et al. 2021
(Bray, Nahas, et al., 2021)
-15% in PM
2.5
, -10% in PM
10
, -32% in NO
2
, -10% in SO
2
,
-10% in CO, +7% in O
3
United States
-6% in PM
2.5
, -22% in NO
2
, -35% in SO
2
, +7% in CO,
+11% in O
3
Canada
Mashayekhi, Pavlovic, et al. 2021
(Mashayekhi, Pavlovic, et al., 2021)
-13.7% in PM
2.5
, -38.7% in NO
2
, +19.6% in O
3
A Meta-Analysis on the Impact of COVID-19 Lockdown on Air Quality in High and Middle-Income Economies
643
slight reduction of 3%. On the contrary, PM
10
only
decreased initially by 15% and ended in a 56% overall
increase.
Zalakeviciute, Vasquez, et al. 2020
(Zalakeviciute, Vasquez, Bayas, Buenano, Mejia,
Zegarra, Diaz, Lamb, 2020) investigated the impact
of restricted human activity on the air quality of
Ecuador’s capital Quito. The authors collected
atmospheric pollution data from monitoring stations
across Quito. The sampling period spanned 4 months
and was separated into 2 periods before and after the
national-wide lockdown. The results found a clear
reduction in the average concentrations of NO
2
, SO
2
,
CO, and PM
2.5
, where each dropped by 68%, 48%,
38%, and 29%.
Stratoulias and Nuthammachot 2020 (Shi,
Brasseur, 2020) investigated the temporal
development of atmospheric constituent
concentrations in Hat Yai, Thailand, from December
2019 to May 2020. Data on the concentrations of CO,
NO
2
, SO
2
, O
3
, PM
10
, and PM
2.5
were obtained from a
ground station in Hat Yai. When comparing the mean
of pollutant concentrations 3 weeks before and 3
weeks after lockdown, CO concentration increased
by 9.9%, NO2 concentration decreased by 33.7%, O3
concentration decreased by 12.5%, PM
2.5
concentration decreased by 21.8%, and PM
10
concentration decreased by 22.9%.
Bray, Nahas, et al. 2021 (Bray, Nahas, Battye,
Aneja, 2021) studied the changes in the
concentrations of 6 air pollutants in Europe and the
United States using satellite and ground-based
measurements. For Europe, when the average
concentrations of the pollutants in March 2020 were
compared to their average levels for the same month
from 2015 to 2019, the concentrations of PM
2.5
, PM
10
,
NO
2
, CO, and SO
2
decreased by 15%, 10%, 32%,
10%, and 10% respectively, and the concentration of
O
3
increased by 7%. For the United States, the
concentration of PM
2.5
decreased by 6%, NO
2
decreased by 22%, CO increased by 7%, SO
2
decreased by 35%, and O
3
increased by 11%.
Mashayekhi, Pavlovic, et al. 2021 (Mashayekhi,
Pavlovic, Moran, Manseau, Duhamel, Katal, Miville,
et al. 2021) investigated the impact of lockdown on
Canada’s 4 largest cities. Data on surface
concentrations of PM
2.5
, NO
2
, and O
3
were obtained
from local air quality monitoring networks under the
National Air Pollution Surveillance (NAPS) program.
Researchers compared the mean concentration of
each pollutant for the pre-lockdown and lockdown
periods in 2020 and found that PM
2.5
and NO
2
concentrations decreased by 13.75% and 38.7% and
O
3
concentration increased by 19.6%.
In summary, most of the countries reviewed in
Section 2, including India, experienced similar trends
in the changes of concentrations of the air pollutants:
PM
2.5
, PM
10
, NO
2
, CO, and SO
2
levels reduced, and
O
3
levels grew. However, there were a few
exceptions. Iraq, for example, underwent significant
growth in its PM
10
concentration (56%) instead of a
decrease. It also experienced much greater growth in
Table 3. Average percentage change in air pollutant concentrations in high-income countries.
Country Author(s) PM
2.5
PM
10
NO
2
CO O
3
SO
2
Europe
Bray, Nahas, et al. 2021(Bray, Nahas,
Battye, Aneja, 2021)
-15% -10% -32% -10% 7% -10%
United States -6% - -22% 7% 11% -35%
Canada
Mashayekhi, Pavlovic, et al. 2021
(Mashayekhi, Pavlovic, et al., 2021)
-13.7% - -38.7% - 19.6% -
Average -11.6% -10.0% -30.9% -1.5% 12.5% -22.5%
Table 4: Average percentage change in air pollutant concentrations in middle-income countries.
Country Author(s) PM
2.5
PM
10
NO
2
CO O
3
SO
2
India (averaged) -33.08% -30.56% -46.88% -24.59% 17.44% -16.17%
China
Shi and Brasseur 2020
(
Shi and Brasseur, 2020
)
-33% - -55% -23% 108% -
Iraq
Hashim, Al-Naseri, et al. 2020
(Hashim, Al-Naseri, et al., 2020)
-3% 56% -20% - 525% -
Ecuador
Zalakeviciute, Vasquez, et al. 2020
(Zalakeviciute, Vasquez, et al., 2020)
-29% - -68% -38% - -48%
Thailand
Stratoulias and Nuthammachot
2020 (Shi, Brasseur, 2020)
-21.8% -22.9% -33.7% 9.9% -12.5% -
Average -24.0% 0.8% -44.7% -18.9% 159.5% -32.1%
ICPDI 2022 - International Conference on Public Management, Digital Economy and Internet Technology
644
its O
3
concentration by more than 5 times while O
3
levels only increased by ~10-20% in other countries.
Thailand also observed an opposite trend in its O
3
concentration which declined by 12.5%. Besides, the
United States saw a slight increment in its CO
concentration instead of a reduction.
In addition, all the above countries were
categorized into high-income and middle-income
economies according to the World Bank’s country
classifications. The purpose was to examine whether
the two groups differed in their degrees of air quality
improvement. The high-income economies include
Europe, the United States, and Canada, and the
middle-income countries include India, China, Iraq,
Ecuador, and Thailand. Table 3 and Table 4 showed
each pollutant’s average percentage change in their
concentration and the results showed that the middle-
income economies experienced more substantial
reductions in air pollutants after lockdown. In
middle-income economies, the percentage changes in
PM
2.5
, NO
2
, CO, O
3
, and SO
2
were 2.1, 1.4, 12.6,
12.8, and 1.4 times greater than the percentage
changes in high-income economies. However, the
average PM
10
concentrations in middle-income
economies slightly increased compared to a decline
in high-income economies. This anomaly can be
explained by Iraq’s expansion in its PM
10
level during
the lockdown which was an outlier to PM
10
statistics,
skewing the average concentration to the right.
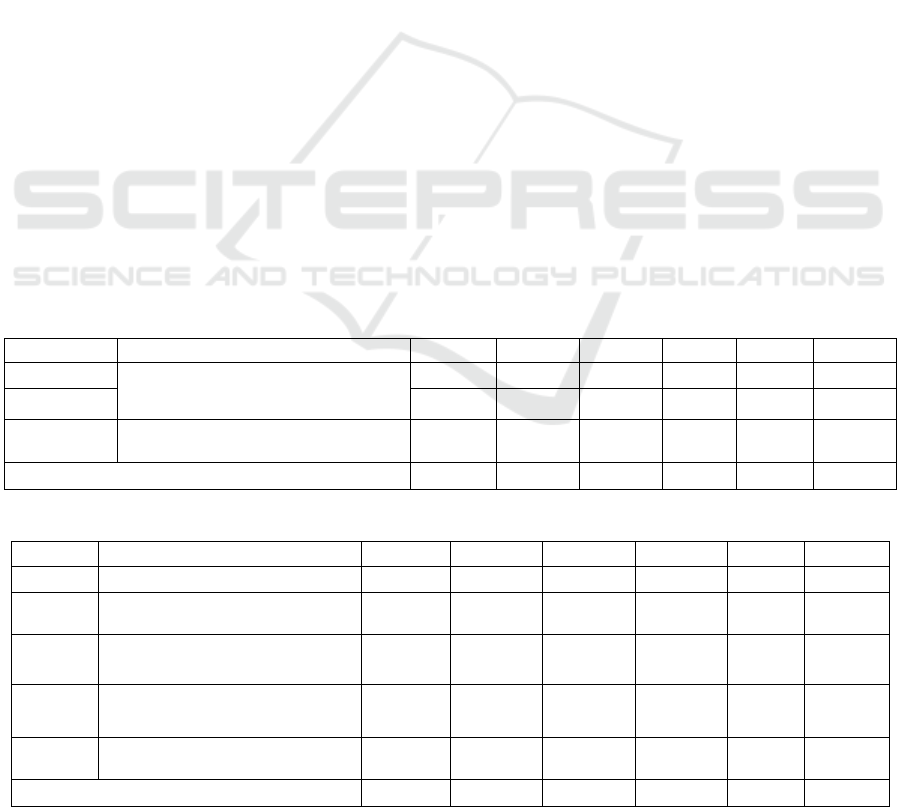
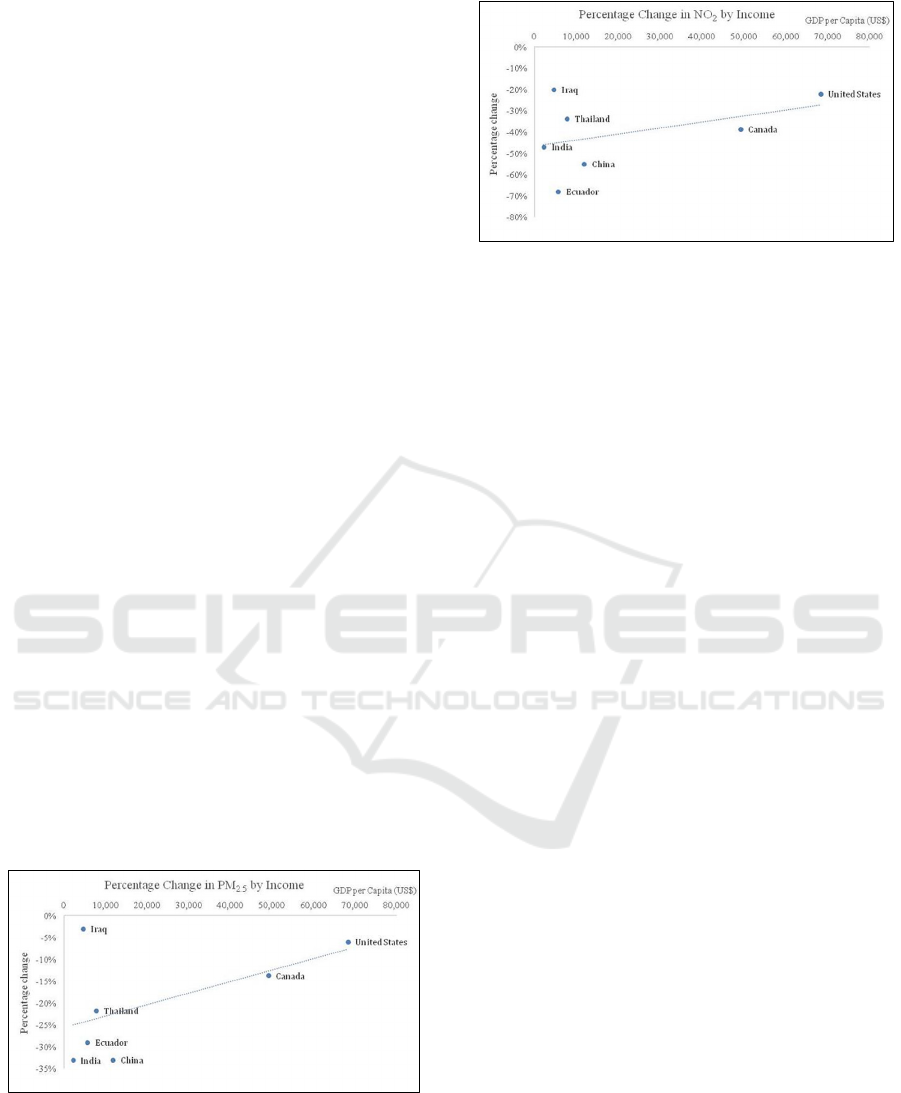
Figures 1 and 2 provide direct visualization of the
percentage change in air pollutants, i.e. PM
2.5
and
NO
2
, versus income of a country. The author uses the
2021 GDP per capita from IMF World Economic
Outlook database as an indicator of income level. In
general, middle-income economies see a more
significant improvement in air pollution than high-
income economies.
Figure 1: Scatter plot of percentage change in PM
2.5
by
GDP per capita.
Figure 2: Scatter plot of percentage change in NO2 by GDP
per capita.
Nevertheless, there is not yet a paper that
addresses why the percentage changes in air pollutant
concentrations in middle-income economies are
higher than those in high-income economies. One
implication, though, could be that not all sources of
pollution were affected by the lockdown; the ones
most impacted by lockdown could be more prevalent
in some countries but less common in others. For
example, PM
2.5
could originate from the burning of
fossil fuels and biomass or from windblown dust, but
lockdown could have impacted these sources to
different degrees depending on each country’s
situation (Narain, 2020). To find out the cause of the
difference in air quality changes in high-income and
middle-income economies, researchers could look
into the extent to which each pollutant’s sources are
affected in different countries for further studies.
3 CONCLUSION
COVID-19 lockdown produced notable
environmental benefits for countries around the
world. The impact was evident from a reduction in
the concentration of air pollutants such as PM
2.5
,
PM
10
, NO
2
, CO, and SO
2
and growth in the
concentration of O
3
in most countries. This result
suggests that the environment could self-recover
during a period of restricted human movements and
industrial activities. In addition, middle-income
economies experienced a greater percentage decrease
in air pollutant concentrations than high-income
economies, which could be the result of higher levels
of air pollution these countries originally endured or
differences in the countries’ major sources of
pollution, such as traffic, industrial, and natural.
Future research could explore how lockdown affected
different sources of air pollution in high-income and
middle-income countries to find out why the
difference in air quality change existed between the
A Meta-Analysis on the Impact of COVID-19 Lockdown on Air Quality in High and Middle-Income Economies
645

two groups. Researchers could also compare the
changes in air pollution levels against changes in
transportation, human movements, and domestic
production to find out how these factors contributed
to improvements in air quality.
REFERENCES
AJMC, MJH Life Sciences and Center for Biosimilars.
A Ti
meline of COVID-19 Developments in 2020.
https://www.ajmc.com/view/a-timeline-of-covid19-
developments-in-2020.
Balasubramaniam, D., Kanmanipappa, C., Shankarlal, B.,
& Saravanan, M. (2020) Assessing the impact of
lockdown in US, Italy and France– What are the
changes in air quality? Energy Sources, Part A:
Recovery, Utilization, and Environmental Effects.
Bray, C.D., Nahas, A., Battye, W.H., Aneja, V.P. (2021)
Impact of lockdown during the COVID-19 outbreak on
multi-scale air quality. Atmospheric Environment,
Volume 254.
Collivignarelli, M.C., Abbà, A., Bertanza, G., Pedrazzani,
R., Ricciardi, P., Carnevale Miino, M. (2020)
Lockdown for CoViD-2019 in Milan: What are the
effects on air quality?, Science of The Total
Environment, Volume 732.
Gupta, N., Tomar, A., Kumar, V. (2020) The Effect of
COVID-19 Lockdown on the Air Environment in India.
Global Journal of Environmental Science and
Management, vol. 6, no. Special Issue, 2020, pp. 31–
40.
Hashim, B.M., Al-Naseri, S.K., Al-Maliki, A., Al-Ansari,
N. (2021) Impact of COVID-19 lockdown on NO2, O3,
PM2.5 and PM10 concentrations and assessing air
quality changes in Baghdad, Iraq. Science of The Total
Environment, Volume 754.
International Monetary Fund. GDP per capita, current
prices, International Monetary Fund, https://
www .imf.org/external/datamapper/NGDPDPC@WE
O/OEMDC/ADVEC/WEOWORLD.
Jain, S. and Sharma, T. (2020) Social and Travel Lockdown
Impact Considering Coronavirus Disease (COVID-19)
on Air Quality in Megacities of India: Present Benefits,
Future Challenges and Way Forward. Aerosol Air Qual.
Res. 20: 1222–1236.
Jephcote, C., Hansell, A.L., Adams, K., Gulliver, J. (2021)
Changes in air quality during COVID-19 ‘lockdown’ in
the United Kingdom. Environmental Pollution, Volume
272.
Kumari, P. & Toshniwal, D. (2020) Impact of lockdown
measures during COVID-19 on air quality– A case
study of India. International Journal of Environmental
Health Research.
Mahato, S., Pal, S., Ghosh, K.G. (2020) Effect of lockdown
amid COVID-19 pandemic on air quality of the
megacity Delhi, India. Science of The Total
Environment, Volume 730.
Mashayekhi, R., Pavlovic, R., Racine, J., Moran, M.D.,
Manseau, P.M., Duhamel, A., Katal, A., Miville, J.,
Niemi, D., Peng, S.J., Sassi, M., Griffin, D., McLinden,
C.A. (2021) Isolating the impact of COVID-19
lockdown measures on urban air quality in Canada. Air
Qual Atmos Health.
Narain, U. (2020) Air pollution: Locked down BY COVID-
19 but not arrested. World Bank. https://www.wo
rldbank.org/en/news/immersive-story/2020/07/01/air-
pollution-locked-down-by-covid-19-but-not-arrested.
Shi, X., & Brasseur, G. P. (2020) The response in air quality
to the reduction of Chinese economic activities during
the COVID-19 outbreak. Geophysical Research Letters,
47.
Stratoulias, D., Nuthammachot, N. (2020) Air quality
development during the COVID-19 pandemic over a
medium-sized urban area in Thailand. Science of The
Total Environment, Volume 746.
Van der Geer, J., Hanraads, J.A.J., Lupton, R.A. (2010) The
art of writing a scientific article. J. Sci. Commun., 163:
51–59.
Velders, G.J.M., Willers, S.M., Wesseling, J., den Elshout,
S.V., van der Swaluw, E., Mooibroek, D., van Ratingen,
S. (2021) Improvements in air quality in the
Netherlands during the corona lockdown based on
observations and model simulations. Atmospheric
Environment, Volume 247.
World Bank Country and Lending Groups. World Bank
Data Help Desk, The World Bank Group,
https://datahelpdesk.worldbank.org/knowledgebase/art
icles/906519.
Zalakeviciute, R., Vasquez, R., Bayas, D., Buenano, A.,
Mejia, D., Zegarra, R., Diaz, A. and Lamb, B. (2020)
Drastic Improvements in Air Quality in Ecuador during
the COVID-19 Outbreak. Aerosol Air Qual. Res. 20:
1783–1792.
ICPDI 2022 - International Conference on Public Management, Digital Economy and Internet Technology
646
