
Simulation of Korea Composite Stock Price Index (KOSPI) for the
First 20 Years in the 21
st
Century Using Random Walk
Shaomin Yan and Guang Wu
*
National Engineering Research Center for Non-Food Biorefinery, State Key Laboratory of Non-Food Biomass and
Enzyme Technology, Guangxi Academy of Sciences, 98 Daling Road, Nanning, 530007, Guangxi, China
Keywords: KOSPI, Monte Carlo Simulation, Computational Finance, Random Walk.
Abstract: The Korea Composite Stock Price Index (KOSPI) can be regarded as a representative of the economic
development not only in South Korea but also in the emerging markets. Thus, the KOSPI and its derivatives
are the objective of many studies with models from
neural network model to stochastic model, whose
computation can be considered as a part of the computational finance,
in particular with the Monte Carlo
simulation. In this study, we apply the random walk model to simulate KOSPI for the first 20 years in the 21
st
century with division into five sub-periods because whether or not KOSPI follows a random walk is closely
related to the efficient market hypothesis (EMH). At first, we use the random walk in the 1/–1 format to
simulate KOSPI in a simplified format for 2020, and then we use the random walk in the decimal format to
simulate the real-life KOSPI for five different periods with increment of five-year data each. The simulation
is done using the Monte Carlo algorithm to generate random numbers with 100,000 seeds for each sub-period
of KOSPI simulation. The results show that the simulation can fit for short periods of time and can follow
KOSPI for a longer period of time.
1 INTRODUCTION
The Korea Composite Stock Price Index (KOSPI) is
an index, which represents the economic
development not only in South Korea but also in the
emerging markets. Consequently, it is the objective
of many studies (
Na, Sohn, 2011; Lee, Lim, 2011;
Kim, Kim, 2004; Kim, Bang, 2014
). Moreover, the
KOSPI derivatives are also the subject of studies (
Ko,
2012; Han, Guo, Ryu, Webb, 2012
).
Theoretically, the studies on KOSPI can help us
understand the human behaviour in stock market, the
underlined mechanisms for the KOSPI movement,
etc. Practically, the studies on KOSPI can help
investors and fund managers for better following
KOSPI and allocate their assets. Technically, various
mathematical and statistical models have been
applied to KOSPI studies, for example,
neural
network (Lee, Lim, 2011; Lee, Yoo, Jin, 2007) and
stochastic method (Kim, Kim, 2004). In this
context, we are particularly interested in the
random walk model, which was too used in KOSPI
studies (Aggarwal, 2018; Yoon, Kim, 2018).
To a broader sense, the issue of whether a stock
index follows a random walk is a disputing subject
for years with approval and disapproval in different
stock markets around the world (
Charles, Darné.
2009; Abraham, Seyyed, Alsakran, 2002; Gilmore,
McManus 2003
). As a matter of facts, most studies
using the statistical tests to determine the random
walk hypothesis, such as unit root tests (
Aggarwal,
2018
), but it is rare to use a random walk to simulate
a particular stock index. Nevertheless, both statistical
tests and real-life case simulation are equally
important because they reflect the same mechanism
from two different angles.
In this study, we use the random walk to directly
simulate the KOSPI for the first 20 years in the 21
st
century to add more pieces of evidence to this hot
debating issue from real-life simulation aspect.
2 MATERIALS AND METHODS
2.1 KOSPI Data
The daily KOSPI for the first 20 years in the 21
st
century is obtained from a branch of Yahoo Finance.
The KOSPI from 2001 to 2020 includes 4935 trading
days with open, high, low, close, adjusted close, and
Yan, S. and Wu, G.
Simulation of Korea Composite Stock Price Index (KOSPI) for the First 20 Years in the 21st Century Using Random Walk.
DOI: 10.5220/0011753200003607
In Proceedings of the 1st International Conference on Public Management, Digital Economy and Internet Technology (ICPDI 2022), pages 613-618
ISBN: 978-989-758-620-0
Copyright
c
2023 by SCITEPRESS – Science and Technology Publications, Lda. Under CC license (CC BY-NC-ND 4.0)
613

volume. We choose the daily close as our target for
random walk simulation. In order to get more
practical knowledge on the simulations, the 20-year
KOSPI are furthermore divided into five sub-groups:
there are 248 daily closes for 2020, 1220 for 2016-
2020, 2456 for 2011-2020, 3700 for 2006-2020, and
4935 for 2001-2020.
2.2 Random Walk Model
The classical random walk is a path obtained by
tossing a fair coin continuously (
Feller, 1968
): define
a side of coin and the other side of coin as 1 and –1,
record 1 or –1 for each tossing, and finally add the
recorded 1 and –1 together. In graphic presentation,
the x-axis is time (number of tossing of coin), and the
y-axis is the addition of recorded 1 and –1. As the
tossing of coin is a random event, its addition is a
series of random events, which construct a random
walk.
2.3 KOSPI in a Simplified Form
Similar to the consideration in random walk, the
KOSPI can also be presented in a similar way, i.e. if
KOSPI close in a day is higher or lower than that in
its previous day, we record 1 or –1 for the day, and
finally we add these 1 or –1 step-by-step along the
time course. Graphically, this operation will have the
x-axis as time and y-axis as the addition of recorded
1 or –1. Basically, this graph is a simplified KOSPI
when we consider only its up or down movement
daily. In this type of simulation studies, we use the
random walk to fit this simplified KOSPI profile.
2.4 Random Walk in Decimal Format
Although the classical random walk is just related to
1 or –1, we should expand its concept to decimals to
accommodate KOSPI because KOSPI is in decimal
form. Conceptually, this means that we toss an item
with many sides, each of which represents a number
in decimals. This is possible because we do not toss a
physical coin to generate a random walk but use a
computer to generate a series of random numbers,
which in fact are decimal numbers. Actually, we have
to round the decimal numbers to integer in order to
construct a classical random walk. Hence, we can
simply use a computer to generate a series of random
numbers, and then add them along the time course,
which is a random walk in decimal format useful to
compare with the real-life KOSPI.
2.5 Simulation
The simulation is done by means of computation with
random numbers generated by Monte-Carlo
algorism. The generated random numbers are
rounded to integers for simplified KOSPI and without
rounding for real-life KOPIS. Thereafter, the random
walk in both 1/–1 and decimal formats are compared
with the simplified and real-life KOSPI. This process
is continued until the random walks are very
approximate to the simplified and real-life KOSPI.
Because the Monte-Carlo algorism requires a seed to
generate a series of random numbers, 100 thousand
seeds ranging from 0 to 10 are used to find the best
simulation in this range.
3 RESULTS AND DISCUSSION
Table 1 explains how to perform the random walk
simulation in both 1/–1 and decimal formats.
Columns 1and 2 are the first 10 trading days in 2020
and their corresponding KOSPI close. Column 3 is a
list comparing whether a KOSPI close is larger or
smaller than that in its previous day in terms of the
1/–1 format. For example, 2176.46, the KOSPI close
on January 3, 2020 is larger than 2175.17, the KOSPI
close on January 2, 2020, so 1 is assigned to the
second cell in column 3. Column 4 is the addition of
each cell in column 3, resulting in a KOSPI in the 1/–
1 format. Column 5 is the random numbers generated
by Monte Carlo simulation using SigmaPlot (
SPSS
Inc., 1986-2001
) with a seed of 0.78654, which is the
best one of 100,000 seeds. Column 6 is the
comparison of whether the generated random number
is larger or smaller than its preceding random number
in the 1/–1 format. Column 7 is the classical random
walk by adding each number in column 6, and is
compared with column 4 for goodness-of-fit. The last
two columns describe how to perform a random walk
simulation in the decimal format. Column 8 is the
random numbers generated by Monte Carlo
simulation using SigmaPlot with one of the following
ten seeds: 7.30548, 7.30549, . . . 7.30557. The
command for generation of random numbers
generally includes the generated number of random
numbers, seed, upper and lower ranges, and we use
the standard deviation of the KOSPI close in 2020
upper and lower ranges. Column 9 is the random walk
in the decimal format by adding each random number
in column 8, and then we can compare the KOSPI
close value in column 2 with the random walk
simulation in column 9.
ICPDI 2022 - International Conference on Public Management, Digital Economy and Internet Technology
614
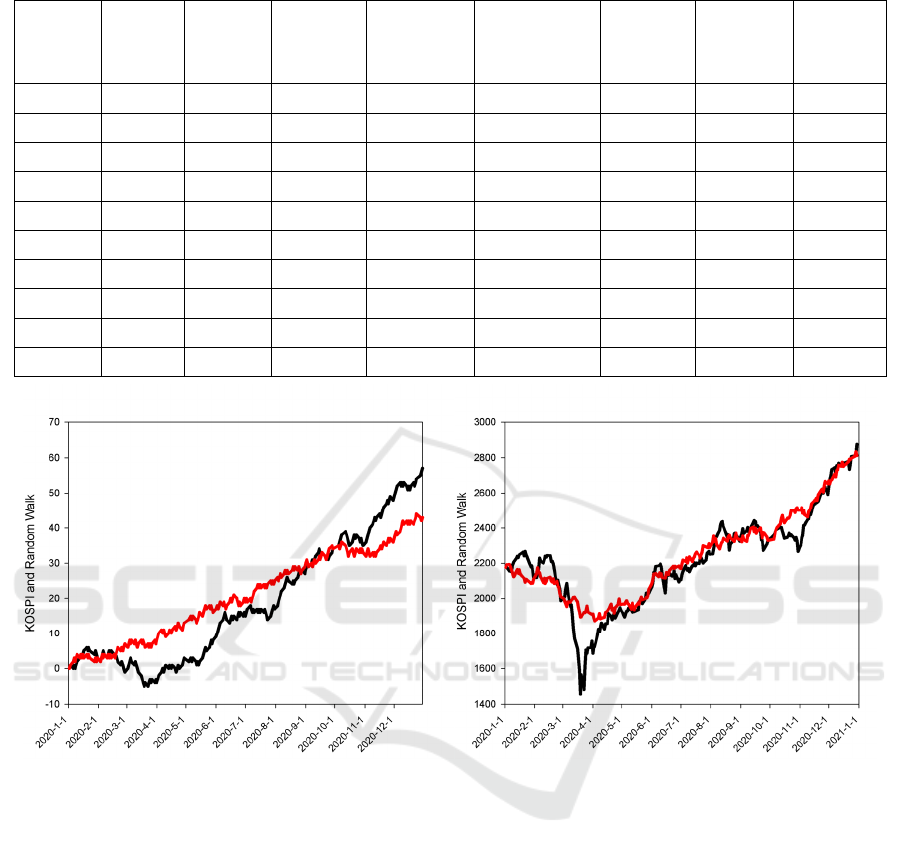
Table 1: Simplified KOSPI and random walks in 1/–1 and decimal formats.
Date
KOSPI
close
Compare
preceding
close
Random
w
alk in 1 or
–
1 format
Generated
random
number
Compare
preceding
random number
Random
w
alk in 1 or
–
1 format
Generated
random
number
Random
walk in
decimal
format
Jan 2, 2020 2175.17 –0.56759 18.76995
Jan 3, 2020 2176.46 1 1 0.10146 1 1 16.42251 2191.59
Jan 6, 2020 2155.07 –1 0 0.12706 1 2 0.70776 2192.3
Jan 7, 2020 2175.54 1 1 0.81422 1 3 –13.88377 2178.42
Jan 8, 2020 2151.31 –1 0 –0.32088 –1 2 –17.16913 2161.25
Jan 9, 2020 2186.45 1 1 0.03117 1 3 –16.45686 2144.79
J
an 10, 202
0
2206.39 1 2 0.66874 1 4 –22.7432 2122.05
J
an 13, 202
0
2229.26 1 3 –0.90877 –1 3 34.00345 2156.05
J
an 14, 202
0
2238.88 1 4 –0.33833 1 4 7.08048 2163.13
J
an 15, 202
0
2230.98 –1 3 –0.50799 –1 3 –20.66977 2142.46
Figure 1: KOSPI and random walk simulation. On the left panel, KOPIS in simplified format (black line) and random walk
in the 1/–1 format (red line) with a seed of 0.78654. On the right panel, KOSPI (black line) and random walk in the decimal
format with one of seeds: 7.30548, 7.30549, . . . 7.30557
Exactly following the steps demonstrated in Table
1, we can construct the random walk simulation of
KOSPI graphically for different periods of KOSPI
and its simulation..
The left panel of Figure 1 shows the simplified
KOSPI and its random walk simulation in the 1/–1
format. The initial several steps are exactly the same
as we show in from column 1 to column 6 in Table 1.
Because of simplification of KOSPI, the range in y-
axis is not as large as real-life KOSPI range. As seen
in the left panel, the random walk simulation
increases monotonically, but the simplified KOSPI
fluctuates largely for the first half year of 2020, which
marks the initial lockdown due to Covid-19
pandemic. Because the random walk goes either one
step up or one step down and there are 248 trading
days in 2020, the random walk theoretically has a
(½)
248
chance to fit the KOSPI without any difference
although this chance is extremely low.
The right panel of Figure 1 shows the real-life
KOSPI and its random walk simulation in decimal
format. Evidently, the random walk misses the big
fall of KOSPI in March 2020, which is totally due to
the unexpected Covid-19, on the one hand. On the
other hand, it does follow the uptrend from May 2020
until December 2020 although there is a small dip in
October. Interestingly, there are ten seeds, which can
produce the same results. This may suggest the
possibility that random number generator using
Monte Carlo algorism is not sensitive to the
increment at 0.00001. However, this possibility may
not be valid because the increment of 0.00001 does
Simulation of Korea Composite Stock Price Index (KOSPI) for the First 20 Years in the 21st Century Using Random Walk
615
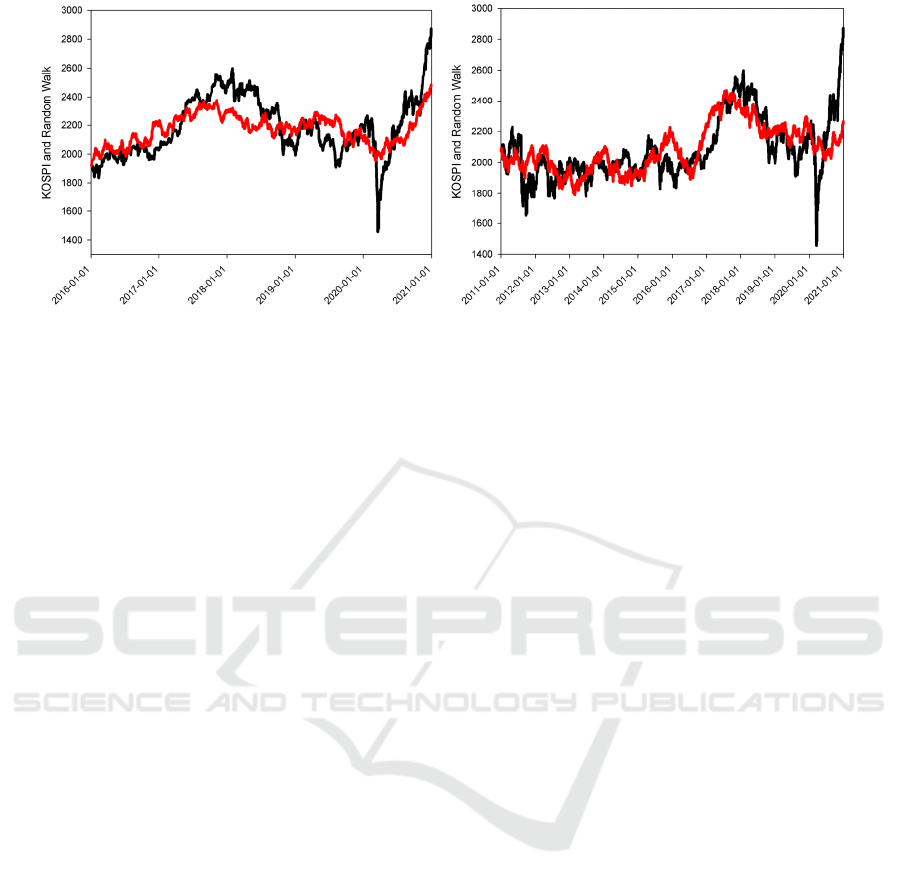
Figure 2: KOSPI (black line) and random walk simulation (red line) for the period from 2016 to 2020 with seed of 1.32353
(left panel), and for the period from 2011 to 2020 with one of seeds: 7.73709, 7.73710, . . . 7.73718 (right panel).
have effects in other simulations. In fact, we used the
increment of 0.000001 in the past, but we frequently
find the same result from a series of seeds with
increment of 0.000001. Therefore, we choose the
increment of 0.00001 in our recent studies to reduce
the computational time.
Comparing two panels in Figure 1, we sometimes
feel that we can phase out the random walk
simulation in the 1/–1 format in the future because it
does have a certain chance to occur, i.e. (½)
248
, but
the random walk in decimal format also has a certain
possibility for a perfect fit. Technologically, we have
no need to pay great attention to the upper and lower
ranges in the random walk simulation in the 1/–1
format because the generated random numbers
should be rounded after comparison. In contrast, the
choice of upper and lower ranges becomes difficult
when there is an unexpected rise or fall in KOSPI
because these rises and falls do not rend a big change
in standard deviation, which are used in our studies.
The left panel in Figure 2 illustrates the random
walk simulation on KOSPI for five years. There are
two periods of uptrend, a slow one and a rapid one.
For the slow uptrend from 2016 to 2018, the random
walk simulation still can follow its paces step-by-
step. For the rapid uptrend from April 2020 to
December 2020, the random walk does not move fast
enough to catch up with the final phase of uptrend in
December 2020.
The right panel in Figure 2 depicts the random
walk simulation on KOSPI for ten years. As seen in
this panel, the KOSPI holds on the relatively small
fluctuations from 2011 to the middle of 2017. For this
period of time, the random walk simulation can
follow the trend moving horizontally, and even
follow the uptrend in 2018, but fails to follow the
sharp uptrend at the end of 2020. When looking the
three real-life random walk simulations from the right
panel in Figure 1 to left and right panels in Figure 2,
we can see a general tendency, that is, it becomes
harder and harder to catch up with the final uptrend
in the end of 2020.
Similar to what happens in the right panel in
Figure 1, there are also ten seeds in the right panel in
Figure 2, which generate the same result. More
importantly, there is no big difference between the
seeds for the right panel in Figure 1 and the seeds for
the right panel in Figure 2. These are very suggestive
because it implicates that there is a possibility to use
a seed to simulate two periods of KOSPI opening up
the possibility to predict the future KOSPI movement
using the same seed.
The left panel in Figure 3 pictures the random
walk simulation on KOSPI for fifteen years from
2006 to 2020. For this period of time, we can see that
KOSPI actually goes up although there are two big
falls in 2008, which is the financial crisis, and in
2020, which is the Covid-19 pandemic. Clearly, the
random walk cannot reach as deep as the real-life
KOSPI in these two big falls.
The right panel in Figure 3 describes the random
walk simulation on KOSPI for twenty years from
2001 to 2020. For this longest period of simulation in
this study, the KOSPI goes up from 500 approaching
to 3000. The small fluctuations appear insignificant
in such a long scale, however, their contribution to
the statistical description is large because they
significantly decrease the standard deviation.
Therefore, it is impossible for Month Carlo algorithm
to generate very large random numbers to cope with
the two great falls in 2008 and 2020, and
subsequently the biggest jump at the end of 2020.
Indeed, the simulation in the right panel of Figure 3
is encouraging because it does follow the KOSPI
trend for 20 years.
ICPDI 2022 - International Conference on Public Management, Digital Economy and Internet Technology
616
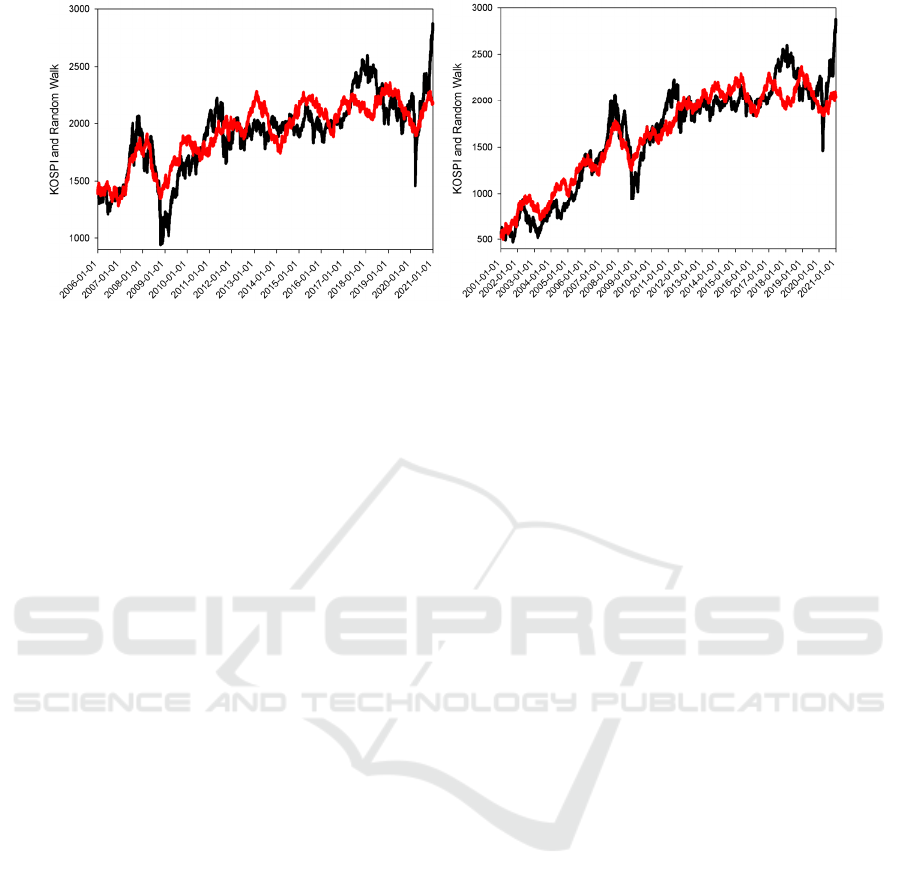
Figure 3: KOSPI (black line) and random walk simulation (red line) for the period from 2006 to 2020 with a seed of 2.62207
(left panel), and for the period from 2001 to 2020 with a seed of 0.03275 (right panel).
The issue of whether or not a stock market index
or an individual stock follows a random walk is the
objective in many studies, but the difficulty is that
random walk cannot reveal the underlined
mechanism in stock market. Nevertheless,
randomness can be the underlined mechanism for
stock movement, not only because various known
and unknown factors affect the movement of stock
market, but also randomness is considered to stay at
the heart of nature (
Everitt, 1999
). However, the
simulation actually does a phenomenological job. In
fact, regression is also a phenomenological tool to
build a possible and potential cause-effect
relationship, but random walk does link any cause to
the effect. Yet, the random walk has few parameters,
i.e. seed, upper and lower ranges, so it may
encompass uncountable known and unknown factors,
which can be considered random because we cannot
define their cause-effect relationship.
Oftentimes, the issue of whether or not a stock
index can be described by a random walk model is
related closely to the efficient market hypothesis
(EMH), especially, the weak form market efficiency.
The knowledge gap is progressively filled up with
various statistical tests as well as the real-life random
walk simulations. The issue of whether or not the
simulation is dependent on time length is yet to be
proved because simulations for different period of
time result in different results.
In foreseeable future, we hope to solve several
problems with random walk simulation, for example,
how to choose suitable upper/lower ranges, whether
to use a percentage will be more helpful than the real-
life data, etc, At any rate, much work needs to be done
in the future.
4 CONCLUSION
In this study, we use the random walk model to
simulate KOSPI for the first 20 years in the 21
st
century because the hypothesis of whether a stock
index can be described using a random walk model is
still unsolved. Therefore, it is necessary to conduct
this type of studies to different stock indices and
different individual stock. In fact, statistical tests on
random walk go along this way. Our results
demonstrate that the random walk model can simulate
at least the general trend of KOSPI, but far from
accurately and precisely follow the real-life KOSPI
although there is an extremely small possibility to do
so. We wish to continue our studies along this line in
near future.
ACKNOWLEDGMENTS
The study was supported by the Scientific
Development Fund of Guangxi Academy of Sciences
(2021YFJ1203).
REFERENCES
Abraham, A., Seyyed, F.J., Alsakran, S.A. (2002)
Testing the random walk behavior and efficiency of
the Gulf stock markets. Finan. Rev., 37: 469-480.
Aggarwal, D. (2018) Random walk model and
asymmetric effect in Korean composite stock price
index. Afro-Asian J. Finan. Account., 8: 85-104.
Charles, A., Darné. O. (2009) The random walk
hypothesis for Chinese stock markets: evidence from
variance ratio tests. Econ. Syst., 33: 2.
Simulation of Korea Composite Stock Price Index (KOSPI) for the First 20 Years in the 21st Century Using Random Walk
617

Everitt, B.S. (1999) Chance Rules: An Informal Guide to
Probability, Risk, and Statistics. Springer, New York.
Feller, W. (1968) An Introduction to Probability Theory
and Its Applications. 3
rd
Edition, John Wiley, New
York.
Gilmore, C.G., McManus G.M. (2003) Random walk
and efficiency tests of central European equity
markets. Manag. Finan., 29: 42-61.
Han, Q., Guo, B., Ryu, D., Webb, R.I. (2012)
Asymmetric and negative return-volatility
relationship: The case of the VKOSPI. Invest.
Analysts J., 41: 69-78.
Kim, W., Bang, S. (2014) Regime-dependent
characteristics of KOSPI return.
Commun Stat Appl
Methods., 21:
501-512.
Kim, I.J., Kim, S. (2004) Empirical comparison of
alternative stochastic volatility option pricing
models: Evidence from Korean KOSPI 200 index
options market. Pacific-Basin Finan. J., 12: 117-142.
Ko, K. (2012) Who wins in the money game? The case
of KOSPI 200 futures. Pacific-Basin Finan. J., 20:
843-856.
Lee, S.H., Lim, J.S. (2011) Forecasting KOSPI based on
a neural network with weighted fuzzy membership
functions. Expert Syst. Appl., 38: 4259-4263.
Lee, K., Yoo, S., Jin, J.J. (2007) Neural network model
vs. SARIMA model in forecasting Korean Stock
Price Index (KOSPI). Issues Inform. Syst., 8: 372-
378.
Na, S.H., Sohn, Y.S. (2011) Forecasting changes in
Korea Composite Stock Price Index (KOSPI) using
association rules. Expert Syst. Appl., 38: 9046–9049.
SPSS Inc., (1986-2001) SigmaPlot 2002 for Windows
Version 8.02.
Yoon, I.H., Kim, Y.M. (2018) A study on weak-form
efficiency of KOSPI stock market after the recent
expansion of daily price limits. J. Int. Trade
Commerce, 14: 73-88.
ICPDI 2022 - International Conference on Public Management, Digital Economy and Internet Technology
618
