
Research and Application of Prosperity Index of Tomato Industry
Chain Based on Power Big Data Analysis
Jun Ma
*
, Yaping Zhao and Jing Pan
State Grid Xinjiang Electric Power Co., LTD. Changji Power Supply Company, Changji, Xinjiang, 831100, China
Keywords: Big Data, Cloud Computing, Power Consumption Information, Data Collection, Data Grip Analysis.
Abstract: In order to solve the serious performance and scalability bottlenecks faced by power data analysis system in
the era of big data, and better meet the needs of production, marketing and other systems, the advantages of
cloud computing technology are analyzed, and the architecture and key technologies of power big data anal-
ysis system based on cloud computing are proposed. Based on Hadoop and hive, a multi-dimensional index
and SQL are designed for the characteristics of power big data Automatic translation tools and hybrid storage
model supporting data update are three performance improvement technologies to realize the upgrading and
optimization of traditional power data analysis system. The actual deployment experience of Zhejiang electric
power information acquisition system shows that compared with the traditional electric power data analysis
system, the system achieves an average performance advantage of 5 times at 1/8 of the hardware cost. It
proves that cloud computing technology can significantly improve the performance of power big data query
and analysis and effectively reduce costs.
1 INTRODUCTION
Smart grid technology is the deep integration of tra-
ditional power technology and information, control,
automation and other technologies. Through collect-
ing a large amount of data in power generation, trans-
mission, distribution, power consumption, dispatch-
ing, marketing and other links, in-depth analysis and
mining are used to guide the decision-making and op-
timization of each link, so as to improve the produc-
tion efficiency of power enterprises, enhance the sta-
bility of power grid operation, and better meet the
needs of power customers (Cai, Cao, Xu, et al., 2021).
With the continuous promotion of the construc-
tion of smart grid, the scale of smart grid is expanding
day by day. Various heterogeneous distributed data
sources such as smart meters, sensors and information
systems continue to generate massive data, which is
called power big data. Power big data is regarded as
an important support for power grid intelligence. For
example, installing sensors on power generation
equipment or transmission equipment and collecting
equipment operation status, external temperature,
wind and other information can dynamically adjust
the equipment operation status and give full play to
the maximum efficiency of the equipment. Due to the
fundamental role of power big data, the collection,
transmission, storage, processing and mining of
power big data has become an important content of
smart grid research and construction (Zhang, Zhao,
Li, 2020).
At present, most power data analysis systems are
based on relational databases, which have the disad-
vantages of slow analysis speed and poor scalability.
It is difficult to meet the data storage and analysis re-
quirements of power big data in the era of smart grid,
and has become the bottleneck of smart grid construc-
tion. Aiming at the common requirements of data
analysis and application in smart grid and the typical
characteristics of power big data, this paper proposes
a set of power big data analysis platform based on
cloud computing. The platform has been actually de-
ployed and put into operation in State Grid Zhejiang
electric power company, and achieved good results.
2 POWER BIG DATA AND ITS
CHARACTERISTICS
Power big data refers to a large amount of data gen-
erated by smart grid in power generation, distribution,
transmission, marketing and management. It is gener-
ated by a large number of sensors deployed on various
devices, smart meters installed in the homes of power
Ma, J., Zhao, Y. and Pan, J.
Research and Application of Prosperity Index of Tomato Industry Chain Based on Power Big Data Analysis.
DOI: 10.5220/0011751900003607
In Proceedings of the 1st International Conference on Public Management, Digital Economy and Internet Technology (ICPDI 2022), pages 555-559
ISBN: 978-989-758-620-0
Copyright
c
2023 by SCITEPRESS – Science and Technology Publications, Lda. Under CC license (CC BY-NC-ND 4.0)
555

users, customer feedback collected by the marketing
system and other data sources and converged to the
centralized data center for unified storage manage-
ment (Tang, Ding, 2021).
Power big data is one of the supporting elements
for building a stable, reliable, efficient and energy-
saving smart grid. By analyzing power big data, we
can improve the lean management level of smart grid,
formulate a more scientific production plan, optimize
energy transmission scheduling, and establish a more
accurate user behavior model.
Power big data has the 3V characteristics of large
volume, many types and fast speed, which are specif-
ically reflected in:
(1) Large volume. With the in-depth promotion of
the construction of smart grid, terminal data collec-
tion equipment such as device sensors and smart me-
ters have been intensively deployed, and the scale of
collected data will increase exponentially, reaching
the TB or even Pb level. Taking Zhejiang Province as
an example, there are 22million power users in the
province. If all smart meters are installed, according
to the requirements of State Grid Corporation of
China to collect one piece of power consumption in-
formation every 15 minutes, 2.1 billion pieces of
power consumption records will be added every day
(Wang, Bai, Dong, et al., 2021).
(2) There are many types. In addition to the tradi-
tional structured data, production management, mar-
keting and other systems produce a large number of
semi-structured and unstructured data such as audio
and video materials. The diversity of data types re-
quires the diversity of storage and processing technol-
ogies. This paper focuses on the data acquisition and
processing system of power consumption infor-
mation, which still focuses on structured data, and
does not discuss the processing of semi-structured
and unstructured data.
(3) Speed. The collection and processing of power
big data have extremely fast speed. The surge in the
number of terminals requires the storage system to
meet the requirements of high-throughput data access
hundreds of thousands of times per second.
In addition, power big data also has some unique
characteristics. According to the "white paper on the
development of power big data in China (2013)",
power big data also has the characteristics of 3E;
(1) Data is energy. Power big data contains ex-
tremely important information such as users' power
consumption rules and optimal transmission schedul-
ing strategies. This information plays a unique and
huge role in reasonably arranging production and re-
ducing energy consumption losses, and promotes the
reduction of energy consumption and sustainable de-
velopment of the power grid, thus embodying the
characteristics of data as energy.
(2) Data is exchange. Through the interaction and
aggregation with big data of other industries, and in-
depth mining and analysis, the information contained
in power big data has extremely important reference
value for the country's high-level decision-making
and economic situation judgement (Chen, Li, Cui et
al., 2019).
(3) Data is empathy. Power big data provides a
new way for State Grid Corporation of China to
timely and accurately discover and meet the needs of
users. Empathy is empathy. Both production and mar-
keting rely on power big data to provide more high-
quality, safe and reliable power services to the major-
ity of power users, so as to achieve the goal of com-
mon development.
3 CLOUD COMPUTING AND ITS
ADVANTAGES
Cloud computing is a new large-scale distributed
computing model, which originates from the demand
of Internet companies for a large number of compu-
ting and storage resources and the pursuit of scalabil-
ity, high performance, high availability and other
characteristics. Cloud computing aggregates a large
number of distributed and heterogeneous resources,
providing users with powerful massive data storage
and computing capabilities. Cloud computing pro-
vides users with on-demand services through virtual-
ization, dynamic resource allocation and other tech-
nologies, avoids resource waste and competition, and
improves resource utilization and application perfor-
mance. Cloud computing provides horizontal scaling
and dynamic load balancing capabilities, that is,
Cloud Computing supports adding new nodes to the
data center at runtime, and the system will automati-
cally migrate part of the load to the new nodes, and
maintain the load balance between nodes, thereby en-
hancing the business carrying capacity of the whole
system. Resources in the cloud computing environ-
ment are organized in the form of data centers. A data
center contains thousands or even tens of thousands
of nodes. Nodes are interconnected through high-
speed networks to jointly provide users with compu-
ting and storage resources. Cloud computing has de-
veloped very rapidly. At present, it has gone out of
the laboratory, and a series of mature products and
technologies have emerged. In addition to Internet
ICPDI 2022 - International Conference on Public Management, Digital Economy and Internet Technology
556

companies, it has been widely used in many tradi-
tional industries, such as telecommunications, retail,
finance and so on.
4 POWER BIG DATA ANALYSIS
SYSTEM BASED ON CLOUD
COMPUTING
The big data analysis technology based on cloud com-
puting has a relatively complete reference architec-
ture and software implementation, and has been ap-
plied in some industries. However, most of these sys-
tems come from the Internet industry, and their de-
sign, implementation and functional characteristics
fully reflect the needs and characteristics of Internet
big data and its business. When applied to industries
other than the Internet, the general practice is to cus-
tomize, develop and optimize the existing system
based on the full and detailed analysis of the big data
characteristics and business needs of the industry.
There are three main differences between power
big data and Internet big data.
(1) In the Internet scenario, typical big data appli-
cations need to scan the entire data set sequentially.
Therefore, the distributed parallel big data analysis
system hive or impala does not provide good support
for indexing; In power big data analysis, multi-di-
mensional region query is very common. Because
there is no index, it will lead to access a large number
of unnecessary data and significantly reduce the per-
formance of query execution. It is necessary to design
an appropriate index structure and corresponding data
retrieval mechanism according to the characteristics
of multi-dimensional region query.
(2) The typical feature of Internet big data is
"write once and read many times". For this data fea-
ture, both distributed file system (HDFS) and hive do
not provide data rewriting (update or delete) mecha-
nism, and the purpose of rewriting data can only be
achieved indirectly by covering all existing data. In
the power big data business scenario, there are a large
number of data rewriting statements. Executing these
queries in a way that covers the existing data will lead
to the problem of low execution efficiency. There-
fore, there is an urgent need to provide a data rewrit-
ing mechanism in the existing system.
(3) Big data query language designed by Internet
companies according to their own business needs. For
example, HQL is only a subset of SQL, while power
data analysis systems are mostly written in standard
SQL language, which requires a lot of manpower and
time to translate tens of thousands of existing SQL
statements into equivalent HQL statements. There-
fore, it is necessary to design a tool to automatically
translate SQL language into HQL language, so as to
improve the migration speed of legacy applications
and realize the seamless and smooth migration of
power data analysis business.
Based on the above analysis, in order to meet the
needs of smart grid for in-depth analysis and mining
of power big data, aiming at the typical characteristics
of power big data and its business logic, combined
with the latest progress of cloud computing technol-
ogy and actual industry deployment experience, a
power big data analysis system based on Cloud Com-
puting is developed.
The system is based on the distributed parallel
computing framework (Hadoop), uses hive as the data
analysis software, and develops key technologies
such as multidimensional index based on grid file,
SQL to HQL automatic translation tool based on
query rewriting, and hybrid storage model supporting
data update according to the characteristics of power
big data, which comprehensively enhances the perfor-
mance and ease of use of hive. This system has been
successfully applied in Zhejiang electric power con-
sumption information acquisition system. Compared
with the original system based on relational database,
it greatly improves the system performance and re-
duces the system cost.
5 APPLICATION EXAMPLES
This paper uses Changji tomato enterprise as a case
for implementation analysis. Collect the quarterly
data of the primary indicators from 2019 to 2021, se-
lect the industry sales revenue as the benchmark indi-
cator, and obtain the leading and consistent indicators
and the weight of each indicator through the analysis
of the process mentioned above.
From the perspective of enterprise prosperity
analysis, COFCO Tunhe Manas tomato products Co.,
Ltd. had the largest growth rate in the first half of
2021, and Xinjiang Yanyang tiantianhu tomato prod-
ucts Co., Ltd. had the largest growth rate in the second
half of 2020; However, the prosperity index of Xin-
jiang Zhongji Red Tomato Industry Co., Ltd. fang-
caohu branch and Xinjiang Tometo tomato science
and Technology Development Co., Ltd. in the first
half of 2021 and the second half of 2020 showed a
significant negative growth, which should be brought
to the attention of relevant government departments.
In 2019, the average prosperity index of Changji
Research and Application of Prosperity Index of Tomato Industry Chain Based on Power Big Data Analysis
557
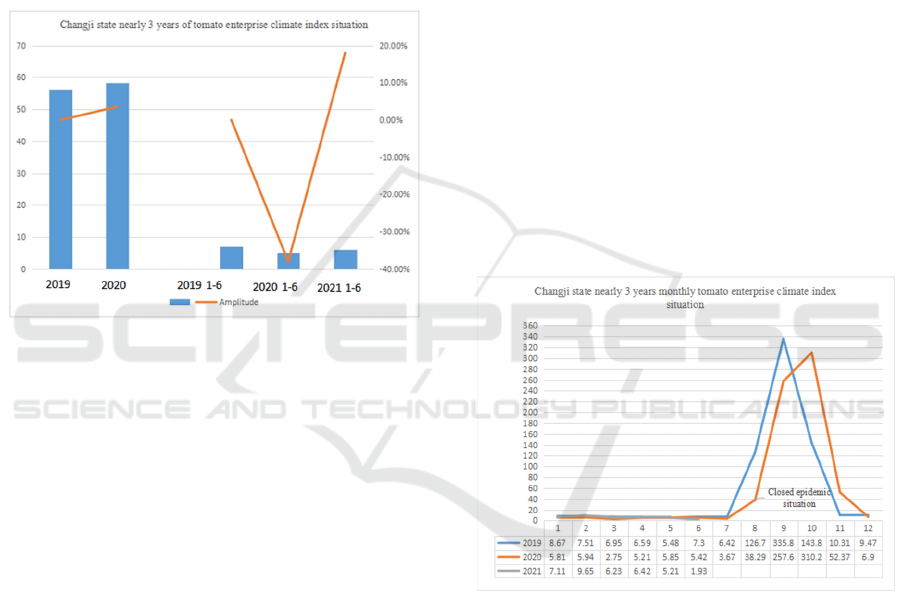
tomato enterprises was 56.252, and in 2020, the aver-
age prosperity index of Changji tomato enterprises
was 58.33, 2.08 (3.57%) higher than that in 2019;
From January to June 2019, the average prosperity in-
dex of tomato enterprises was 7.08. From January to
June 2020, the average prosperity index of tomato en-
terprises was 5.16, a year-on-year decrease of 1.92 (-
37.21%); From January to June 2021, the average
prosperity index of tomato enterprises was 6.09, an
increase of 0.93 (15.27%) year-on-year in 2020. In the
first half of 2020, the prosperity index of Changji to-
mato industry fell significantly, as shown in Figure 1.
(Photo credit: Original)
Figure 1: Prosperity index of tomato enterprises in Changji
Prefecture in recent three years.
In combination with the changes in the prosperity
index of Changji tomato enterprises in 2019, 2020
and January June 2021, the changes in the prosperity
index of Changji tomato enterprises are mainly di-
vided into two periods, namely, the off-season and
peak season, as shown in the following figure.
Off season (January July, December): at this time,
tomatoes have not yet reached the stage of large-scale
mature harvest, there are a small number of green-
house planting and harvest, and the power consump-
tion scale of tomato enterprises is low. Judging from
the changes of the prosperity index in 2019 and 2020,
with the rapid spread of the domestic epidemic, the
production and operation of tomato enterprises in
Changji Prefecture have been affected to a certain ex-
tent. Some enterprises have encountered problems
such as insufficient orders, tight sales, poor logistics
and financial difficulties, resulting in the prosperity
index in the first half of 2020 being significantly
lower than that of the previous year. The average
prosperity index in the off-season in 2020 (5.19) de-
creased by 2.11 compared with that in 2019 (7.3).
Judging from the changes of the prosperity index in
2020 and 2021, with the effective control of the do-
mestic epidemic, the average prosperity index (6.09)
from January to June 2021 increased by 0.93 year-on-
year (5.16) in 2020, and it is expected that the pros-
perity index will continue to increase in the second
half of the year.
Peak season (August November): with a large
number of mature tomatoes harvested, the power con-
sumption scale of tomato enterprises in Changji Pre-
fecture has increased, the production and operation
situation has gradually improved, and the enterprise
prosperity index has increased rapidly. Judging from
the changes of the prosperity index in 2019 and 2020,
with the rapid spread of the domestic epidemic, the
production and operation of tomato enterprises in
Changji Prefecture have been affected to a certain ex-
tent, and the upward trend of the enterprise prosperity
index has slowed down. From the end of July to the
beginning of September 2020, due to the closure of
the epidemic in Xinjiang, the prosperity index in Au-
gust 2020 was significantly lower than that in August
2019, and the highest prosperity index in the peak
season of 2020 (310.19) was 25.61 lower than that in
2019 (335.8). As shown in Figure 2.
(Photo credit: Original)
Figure 2: Monthly prosperity index in recent three years.
6 CONCLUSION
On the whole, in 2019, 2020 and the first half of 2021,
with the easing of the epidemic and the continuous
drive of the Xinjiang government's various measures
to increase production and efficiency, and phased pol-
icies to reduce the cost of electricity for enterprises,
the prosperity index of tomato enterprises in Changji
Prefecture gradually rebounded, and the production
and operation of tomato enterprises showed an up-
ward trend.
ICPDI 2022 - International Conference on Public Management, Digital Economy and Internet Technology
558

REFERENCES
Cai Y, Cao S, Xu J, et al. Study on Data Management of
Electric Power Distribution Dispatch and Cutting-
through Based on Big Data[J]. Journal of Physics: Con-
ference Series, 2021.
Chen Z, Li D, Cui C, et al. A Multi-database Hybrid Storage
Method for Big Data of Power Dispatching and Con-
trol[C]// 2019 IEEE SmartWorld, Ubiquitous Intelli-
gence & Computing, Advanced & Trusted Computing,
Scalable Computing & Communications, Cloud & Big
Data Computing, Internet of People and Smart City In-
novation (SmartWorld/SCALCOM/UIC/ATC/CB
DCom/IOP/SCI). IEEE, 2020.
Liang Chen, Weilian Su, Qingsheng Yang, et al. Analysis
Method of Sensing Information in Electric Power Dis-
tribution Based on Edge Computing[M]. 2020.
Tang X, Ding C. Information Security Terminal Architec-
ture of Power Transportation Mobile Internet of Things
Based on Big Data Analysis[J]. Wireless Communica-
tions and Mobile Computing, 2021.
Wang Z Q, Bai W J, Dong A Q, et al. A Global Data Model
for Electric Power Data Centers[J]. Journal of Signal
Processing Systems, 2021, 93(2).
Zhang S, Dai H, Shi Z, et al. The Construction of Electric
Power Big Data Analysis Platform Prospects in Smart
Grid Application[C]// 2020 IEEE/IAS Industrial and
Commercial Power System Asia (I&CPS Asia). IEEE,
2020.
Zhang Z, Zhao J, Li Z. Preliminary Analysis of The Appli-
cation and Development of Big Data, Cloud Compu-
ting, IoT, Mobile Internet, AI, and Blockchain In The
Power Scene[C]// ICITEE2020: The 3rd International
Conference on Information Technologies and Electrical
Engineering. 2020.
Research and Application of Prosperity Index of Tomato Industry Chain Based on Power Big Data Analysis
559
