
An Empirical Study on Green Finance Promoting Industrial
Structure Upgrading Based on Econometric Model
Enlin Tang and Zebin Liu
*
School of Finance and Mathematics, Huainan Normal University, Huainan, Anhui, 232038, China
Keywords: Green Finance, Industrial Structure, VAR Mode.
Abstract: In recent years, with the rapid development of economy, global warming, ecological environment deteriora-
tion and other problems are becoming more and more serious. This paper uses the econometric model to
quantitatively analyze the green finance. Based on the analysis of the action mechanism of green finance on
the development of industrial structure and the development status of green finance and industrial structure,
this paper points out the problems existing in the development process of green finance, and uses Granger
causality test to make an empirical study on whether green finance has an impact on the development of
industrial structure.
1 INTRODUCTION
In recent years, with the increasingly serious environ-
mental problems such as global warming and air pol-
lution, most countries in the world pay more and more
attention to green finance.
Green finance refers to the
establishment of a green, low-carbon and circular
economic system through the scientific use of finan-
cial instruments such as green credit, funds and secu-
rities, combined with the development law of market
economy. Green finance is a financial activity that
supports environmental improvement and effective
utilization of resources, that is, it provides relevant fi-
nancial services such as project investment and fi-
nancing, project operation, risk management and so
on. Industrial structure is the focus of China's supply
side reform, and China's industrial structure adjust-
ment is inseparable from green finance. The govern-
ment continues to launch green finance policies to
guide funds from high energy consumption and high
pollution industries to green industries, encourage
and support enterprises to increase investment in
green industries, which can not only improve their
competitiveness in the industry from the perspective
of enterprise development, it can also promote the de-
velopment of green finance and the upgrading and op-
timization of industrial structure from a macro per-
spective (Ma, 2016). Therefore, based on the analysis
of the current development status of China's green fi-
nance and industrial system structure, this paper
points out the problems existing in the development
of China's green finance, further studies how green
finance affects the industrial structure, makes an em-
pirical analysis, and puts forward policy suggestions
to optimize the industrial structure through the devel-
opment of green finance.
2 AN EMPIRICAL ANALYSIS OF
THE IMPACT OF GREEN
FINANCE ON INDUSTRIAL
STRUCTURE
2.1 Selection of Empirical Methods
Vector Autoregressive Model is a model based on the
statistical nature of data. It is a model constructed by
the regression of current variables to lag variables. It
is used to explain the impact of various economic
shocks on economic variables. This paper studies the
impact of Green Finance on the development of in-
dustrial structure, so VAR is more appropriate here.
The mathematical expression of model VAR(p) is as
follows:
𝑦𝑡 = 𝜙𝑦𝑡 − 1+⋯ + 𝜙𝑝𝑦𝑡 − 𝑝 + 𝐻𝑥𝑡 + 𝜀𝑡, 𝑡 =
1,2, ⋯ , 𝑇 (1)
In Formula (1), Ky
t
represents the k-dimensional
endogenous variable column vector, Xt represents the
534
Tang, E. and Liu, Z.
An Empirical Study on Green Finance Promoting Industrial Structure Upgrading Based on Econometric Model.
DOI: 10.5220/0011751500003607
In Proceedings of the 1st International Conference on Public Management, Digital Economy and Internet Technology (ICPDI 2022), pages 534-537
ISBN: 978-989-758-620-0
Copyright
c
2023 by SCITEPRESS – Science and Technology Publications, Lda. Under CC license (CC BY-NC-ND 4.0)

column vector of d-dimensional exogenous variables,
p represents the lag order, T represents the number
of samples, and K∗k-dimensional matrix 𝜙1,…,𝜙𝑝
and k ∗ d dimensional matrices H refer to the coef-
ficient matrix to be estimated. 𝜀
represents the k-di-
mensional perturbation column vector, and the rela-
tionship between them can be correlated at the same
time. However, it is not related to their own lag value,
and it is not related to the variables on the right side
of the equation. Suppose Σ is the covariance matrix
of
t
ε
, which is a positive definite matrix of k∗k. The
expansion of equation 1 can be expressed as:
1
111 11
2
221 22
1
1
,1,2,,.
tp
tt tt
tp
tt tt
p
kt p
kt kt dt kt
y
yy x
y
yy x
H
TT
y
yy x
ε
ε
φφ
ε
−
−
−
−
−
−
=++ ++=
(2)
That is, the VAR(p) model with k time series
variables consist of k equations (Ma, Wang, Dong,
2007; Gao, Gan, 2012).
2.2 Index Selection and Data Source
Here, we choose the green credit of financial institu-
tions to measure the scale of China's current green fi-
nancial development. Since the CBRC has only dis-
closed the green credit situation of 21 major financial
institutions since 2013, which is updated every half
year, the selected range of data here is from 2013 to
2020. We take the ratio of the green credit balance of
21 Financial Institutions disclosed by the CBRC to
the RMB loan balance as an indicator to measure the
scale of green financial development in China. The
symbols and specific meanings of green finance indi-
cators and industrial structure upgrading indicators
are shown in Table 1.
The industrial classification
methods mentioned in the above theory mainly in-
clude the intensive degree classification of production
factors and the traditional three industrial classifica-
tion. Because the data acquisition required by the in-
tensive degree classification of production factors is
difficult, and the traditional three industrial classifi-
cation can more intuitively and clearly reflect the evo-
lution of industrial structure, and
the data acquisition
is less difficult. Therefore, the traditional three indus-
try classification method is adopted here, and the pro-
portion of the added value of the secondary industry
and the tertiary industry in GDP is selected to meas-
ure the development of China's overall industrial
structure.
Table 1: Empirical indicators and their symbols and meanings.
Variable
type
Variable
name
Sym-
b
ol
Specific meaning
Green
financial
indicators
Green
credit ratio
GF
Green credit bal-
ance/ RMB loan
balance
Industrial
structure
upgrading
index
Industrial
structure
upgrading
TID
(Added value of
secondary industry
+ Added value of
tertiary industry)
/GDP
3 AN EMPIRICAL TEST OF
GREEN FINANCE
PROMOTING INDUSTRIAL
STRUCTURE UPGRADING
3.1 Unit Root Test
The stability test of variables GF and TID is the prem-
ise of empirical test, while ADF test is widely used in
China with high accuracy. Therefore, this paper uses
ADF test to test the stability of green financial indi-
cators and industrial structure indicators. The results
are shown in tables 2 and 3 below.
Table 2: Test results of GF stationarity of variables.
Method Statistic Prob**
ADF-Fisher Chi-square 10.4576 0.0054
ADF-Choi Z-stat -2.55170 0.0054
Intermediate ADF test results D(GF,2)
Series Prob Lag Max Lag Obs
D(SER01,2) 0.0054 0 0 6
Table 3: Test results of variable TID stationarity.
Method Statistic Prob**
ADF-Fisher Chi-square 19.37804 0.0001
ADF-Choi Z-stat -3.83853 0.0001
Intermediate ADF test results D(TID,2)
Series Prob Lag Max Lag Obs
D(SER02,2) 0.0001 0 0 6
The results of stationarity test show that the ADF
statistical value of the second-order difference of GF
vector and TID vector is lower than 1%, which indi-
cates that the second-order difference of GF vector
and TID vector is significant at the 1% level, and the
An Empirical Study on Green Finance Promoting Industrial Structure Upgrading Based on Econometric Model
535
negation of the original assumption at the 99% confi-
dence level indicates that it is a stable sequence.
3.2 Determining The Lag Order
After the stationarity test, the lag order of each varia-
ble needs to be determined. The operation results of
EViews are shown in Table 4. According to Akaike
information criterion (AIC) and Schwarz criterion
(SC), AIC, SC and HQ are the minimum when the lag
order is 2, so it can be determined that the optimal lag
order is 2.
Table 4: EViews operation results of variable lag order.
Lag LogL LR FPE AIC SC HQ
0 78.76521 NA*
1.03e-
12
-21.93292 -21.94837 -22.12393
1 86.39534 8.720150
4.08e-
13*
-22.97010 -23.01646 -23.54313
2 92.23880 3.339124
4.43e-
13
-
23.49680*
-
23.57407*
-
24.45186*
3.3 Stability Test
The stability test of VAR model is the premise of im-
pulse response function analysis. According to the
stability analysis of VAR model constructed by the
above variables, the results in Figure 1 show that the
reciprocal of unit eigenvalue of VAR model is in the
unit circle, indicating that the VAR model is stable.
Figure 1: Inspection diagram of AR root.
3.4 Impulse Response Function
Analysis
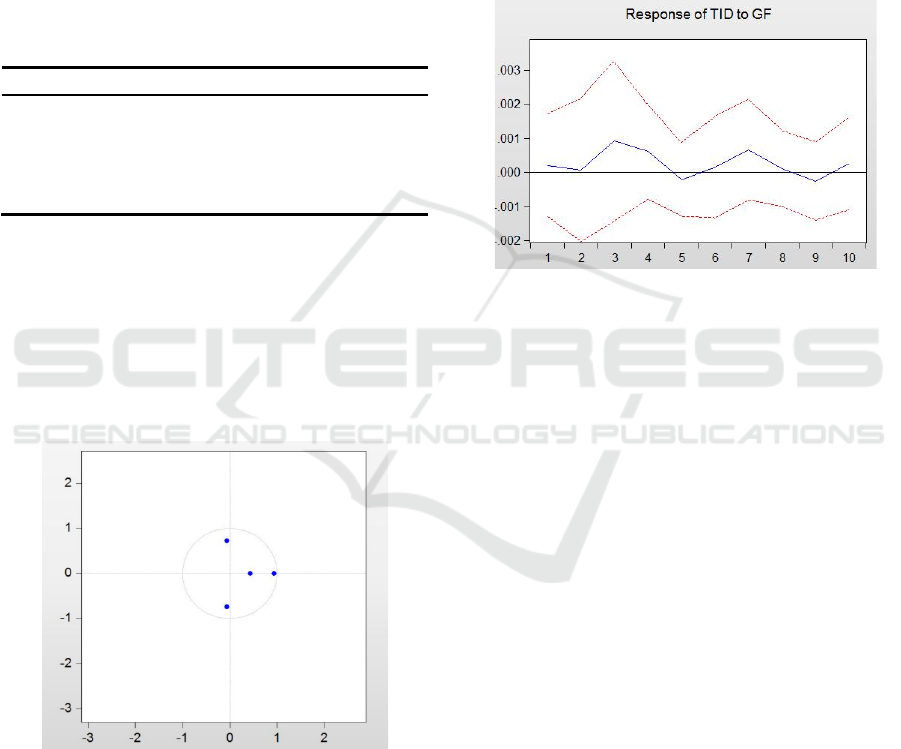
Figure 2 shows the impulse response function of in-
dustrial structure upgrading to green finance.
Through the observation of the function diagram, it
can be found that after the external impact of a stand-
ard deviation is applied, the pulse response character-
istics of industrial structure upgrading to green fi-
nance are as follows:
From the beginning to the third period, the impact
of industrial structure upgrading on green finance
gradually increased and reached the peak in the third
period. From the third period to the fifth period, it
showed a downward trend, and from the fifth period,
it showed a first upward and then downward trend
again.
Figure 2: Impulse response function of TID to GF.
4 CONCLUSION
Through theoretical analysis, it is concluded that
green finance mainly affects industrial institutions
through capital formation mechanism, capital-ori-
ented mechanism and information disclosure mecha-
nism. Through data collection and analysis, the cur-
rent situation of China's green finance development
and industrial structure development is revealed, and
on this basis, the problems faced by green finance to
promote the development of industrial structure are
obtained. The empirical research shows that there is a
significant causal relationship between the develop-
ment of green finance and the upgrading and optimi-
zation of industrial structure. That is to say, China can
promote the optimization of industrial structure
through the implementation of green finance policies,
thus making the economic development model
change from the traditional extensive model to the en-
ergy saving and environmental protection model. On
this basis, the specific policies and opinions on the
development of green finance to promote the upgrad-
ing of industrial structure are given from 4 aspects,
including the understanding of green finance at a
higher level, the improvement of green financial sys-
tem, the establishment of incentive and restraint
ICPDI 2022 - International Conference on Public Management, Digital Economy and Internet Technology
536

mechanism, and the increase in the training of green
financial professionals.
ACKNOWLEDGEMENT
This work is supported by Key Project of Humanities
and Social Sciences of Anhui Provincial Department
of Education (SK2020A0405), Support Project for
Outstanding Young Talents in Colleges and Univer-
sities of Anhui Province in 2022 (gxyq2022065),
Huainan Normal University Research Projects
(2021XJYB005), Huainan Guiding Projects of Sci-
ence and Technology (2021062).
REFERENCES
Gao Kuo,Gan You-qing. Dynamic analysis on the fluctua-
tion of pig price and production factor price in China
[J]. Statistics and Decision,2012, (5): 132-134.
Li Zhong. Research on green financial innovation and Chi-
na's industrial transformation [J]. Contemporary Eco-
nomics,2011(24):98-100.
Ma Jun. The Evolution of and Prospect for Green Finance
in China [J]. Comparative Economic and Social Sys-
tems,2016, (06):25-32.
Ma Xiao-bin, Wang Ting, Dong Xia. Application of vector
autoregressive method in pig price prediction [J]. Chi-
nese Journal of Animal Science,2007, (23):4-6.
Rao Shu-ling, Chen Yin, Ma Jun. Develop green finance in
depth [J]. Chinese Finance,2018, (18):55-56.
An Empirical Study on Green Finance Promoting Industrial Structure Upgrading Based on Econometric Model
537
