
Implementation of Sentiment Analysis for Student Academic Services
Using Support Vector Machine and Long Short Term Memory
(LSTM) Methods
I Gusti Ngurah Bagus Caturbawa, Sri Andriati Asri, I Wayan Suasnawa,
Ni Gusti Ayu Putu Harry Saptarini and Kadek Amerta Yasa
Department of Electrical Engineering, Politeknik Negeri Bali, Kampus Bukit Jimbaran, Badung, Indonesia
Keywords: Academic Services, Support Vector Machine, Long Short Term Memory, Sentiment Analysis.
Abstract: Sentiment analysis on student satisfaction aims to obtain feedback related to quality assurance efforts, so that
students' opinions on perceived academic services can be known. This result is an evaluation for improving
academic services at the Bali State Polytechnic. The method that can be used to find out the opinions of
students having positive, negative or neutral perceptions is to use machine learning algorithms. In this study,
two methods are used, namely Support Vector Machine and Long Short Term Memory. The results of this
study indicate that student sentiment is classified into three classes positive, negative and neutral. The Support
Vector Machine method obtained an accuracy rate of 0.81 (positive), 0.88 (negative) and 0.75 (neutral) while
the Long Short Term Memory (LSTM) method obtained an accuracy of 0.91 (positive), 0.85 (negative) and
0.85 (neutral).
1 INTRODUCTION
The implementation of monitoring and evaluation by
the Bali State Polytechnic (PNB) is an activity carried
out in order to maintain the continuity of the quality
assurance system based on established standards.
Measurement of student satisfaction as one of the
important things through an academic service survey.
The goal is to measure student satisfaction. This is
necessary to maintain the continuity of the
implementation of the quality assurance system. This
is done by gathering feedback on continuous
improvement efforts in student service delivery and
identifying areas requiring immediate follow-up. The
results of this survey can then be used as an
assessment document to evaluate the improvement
and refinement of the teaching and learning process
and to determine the quality of GNI services.
Student satisfaction with the quality of service
they receive is measured in several variables, namely
Reliability, Responsiveness, Assertiveness, Empathy,
and Tangibility. In this survey, five variables were
used to measure student satisfaction with the quality
of academic services in the form of student
administration services, libraries, and departments.
The follow-up analysis was based on students'
feedback on the quality of the learning services they
received. This analysis has three values, namely
positive comments, negative comments, and neutral
comments. To find out whether a comment has a
positive or negative perception, this can be done using
a machine learning algorithm. This research will use
the Support Vector Machine and Long Short Term
Memory (LSTM) methods.
2 THEORY
2.1 Support Vector Machine (SVM)
The follow-up analysis was based on students'
feedback on the quality of the learning services they
received. This analysis has three values, namely
positive comments, negative comments, and neutral
comments. USVM is a method that uses Supervised
Learning. SVM analyzes data by recognizing
classification patterns and regression analysis
(Burges, 1998) which efficiently minimizes model
complexity and prediction error. With a series of
trainings on SVM, each is marked as one of two
categories. The SVM training algorithm builds a
208
Caturbawa, I., Asri, S., Suasnawa, I., Saptarini, N. and Yasa, K.
Implementation of Sentiment Analysis for Student Academic Services Using Support Vector Machine and Long Short Term Memory (LSTM) Methods.
DOI: 10.5220/0011740100003575
In Proceedings of the 5th International Conference on Applied Science and Technology on Engineering Science (iCAST-ES 2022), pages 208-211
ISBN: 978-989-758-619-4; ISSN: 2975-8246
Copyright © 2023 by SCITEPRESS – Science and Technology Publications, Lda. Under CC license (CC BY-NC-ND 4.0)
model by assigning new examples into one of the
categories. SVM can be applied for facial recognition,
fraud detection, weather prediction, identifying
cancer cells from healthy ones (Ben-Hur, et al.,
2008). SVM was developed to find binary
classification using training data. There are several
methods of solving this problem in the literature, the
binary SVM classification is one of the popular ones
used (Kim, et al., 2012).
SVM can be explained in finding the best
hyperplane, functioning as a separator of two classes
in the input space. A hyperplane in d-dimensional
vector space is an affine subspace with d-1 dimension
dividing the vector space into two parts, which
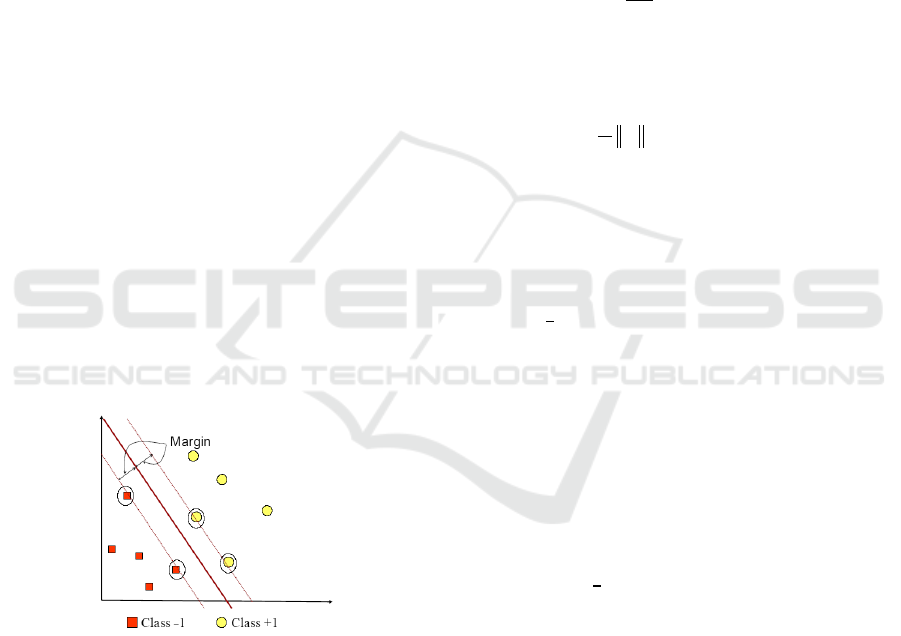
correspond to different classes. The best dividing
hyperplane between the two classes will be found by
measuring the hyperplane margin and finding the
maximum point. Margin is the distance between the
hyperplane and the closest pattern from each class.
This closest pattern is called a support vector. The
solid line in Figure 1 shows the best hyperplane,
which is located right in the middle of the two classes,
while the red and yellow dots in the black circle are
support vectors. The process of finding the
hyperplane location is the core of the Support Vector
Machine learning process.
To find out whether a comment has a positive or
negative perception, this can be done using a machine
learning algorithm. This research will use the Support
Vector Machine and Long Short Term Memory
(LSTM) methods.
Figure 1: SVM tries to find the best hyperplane that
separates the two class –1 dan +1.
Available data is denoted as
ℜ
, while the
respective labels are denoted
for
i=1,2,3 …. l. where l is the amount of data. Assumed
two class –1 and +1 can be completely separated by
the defined d-dimensional hyperplane.
(1)
Pattern
which includes class –1 (negative sample)
can be formulated as a pattern that satisfies the
inequality
(2)
(16)
While the pattern
which includes class +1 (sampel
positif)
1++ bxw
(3)
The largest margin can be found by maximizing the
value of the distance between the hyperplane and its
closest point, i.e.
. This can be formulated as
Quadratic Programming (QP) problem, which is to
find the minimum point of equation (2), taking into
account the constraints of the equation (3).
2
2
1
)(
min
ww
w
=
(4)
(5)
This problem can be solved by various computational
techniques, including the Lagrange Multiplier.
α
α
(6)
which i = 1, 2, …, l .
α
i
are Lagrange multipliers, which are zero or positive
( α
i
≥0 ). Nilai optimal dari persamaan (6) can be
calculated by minimizing L to
dan b, and
maximize L against α
i
. Dengan memperhatikan sifat
bahwa pada titik optimal gradient L =0, equation (6)
can be modified as a maximization problem which
contains only α
i
, as equation (7).
α
α
α
(7)
which
(8)
Dari hasil dari perhitungan ini diperoleh α
i
yang
kebanyakan bernilai positif. Data yang berkorelasi
dengan α
i
yang positif inilah yang disebut sebagai
support vector (Nugroho et al.,2003).
2.2 Long Short Term Memory (LSTM)
LSTM was introduced by Hochreiter and
Schmidhuber in 1997. LSTM belongs to the category
of Recurrent Neural Network (RNN) types. LSTM
can find hidden layers in each cell and is designed to
Implementation of Sentiment Analysis for Student Academic Services Using Support Vector Machine and Long Short Term Memory
(LSTM) Methods
209
store information on the previous cell. The LSTM
method is widely used with long-term data
classification processes by storing in memory cells.
Some of these studies were carried out by researchers
in developing the LSTM method. This method has
four components, namely: input gate, forget gate,
repeat connection, and output gate [11].
LSTM allows the model to remember information
for a long time so that it can understand the context
better. The ideal features of NLP problems are usually
due to the context of words in sentences as well as
sentences in paragraphs.
The LSTM architecture is formed to produce
optimal accuracy results. The LSTM training model
can have varying number of layers. This research
consists of several layers, namely LSTM layer,
embedding layer, one Dense layer with various input
features. The dataset is divided into two, namely
training data and test data. The optimization function
uses 'Adadelta', 'Adam', 'RMSprop', 'SGD' and the
learning rate uses 10-2, 10-3, 10-4, and categorical
cross-entropy loss is used for optimization and loss
functions.
3 RESEARCH METHODOLOGY
3.1 Data Collection
Data collection was carried out by taking data from
the results of the P4MP academic service survey. The
data from this survey will be used as a dataset for
machine learning during the system training process
to get the model. The data is organized into files in
.csv format for input into machine learning.
3.2 Data Preprocessing
At this stage, data selection is carried out so that the
data used becomes more structured. The stages of text
preprocessing in this study use several stages,
including: filtering, tokenization, stopword removal,
and stemming..
3.3 Training and Classification
The academic survey sentiment data that has gone
through preprocessing will be used for machine
learning in the training process, and some of the data
is used as testing, classified according to the class
(sentiment class) to determine the polarity of the text,
whether it includes positive, negative, or neutral
opinions using the Support method. Vector Machine
and Long Short Term Memory.
3.4 Evaluasi Sistem
System evaluation is done by providing input to the
system that has gone through the training process and
the system will provide output or output in the form
of sentiment.
4 RESULTS AND DISCUSSION
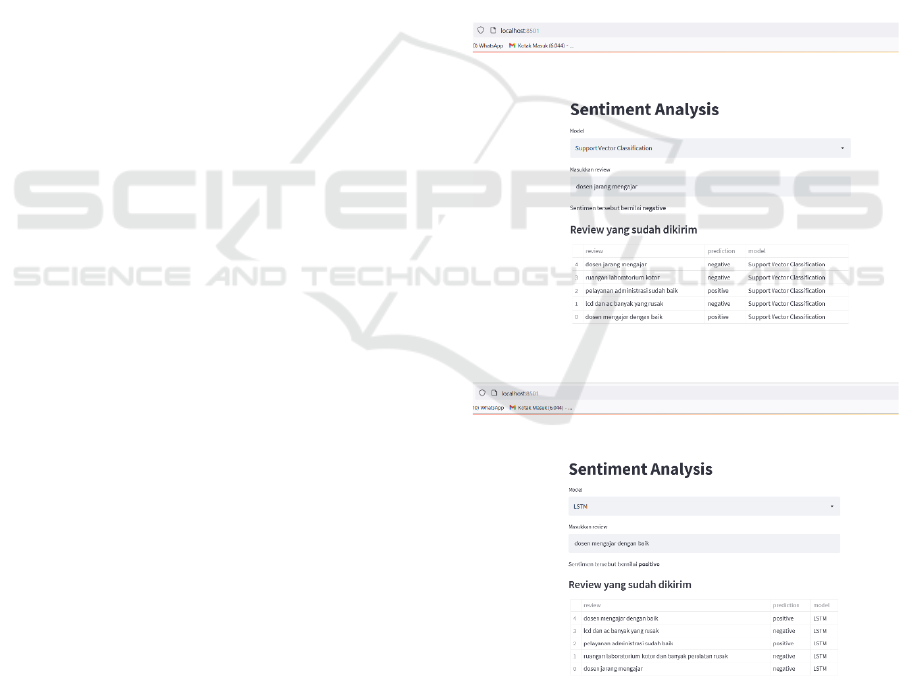
After carrying out the stages of the process described
previously, a model is obtained that can be used to
determine a comment that is positive, negative or
neutral. This model can be used in sentiment analysis
applications. The following is the display result of the
sentiment application using two methods, namely
Support Vector Machine / Classifier and Neural
Network (LSTM Network).
Figure 2: Implementation using the SVM method.
Figure 3: Implementation using the LSTM method.
In the machine learning training process, the
results obtained in the form of the performance of the
model, namely accuracy and precision. This
parameter is used as a benchmark for the reliability of
iCAST-ES 2022 - International Conference on Applied Science and Technology on Engineering Science
210
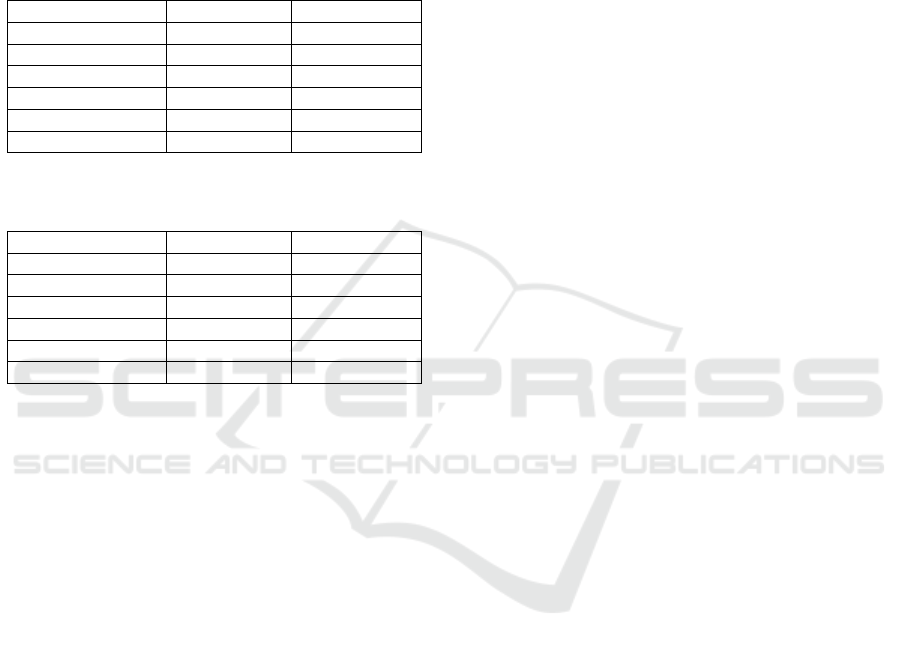
the system to provide a more accurate result. The
evaluation was conducted to determine the accuracy
of the Support Vector Machine/Classifier and Neural
Network (LSTM Network) methods. Table 1 and
Table 2 show the results that obtained the highest
level of accuracy, precision, and recall from the two
methods.
Table 1: Hasil akurasi, presisi dan recall pada Support
Vector Machine (SVM).
Presisi
Recall
Negative
0.88
0.95
Neutral
0.75
0.71
Positive
0.81
0.69
Akurasi
Macro avg
0.82
0.88
Weighted avg
0.86
0.83
Table 2: Hasil akurasi, presisi dan recall pada Long Short
Term Memory (LSTM).
Presisi
Recall
Negative
0.85
1.00
Neutral
0.85
0.71
Positive
0.91
0.69
Akurasi
Macro avg
0.85
0.81
Weighted avg
0.87
0.83
Based on Table 1 and Table 2 it can be concluded that
the results of accuracy and precision using the
Support Vector Machine method are better than the
Long Short Term Memory method..
5 CONCLUSIONS
The method used in this study to determine sentiment
has a positive, negative or neutral perception, namely
Support Vector Machine (SVM) and Long Short
Term Memory (LSTM). The evaluation results show
that the Support Vector Machine method has an
accuracy rate of 0.81 (positive), 0.88 (negative) and
0.75 (neutral), while the Long Short Term Memory
(LSTM) method has an accuracy of 0.91 (positive),
0.85 (negative) and 0.85 (neutral). The accuracy
obtained in both methods is above 0.8. The results
obtained show that the SVM method in general has
better accuracy measurement results than the LSTM.
REFERENCES
Burges, C. (1998). A Tutorial on Support Vector Machines
for Pattern Recognition, Data Mining and Knowledge
Discovery, vol 2, no 2, pp. 121–167.
Kim, G., Chae, B., and Olson, D. (2012). A support vector
machine (SVM) approach to imbalanced datasets of
customer responses: Comparison with other customer
response models. Service Business.
Ben-Hur A, Ong CS, Sonnenburg S, Schölkopf B, and
Rätsch G. (2008). Support Vector Machines and
Kernels for Computational Biology, PLoS Comput
Biol, vol 4, no. 10.
M. Frković, N. Čerkez, B. Vrdoljak and S. Skansi,
“Evaluation of Structural Hyperparameters for Text
Classification with LSTM Networks,” in 2020 43rd
International Convention on Information,
Communication and Electronic Technology (MIPRO),
Opatija, 2020.
Implementation of Sentiment Analysis for Student Academic Services Using Support Vector Machine and Long Short Term Memory
(LSTM) Methods
211
