
Pork Price Prediction using LSTM Model: Based on a New Dataset
Ziya Yang*
1
, Ruijie Zhang
2
, Zheng Yin
3
and Yucheng Zhu
4
1
Business college, Sichuan Agricultural University, Chengdu, China
2
School of Civil Engineering, Sichuan Agricultural University, Yibin, China
3
School of Architecture and Planning, Sichuan Agricultural University, Chengdu, China
4
School of Architecture and Planning, Sichuan Agricultural University, Luzhou, China
202008345@stu.sicau.edu.cn, 174062498@qq.com, 3344267732@qq.com
Keywords: ARIMA Model, LSTM, Covid-19, Computer Technology, Agricultural Prediction.
Abstract: During the epidemic period, some of prevention and control measures have exacerbated the contradiction
between supply and demand, which seriously affected the national economy and people's livelihood. In recent
years, with the development of computer science and the spread of the digital economy, many studies have
turned their attention to agricultural product price forecasting. Nevertheless, the application of intelligent
method in this area is still lacking. Thus, this paper uses ARIMA model and LSTM model for pork price
prediction based on a new dataset, trying to figure out a better model and provide guidance for national price
management. According to the analysis, LSTM model outperforms ARIMA model in both short-term and
long-term prediction, which overcomes the problem of long-term dependency. However, the data under the
epidemic is not sufficient, which limits the extraction of effective information, affecting the accuracy of model
predictions to some extent. It is suggested that following research should collect more data in the context of
covid-19 and adopt better dimensionality reduction method to achieve better results.
1 INTRODUCTION
With rapid spread and high mortality, the current
coronavirus disease outbreak is seen as a worldwide
emergency, causing severe disruptions in various
fields. (Yang, 2020) Especially in agriculture. Agri-
culture is the foundation of a country and is of vital
significance to the economy development. The covid-
19 has caused a huge blow to agriculture from all as-
pects. Typically, take transportation for an example,
the measures to control the pandemic have created
new challenges for transportation systems. (Gray,
2020) That seriously affect the agriculture and food
supply chain, which has exacerbated the contradiction
between supply and demand and consequently broken
the food security. (Raúl, 2020) Moreover, influenced
by the trade, distribution of inputs, labor availability,
and transportation control, agricultural commodity
production may experience destruction. (Mouloudj,
2020) All the above factors make price fluctuations
more and more violent, ultimately, forming a vicious
circle between Price, supply and demand. Therefore,
the research of agricultural products price prediction
is of great significance, especially in the context of
the current epidemic.
Price Prediction, which is to be carried out only
based on the available data, has become significantly
agricultural problem recently. (Kaur, 2014) With the
development of information technology and artificial
intelligence, accurate price prediction can help farm-
ers plan their production arrangements in advance,
provide policymakers with a basis for decision-mak-
ing, and price references for consumers. Contempo-
rary the most widely used parsimonious form of price
forecasting is time series model. Time series models
do not require cumbersome data input and only rely
on information provided by past price data. (Jha,
2013) Meanwhile, as the core algorithms in machine
learning algorithms, BP (Back Propagation) neural
network algorithm and genetic algorithm are widely
applied in different kinds of filed, such as stock price
forecast and rainfall forecast. (Yu, 2018) Ganqiong Li
used ANN (Artificial Neural network) model to pre-
dict Tomatoes price, the accuracy of ANN model is
more than 80%, and daily price forecasting is even
more than 90%. (Li, 2010) Nevertheless, the applica-
tion of LSTM (Long short-term memory) model is
still insufficient, which shows great accuracy in other
fields.
Yang, Z., Zhang, R., Yin, Z. and Zhu, Y.
Pork Price Prediction Using LSTM Model Based on a New Dataset.
DOI: 10.5220/0011738900003607
In Proceedings of the 1st International Conference on Public Management, Digital Economy and Internet Technology (ICPDI 2022), pages 423-429
ISBN: 978-989-758-620-0
Copyright
c
2023 by SCITEPRESS – Science and Technology Publications, Lda. Under CC license (CC BY-NC-ND 4.0)
423
Thus, this paper takes pork prices in Sichuan
Province, China as an example, collects relevant data
from 2015-2020 to predicts long-term and short-term
pork prices with ARIMA time series model and
LSTM neural network model based on Python. Given
that the ARIMA model is quite common in agricul-
tural price forecasting, which is widely used in many
fields, we will not elaborate on ARIMA here. The em-
phasis on the eigenvalue’s selection and model build-
ing of the LSTM.
2 METHODOLOGY
2.1 Data
As one of the most important sources of food in
China, the fluctuation of pork price significantly af-
fects China’s consumer price index (CPI), playing a
vital role in China’s economic system, which ulti-
mately influence the national macroeconomic policy.
(Zhao, 2015) Sichuan province is one of the largest
hog breeding bases in China, holding an important
place in the domestic pork supply. Considering that,
we collect a new dataset of pork price, which is shown
in the table 3.
2.2 Arima Model
ARIMA model (Auto Regressive Moving Average
model) are often applied on time series whose prop-
erties do not change over time, which means stable
time series. The ARIMA model is proposed to esti-
mate, test and predict the future value based on sta-
tionary time series which includes Autoregressive
(AR) model, Moving average (MA) model, and Sea-
sonal Autoregressive Integrated Moving Average
(SARIMA) model. (Benvenuto, 2020) In term of the
identification step, we are supposed to acquire a sta-
tionary time series, which is an exquisite condition to
construct the ARIMA model, so, data transformation
is needed in advanced. (Fattah, 2018) This process is
usually done by differencing and power transfor-
mation, and the terms of differencing is parameter d.
The ARIMA model is expressed as followed:
X
= α
X
+ α
X
+ ⋯ + α
X
+ ε
+
β
ε
+ ⋯ + β
ε
(1)
2.3 LSTM Model
To better explain LSTM (Long Short-Term Memory),
let’s begin with RNN (Recurrent Neural Network).
Introduced by Jordan in 1997, RNN is a neural net-
work that can being trained to predict the next symbol
in a sequence and learn the probability distribution
over a sequence. (Cho, 2014) However, affected by
short-term memory, it’s difficult to address the prob-
lem of long-term dependencies, leading to exploding
gradient and vanishing gradient. In 1997, Hochreiter
and Schmidhuber proposed the LSTM cell, which can
handle the problem of long-term dependencies effec-
tively.
As a special kind of RNN, LSTM can deal with
the correlation within time series in both short and
long term by transforming the hidden layer into a
memory unit. (Zhao, 2017) In other words, the
memory unit gives LSTM the ability to remember and
screen, enabling LSTM to store critically important
information about them and erase unrelated infor-
mation, in which way it can preserve information
from a long time ago. Thus, it effectively prevents the
gradient vanishing problem which exists in the tradi-
tional RNN by devising the creative gating structure
of LSTM block. (Akbari, 2018) The LSTM can be
described into 3 parts, the forget gate, the input gate
and the output gate.
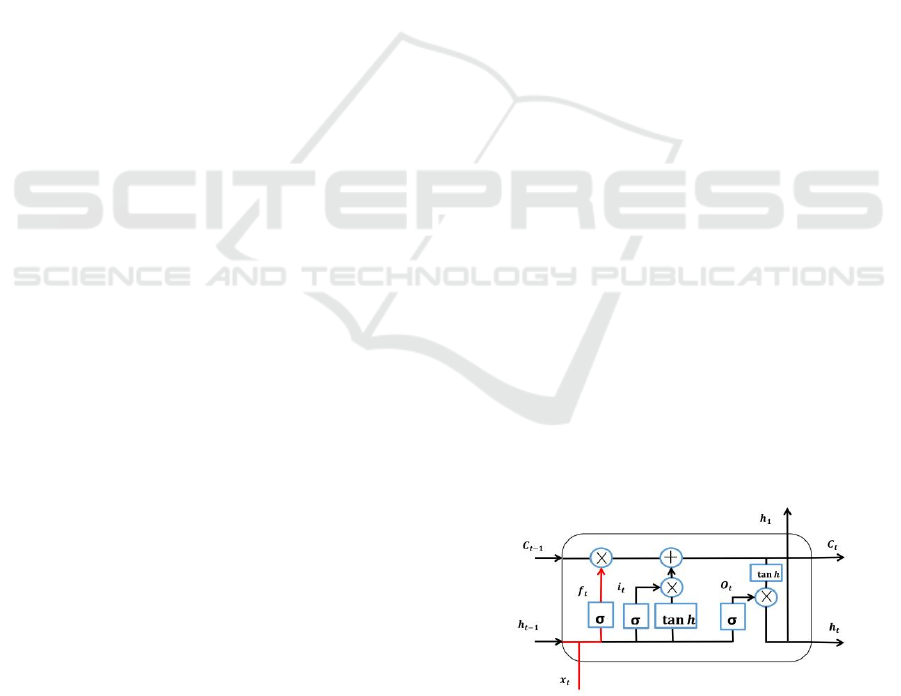
The Forget Gate.
As shown in the Fig. 4, the line marked in red is the
path for forget gate to delete irrelevant information.
The first step in the LSTM is to decide what infor-
mation we need to discard from the previous cell
state. This step is usually determined by the forgot
gate, which does a nonlinear sigmoid mapping by
reading the previous output h
and the current in-
put X
, and finally obtain f
(forget gate output),
which is shown in the Fig 1.
The mathematical form can be written as:
f
= σ(w
⋅ [h
,X
]+b
) (2)
Figure 1: The forget gate (author self-draw).
ICPDI 2022 - International Conference on Public Management, Digital Economy and Internet Technology
424
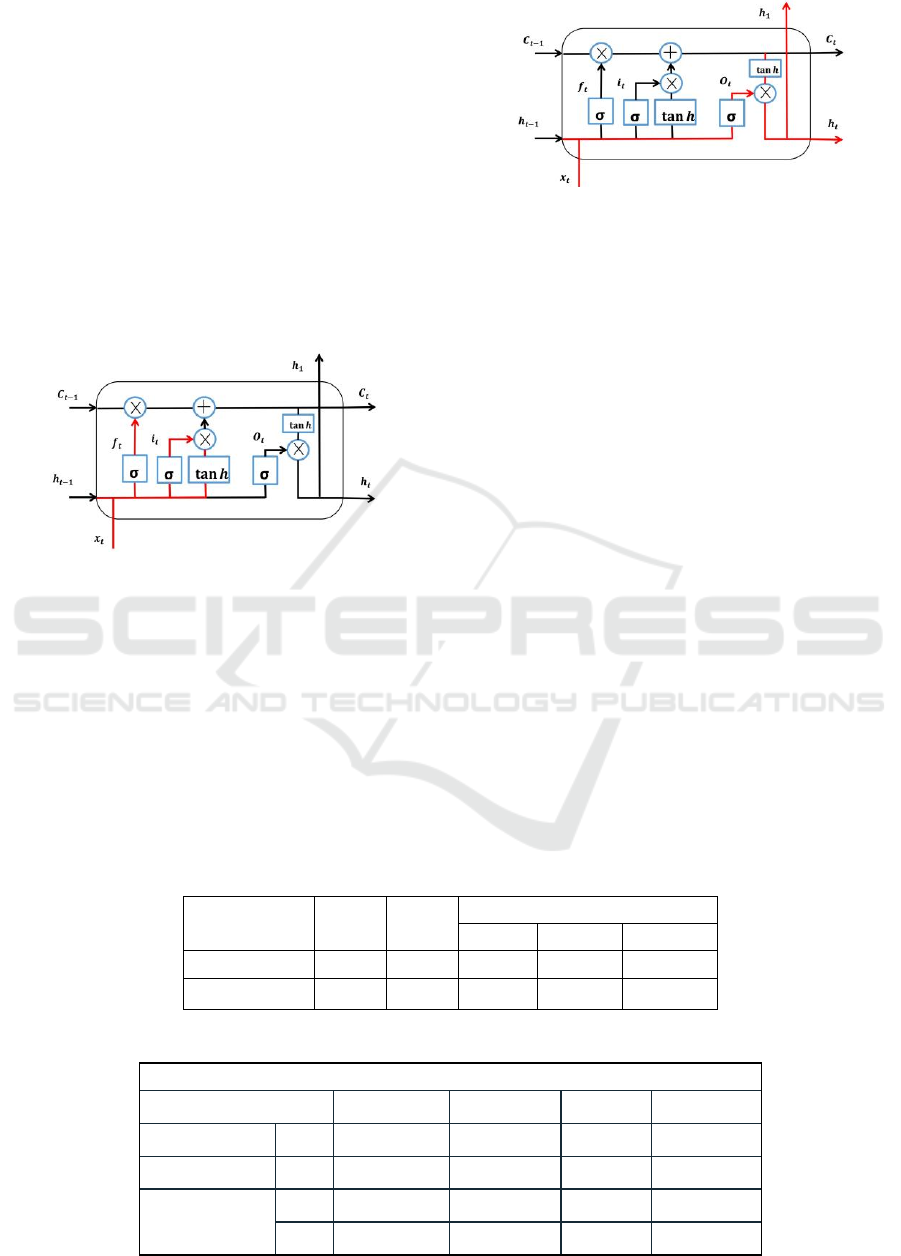
The Input Gate.
The input gate consists of two parts, one determined
by the sigmoid mapping decides which values need
to be updated and added to the previous matrix, and
the other part by reading h
and X
to create a new
candidate matric through the tanh layer to join the
current state. The whole process is shown in the Fig.2
which can be written as followed.
i
= σ(W
⋅ [h
,X
]+b
) (3)
C
=tanh(W
⋅ [h
,X
]+b
) (4)
C
=f
∗ C
+i
∗ C
(5)
Figure 2: The input gate (author self-draw).
The Output Gate.
The final output is determined by the sigmoid gate
and the cell state processed by the tanh layer.
Through sigmoid activation function we can figure
out which part needs to be outputted. Then, map the
current cell state to [-1, 1] through the tanh activation
function. Finally multiply the two parts to get the out-
put gate value. Still, it can be expressed by two for-
mulas, shown as Fig. 3.
Figure 3: The output gate (author self-draw).
O
= σ(W
⋅ [h
,X
]) + b
) (6)
H
=O
∗ tanh
(
C
)
(7)
2.4 ARIMA Model
It is clearly that the time series data has a clear trend
but no obvious seasonality which needs to be differ-
entiated to be stabilized. Therefore, after the first-or-
der difference, we performed the ADF test to see if it
is stationary. The result is shown in table 1that the P
value is less than 0.01, which means there is insuffi-
cient evidence to prove that the time series data is not
stationary.
Next, the p parameter and the q parameter are sup-
posed to be selected. By drawing the graphs of the
ACF and PACF of the residual terms, it can be clearly
seen that the data residuals are all tailed-off to zero
after the first-order difference, which also means that
ARIMA model can be applied on the data. Based on
this, we selected ARIMA (5, 1, 2) Model, with the
minimal BIC. The R2 of the training model is 0.992.
Finally, we apply the established ARIMA (5,1,2)
model to the test set, and obtain the prediction of the
next 7days and next 30days. On the test set, the good-
ness of fit of the model is still very high, up to 0.96.
The detailed results are shown in the table 2.
Table 1: ADF Inspection Form.
Differential
order
t p
Critical value
1% 5% 10%
0 -0.678 0.36 -3.441 -2.092 -2.695
1 -8.849 0.000 -3.499 -2.892 -2.583
Table 2: Metrics for ARIMA Model.
ARIMA MODEL
Se
t
MSE (%) RMSE (%) MAE (%) MAPE (%)
Train
1.201 1.194 1.111 4.712
Tes
t
1.342 1.301 1.204 4.613
Predictive value
short 1.059 1.029 1.019 2.212
long 2.013 1.419 1.348 2.219
Pork Price Prediction Using LSTM Model Based on a New Dataset
425
2.5 LSTM Model
For LSTM, selecting the appropriate feature values is
particularly important for the accuracy of prediction.
Hence, we will perform GRA method to filter the best
feature variables for LSTM model. After preliminary
data sorting and data cleaning, we conduct a simple
correlation analysis. According to the positive and
negative signs of the results, the data can be divided
into two parts, the positive part and negative part. The
next step is to carry out gray correlation analysis re-
spectively.
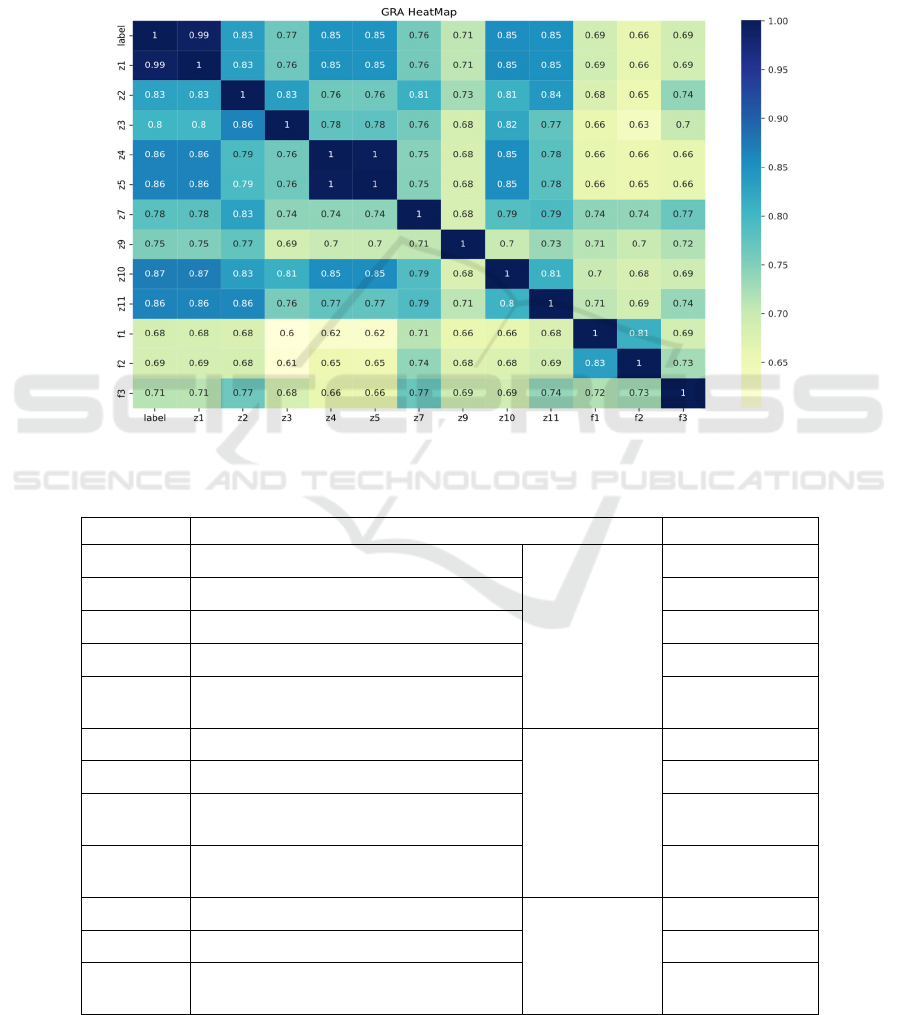
Finally, the variables with correlation values
above 0.65 are selected as eigenvalues for LSTM
model training, presented in the table III. The detailed
information of the GRA results are shown in Fig.4,
Fig.5 and Fig.6.
Figure 4: The GRA Heatmap (author self-draw).
Table 3: The results of the GR.
The label
influencing factor grey relativity
Z1 Historical pork price
supply factor
0.99
F1 Pork stock
0.69
Z3 Refined feed price of pork
0.77
Z5 Total cost of hog production
0.85
Z4
The material and service fees of
hog breeding
0.85
Z2 Average price of chicken
demand factor
0.83
F3 Black-bone chicken
0.69
Z9
The per capital disposable income
of rural residents
0.71
Z7
Fiscal expenditure for agriculture,
forestry and water
0.76
F2 Pork export volume
macro factors
0.85
Z10 Pork import volume
0.66
Z11
CPI-Food (Consumer price index of
food)
0.85
ICPDI 2022 - International Conference on Public Management, Digital Economy and Internet Technology
426
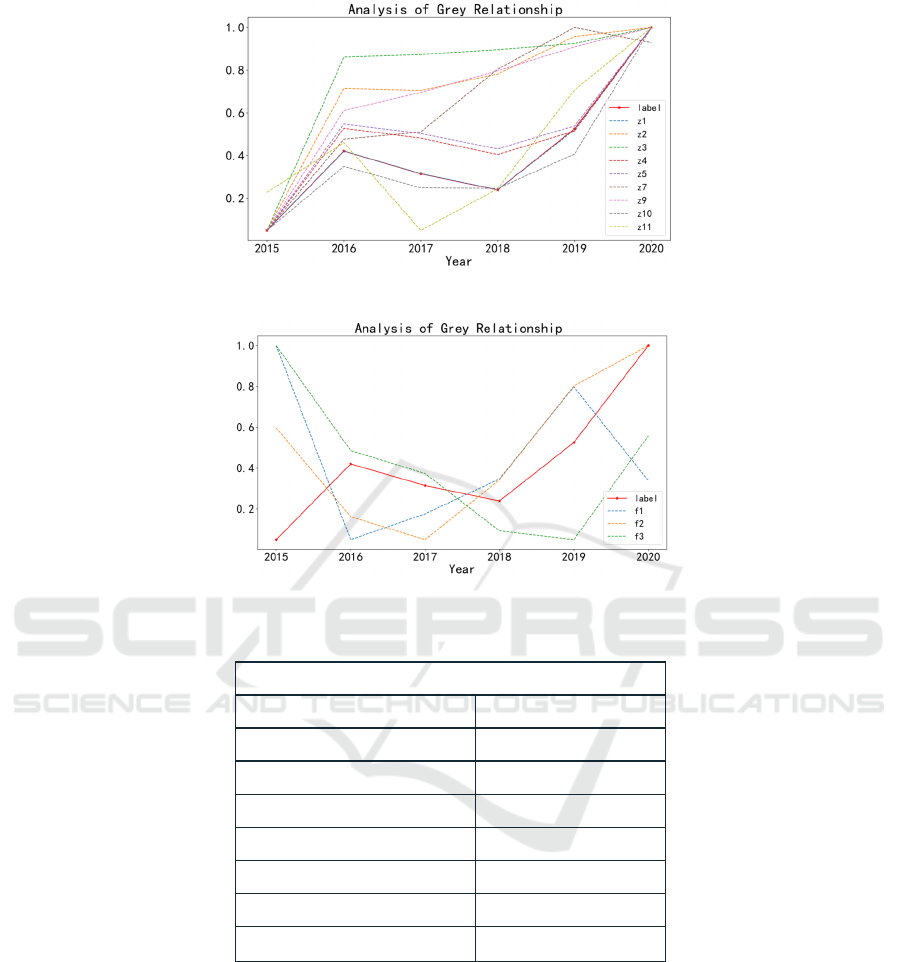
Figure 5: The line chart of GRA with positive correlation (author self-draw).
Figure 6: The line chart of GRA with negative correlation (author self-draw).
Table 4: Model parameter.
Model Parameter Configuration
name value
inpu
t
15
outpu
t
1
Num Hidden Units 400
LSTM laye
r
2
Max Epochs 100
Optimize
r
Adam
Learn Rate Drop Facto
r
0.2
Consequently, by setting the initial two-layer
LSTM model and multiple initial parameters, the
GridSearchCV function is applied to select the best
parameters. Besides, the number of parameters and it-
erations are passed to the program for training. It is
worth noting that the normalization is 0.05-0.85. That
is because the scale of the data is too large which
shows big differences. For this reason, a certain re-
duction is performed. The selected parameters are
shown in table 4.
Finally, it comes to the predicting step. We are
scheduled to predict the data of the 21st day based on
the data of the previous 20 days. Hence, we use the
data from December 11th to 30th, 2020 to predict the
pork price of January 1st,2020. Accordingly, it is ex-
pected to import the January 1st data, using the data
from December 12th to January 1st to predict January
2nd. Finally, save the data after forecasting the pork
price for the whole January follow the principle. The
results and the indicators are shown in the table 5.
Pork Price Prediction Using LSTM Model Based on a New Dataset
427

Table 5. Metrics For LSTM Model.
LSTM MODEL
Set MSE (%) RMSE (%) MAE (%) MAPE (%)
Train
6.751 2.598 1.586 6 .639
Tes
t
5.099 2.258 1.831 4.294
Predictive
value
short 0.127 0.357 0.267 0.588
long 0.179 0.338 0.422 0.721
As can be seen from Figure, that both the ARIMA
model and the LSTM model curve fit poorly. How-
ever, compared with LSTM model, although the
MAPE of ARIMA model from January 1st to January
30th is 0.0229, which shows great accuracy, the pre-
dicted fluctuation trend changes poorly, showing a
smooth curve. Even the error of the ARIMA model is
relatively small, it does not reflect the trend of the
pork prices. On the other hand, if RMSE is used as
the model indicator, the RSME of the ARIMA model
is about 1.419%, while the RMSE of the LSTM
model in this paper is just about 0.338%. In conclu-
sion, all signs point to that either prediction accuracy
or the trend prediction, LSTM outperforms ARIMA
in all aspects. Besides, both models are better for
short-term prediction than long-term prediction,
which is the same as other papers.
3 CONCLUSION
In general, in the context of covid-19 and the devel-
opment of computer science and digital economy, this
paper focuses on finding a better model for agricul-
ture price prediction, hopping offering some guidance
to governments, farmers and buyers. In this paper, we
discussed the effect of the LSTM model in pork price
prediction and compared with the traditional ARIMA
model. It is worth mentioning that this paper has col-
lected a whole dataset of pork prices, including 16
variables and more than 28,000 data, which is not
seen in previous research, which is also the biggest
innovation of this paper. According to the empirical
analysis, the LSTM model outperforms the ARIMA
model in both model accuracy and trend prediction.
Especially in predicting peaks and trends, it is far bet-
ter than traditional time series forecasting models.
Compared with previous studies, the accuracy of the
long-term prediction of the model in this paper has
also been greatly improved.
However, there are still some aspects can be im-
proved. The first is about data collection. Price fluc-
tuates violently due to the covid-19 and the swine fe-
ver, which affects the prediction accuracy of LSTM
model. Subsequent research can focus on collecting
the data in longer time span which can better consider
the epidemic factor. Secondly, the dimensionality re-
duction method adopted is relatively simple. Further
research can make improvements in this regard. In
general, this paper has made certain innovations in the
selection of eigenvalues predicted by the LSTM
model, offering guideline for LSTM in the field of ag-
ricultural price prediction and national price manage-
ment.
REFERENCES
Akbari Asanjan, Ata, et al. "Short‐term precipitation fore-
cast based on the PERSIANN system and LSTM recur-
rent neural networks." Journal of Geophysical Re-
search: Atmospheres 123.22 (2018): 12-543.
Benvenuto, Domenico, et al. "Application of the ARIMA
model on the COVID-2019 epidemic dataset." Data in
brief 29 (2020): 105340.
Cho, Kyunghyun, et al. "Learning phrase representations
using RNN encoder-decoder for statistical machine
translation." arXiv preprint arXiv:1406.1078 (2014).
Fattah, Jamal, et al. "Forecasting of demand using ARIMA
model." International Journal of Engineering Business
Management 10 (2018): 1847979018808673.
Gray, Richard S. "Agriculture, transportation, and the
COVID‐19 crisis." Canadian Journal of Agricultural
Economics/Revue canadienne d'agroeconomie 68.2
(2020): 239-243.
Jha, Girish K., and Kanchan Sinha. "Agricultural price fore-
casting using neural network model: An innovative in-
formation delivery system." Agricultural Economics
Research Review 26.347-2016-17087 (2013): 229-239.
Kaur, Manpreet, Heena Gulati, and Harish Kundra. "Data
mining in Agriculture on crop price prediction: Tech-
niques an Applications. "International Journal of Com-
puter Applications99.12 (2014): 1-3.
Li, Gan-qiong, Shi-wei Xu, and Zhe-min Li. "Short-term
price forecasting for agro-products using artificial neu-
ral networks." Agriculture and Agricultural Science
Procedia 1 (2010): 278-287.
Mouloudj, Kamel, Ahmed Chemseddine Bouarar, and Ha-
mid Fechit. "The impact of COVID-19 pandemic on
food security." Les cahiers du CREAD 36.3 (2020):
159-184.
ICPDI 2022 - International Conference on Public Management, Digital Economy and Internet Technology
428

Siche, Raúl. "What is the impact of COVID-19 disease on
agriculture?" Scientia Agropecuaria 11.1 (2020): 3-6.
Yang, Li, et al. "COVID-19: immunopathogenesis and Im-
munotherapeutics." Signal transduction and targeted
therapy 5.1 (2020): 1-8.
Yu, Yanfeng, Haibo Zhou, and Jiangfan Fu. "Research on
agricultural product price forecasting model based on
improved BP neural network." Journal of Ambient In-
telligence and Humanized Computing (2018): 1-6.
ZHAO, Guo-qing, and W. U. Qiong. "Nonlinear dynamics
of pork price in China." Journal of Integrative Agricul-
ture 14.6 (2015): 1115-1121.
Zhao, Zheng, et al. "LSTM network: a deep learning ap-
proach for short‐term traffic forecast." IET Intelligent
Transport Systems 11.2 (2017): 68-75.
Pork Price Prediction Using LSTM Model Based on a New Dataset
429
