
Research on the Operation System of Chinese Performance Market
Based on Data Mining Technology
Yong Wang and Nam-gyuCho
Department of Performance Art Management, Sangmyung University, Seoul 03015, Republic of Korea, Korea
Keywords: Operation System, Chinese Performance Market, Data Mining.
Abstract: The rapid development of computer technology makes it possible to process data, which promotes the great
development of database technology. Data mining is a data processing technology developed to meet this
need. In order to solve the problems faced by China's performance market at present, the author explores and
analyzes the operation mode of the performance market. According to the present situation of China's
performance market operation, a performance market operation system based on data mining technology is
designed by using database modeling technology and OLAP technology, and the structure and module
composition of the system are discussed in depth. The system runs stably and the data statistics are processed
accurately, which plays a positive role in promoting the performance industry to broaden new business
markets.
1 INTRODUCTION
As an important part of cultural industry, the market
maturity of performance industry is still not high. At
present, in China, except for Beijing and Shanghai,
where the performance industry is relatively
developed and forms a relatively mature performance
market, the performance industry in other regions is
almost in a deep sleep state (Ebrahimi, Asemi,
Nezarat, et al. 2021). More and more countries realize
the great influence and restriction of culture on
contemporary social and economic life. In recent
years, with the continuous improvement of China's
overall economic level, people's awareness of
cultural consumption is also constantly improving.
Cultural industry, especially mass cultural industry,
has been paid more and more attention by the
government and all sectors of society (Klepac, Kopal,
Mrsic 2019). There are some defects in the business
scope of the original performance market, which are
mainly due to the lack of market development, market
consumption and the high price of performance
tickets. However, through the improvement at the
present stage, it has improved the operation scope of
the original market and promoted the domestic
market economy.
Data mining is a very broad interdisciplinary
subject, which brings together different technologies,
especially information technology and statistical
analysis technology. The main purpose of analyzing
data is to provide real and valuable information for
business decision-making, so as to obtain profits.
Driven by modern science and technology, marketing
is developing towards automation, digitalization and
informationization. We need to extract hidden
information from a large amount of data that can
support decision-making, analyze the comprehensive
impact of business operation on society, economy
and environment, and predict the future development
trend of enterprises (Cui, An, Zhang 2021, Cui 2021).
Combined with the actual situation of the operation
system construction in China's performance market,
this project provides an advanced and practical
solution for the integration of operation system based
on data mining technology. This project is highly
targeted and has certain practical significance.
2 ANALYSIS AND COMPARISON
OF PERFORMANCE MARKET
MODELS IN CHINA
According to the research of relevant institutions in
recent years, the main management modes of mass
cultural performances in China can be summarized as
the following three modes.
Wang, Y. and Nam-gyuCho, .
Research on the Operation System of Chinese Performance Market Based on Data Mining Technology.
DOI: 10.5220/0011735500003607
In Proceedings of the 1st International Conference on Public Management, Digital Economy and Internet Technology (ICPDI 2022), pages 311-316
ISBN: 978-989-758-620-0
Copyright
c
2023 by SCITEPRESS – Science and Technology Publications, Lda. Under CC license (CC BY-NC-ND 4.0)
311
(1) Management mode of free cultural groups
Today, with the increasingly developed market
economy, the vitality of various cultural groups
(including karaoke bars, performing arts halls, etc.)
has become increasingly prominent due to their
flexible mechanism and strong market adaptability.
Its advantage is that in order to maximize profits,
small-scale cultural enterprises will maximize the use
of performance venues, provide more rich
performances to the society, actively look for the
programs that are in attendance, increase their
income, and reduce the financial burden of the state
to a certain extent. But at the same time, it should be
noted that although the contracted management of
small cultural enterprises has great vitality, it is not
suitable for the management of large-scale
performances (Ozdagoglu, Oztas, Cagliyangil 2019).
However, small-scale cultural enterprises often
aim at making profits, and it is difficult to invest and
cultivate the performance market that can not get
returns in the short term. At the same time, the
standard for enterprises to choose programs is
whether they are profitable or not, so it is difficult to
guarantee the artistic taste of performances, which
will make some dirty and low-cost kitsch
performances flood among them, and fail to realize
the true original intention of meeting the audience's
cultural needs.
(2) Professional collectivization management
mode
Entrusting large-scale state-owned enterprises to
implement group management seems to have been
reformed in a short time, which has many elements of
enterprise management, but it is no different from the
direct management of the government in essence.
After long-term operation, all the shortcomings of
state-owned enterprises are fully reflected in the
performance management.
(3) Management mode of public institution
The advantage of this model is that it can
implement government instructions to the maximum
extent and the government decrees are smooth; The
disadvantage is that in the face of the lack of
motivation for market operation, it relies too much on
the government and finance, and its responsibilities
and rights are unclear. Employees lose the motivation
to pursue progress because they enjoy the "iron rice
bowl" for a long time.
3 DATA MINING
Nowadays, data mining research is considered to be
another new wave in the field of information
technology after the Internet. As a mathematical tool
for knowledge development and innovation, data
mining can be widely used in many social
information fields such as finance, market
development, medical diagnosis and decision-
making, traffic management, and enterprise
performance evaluation, so as to improve the
reliability and accuracy of data analysis in the above
industries (Rahimi, Sharifzadeh, Feng 2020). Today,
these mature technologies, coupled with high-
performance relational database engine and extensive
data integration, make data mining technology enter
a practical stage in the current data warehouse
environment.
It is convenient to divide the types of data mining
tasks according to the different goals of data analysts.
The classification given below is not unique, and it
can further divide more detailed tasks, but it
summarizes various types of data mining activities.
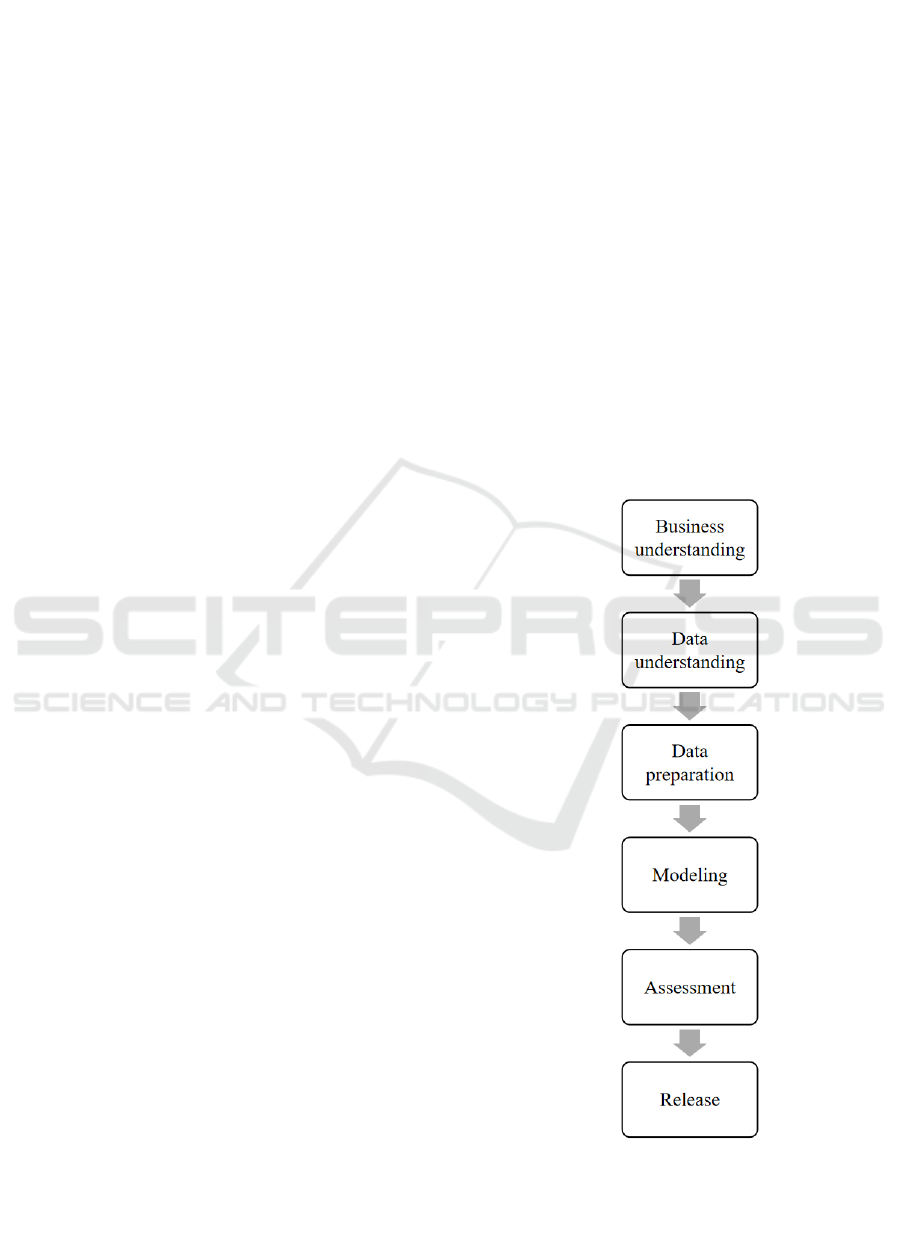
The implementation steps of data mining are shown
in Figure 1 below:
Figure 1: Implementation steps of data mining.
(1) Business Understanding
This initial stage focuses on understanding the
ICPDI 2022 - International Conference on Public Management, Digital Economy and Internet Technology
312
objectives and requirements of the project from a
commercial point of view, then transforming the
understanding into data mining problems, and
working out a preliminary plan to achieve the
objectives.
(2) Data understanding
The stage of data understanding begins with the
collection of original data, and the following
activities are familiar with data, identifying data
quality problems, exploring the first understanding of
data, or mining data subsets with deep meanings to
form assumptions about hidden information.
(3) Data preparation
The data preparation stage includes all activities
to construct the final data set from the original
unprocessed data. Data preparation tasks may be
carried out many times, and not in any specified order.
These tasks include the selection of tables, records
and attributes, and the conversion and cleaning of
data in modeling tools.
(4) Modeling
At this stage, we mainly choose various modeling
techniques and calibrate their parameters to reach the
optimal value. Usually, there are many methods for
the same data mining problem type. Some methods
have specific requirements on data form, so it is often
necessary to return to the data preparation stage.
(5) Assessment
Before the final release of the model, it is very
important to evaluate the model more thoroughly and
check each step of building the model, so as to make
sure that it has completely achieved the business goal.
A decision on the use of data mining results should be
made at the end of this stage.
(6) Release
According to needs, the publishing process can be
as simple as generating a report, or as complex as
executing a repeatable data mining process in the
whole enterprise. In most cases, the release is carried
out by customers, not the data analysts themselves.
However, even if the analyst does not execute the
release, it is very important for the customer.
4 ANALYSIS OF PERFORMANCE
MARKET OPERATION
SYSTEM
4.1 System Design Framework Based
on Data Mining
The data of performance industry has the
characteristics of sea quantification. For a long time,
due to the variety of business and the large number of
customers, not only has a large amount of important
business data been accumulated, but with the
expansion of business and the rapid increase of
customer volume, these data are growing at an
alarming rate every day. Based on this consideration,
the data mining technology of performance industry
should be built on the data warehouse system.
Any system using data mining technology has the
following functional modules: database or data
warehouse server, which manages the database or
data warehouse and preprocesses the data. User
graphical interface, that is, the interface where users
interact with data mining module. Users
communicate with the system through data mining
language to complete mining work (Chubukova,
Ponomarenko, Nedbailo 2020). The operating system
we designed is also composed of these functional
modules. According to a certain period, the data
mining server extracts data from the data warehouse
server, then carries out data mining according to
preset parameters and patterns, saves the generated
rules and patterns to the data mining server, and
provides the data mining results to the corresponding
managers through visual tools. Evaluation data
analysts can modify data mining parameters and data
update and mining cycles through the management
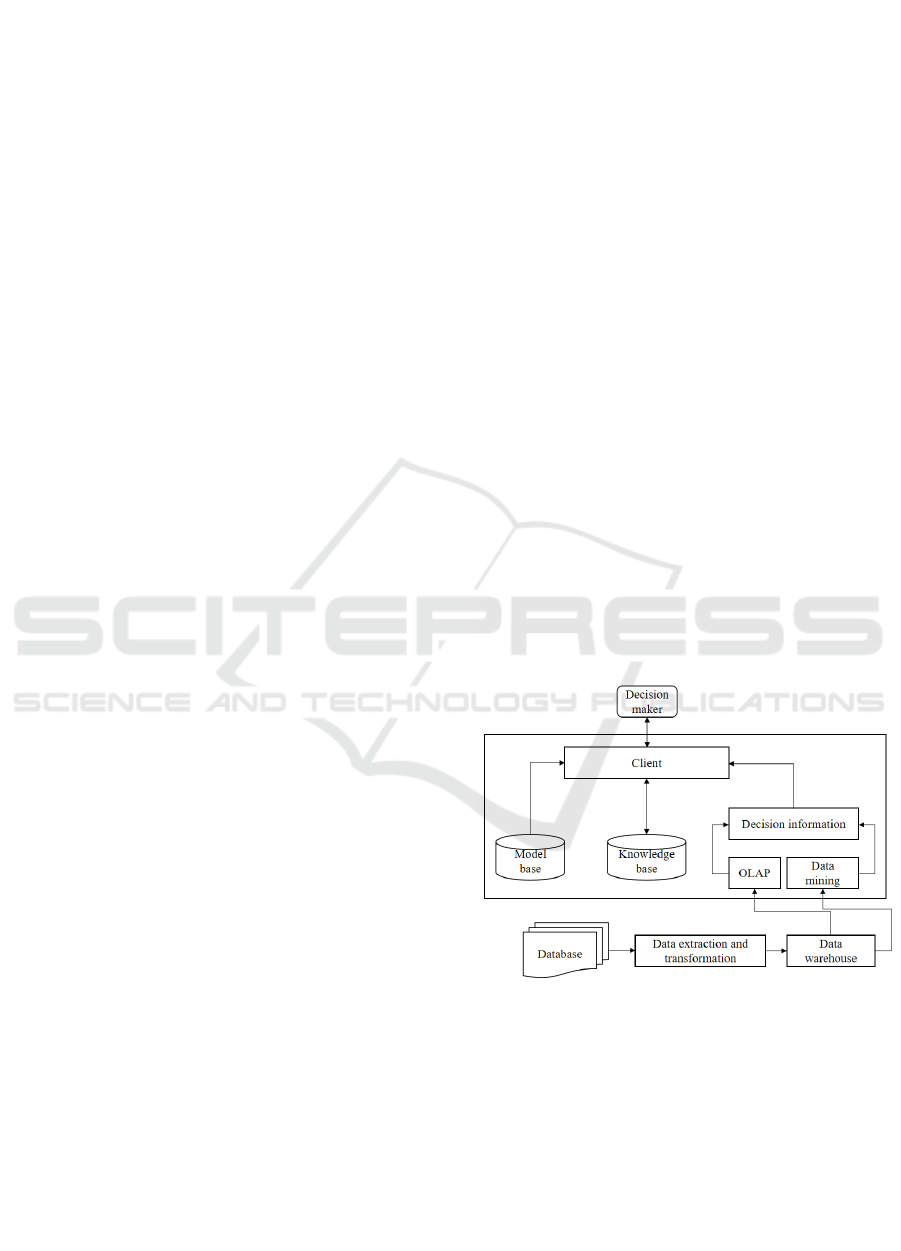
system. The president structure of the system is
shown in Figure 2.
Figure 2: System president structure chart.
The database in this system is the basic data
source. Its contents mainly include all kinds of
information related to customers, such as customer
background information, transaction history, etc. Is
the most primitive data. It is at the lowest level of
data, and keeps direct contact with the client due to
the need of dynamic update, which is generally the
business database of an enterprise, in addition to data
sources from other channels. In the data warehouse
Research on the Operation System of Chinese Performance Market Based on Data Mining Technology
313

system, traditionally, the workload is the largest, and
the problem in daily operation is the work of
extracting, transforming and integrating data from
business database to data warehouse. The reason is to
extract, transform and integrate data from different
kinds and forms of business, and finally store it in
data warehouse. And to maintain and manage the
quality of data.
4.2 Establishment of Prediction Model
The churn prediction model is a model for predicting
customer churn in the performance market, which
subdivides different prediction targets of different
users and makes the prediction results more forward-
looking. When the model is initially built, it is
necessary to study the data in the data warehouse and
obtain the data related to the loss prediction and
analysis (Szafrański, Zieja, Wójcik, et al. 2018). And
organize them according to the time granularity to be
studied, and explore the data. At the same time,
strengthen the discussion with the bureau. Through
exploring the data and understanding the demand, we
should be able to preliminarily determine the time
window structure of the forecasting model, the
definition of the group to be predicted, the forecasting
target, and select the index set sensitive to the
forecasting target.
The process of data understanding is an iterative
process. Choosing the appropriate time window
structure, groups to be predicted, prediction targets
and index sets is half the success of loss prediction.
Therefore, we must carefully scrutinize the data to
understand the work at this stage (Bimonte, Billaud,
Fontaine, et al. 2021). In the stage of data exploration,
the most valuable index set for loss prediction is
obtained. Then, by making derivative variables, the
data can more fully reflect the customer's behavior
changes. After defining the forecast target, the
forecast target is divided into several loss types, and
the priority of each type is defined to ensure that each
customer is in only one loss type state. Then, using
the data in the time window, mark each user with the
churn type.
In the data preparation stage, after making the
analysis table of time period A and time period B, the
operation of establishing the model can be started,
and the number of samples to be extracted in the
sample table is designed. Assume that 30,000
samples of 0 loss type need to be sampled, and 1,000
samples of other loss types need to be sampled.
Create an empty table to store the samples extracted
next. This table is called sample table for short. Pay
attention to tick the position of "Output should be
attached to the specified table" in the figure. The data
preparation process is shown in Figure 3.
Figure 3: Data preparation process.
The data of loss prediction model mainly comes
from two parts: detailed accounting list, user data, etc.
If the data warehouse of the system has been built,
these data can be provided by the data warehouse;
otherwise, a data mart can be set up separately to
provide data for data mining.
Take samples with loss type 0. When extracting,
first define the source table. On the input data page of
bivariate statistics, in the available input data box,
select a time period analysis table. In the filter record
condition box, the selection condition is "loss type
flag =0". On the sample page, select "create sample".
The sampling technology is "random selection of N
records", and the number of records should be filled
in "30000".
Input the sample table into the decision tree model
to start training. After the training, check the
confusion matrix output by the model to determine
the training effect of the model. If you are not
satisfied with the training effect, you can try to retrain
the model by adjusting the number of samples, the
proportion of samples, the input fields of the model,
the weights of the fields, and the parameters of the
decision tree algorithm to improve the effect of the
model. When modifying the parameters of decision
tree algorithm, the prediction effect of the model can
be improved by setting the cost matrix.
4.3 Solution Based on Data Warehouse
Platform
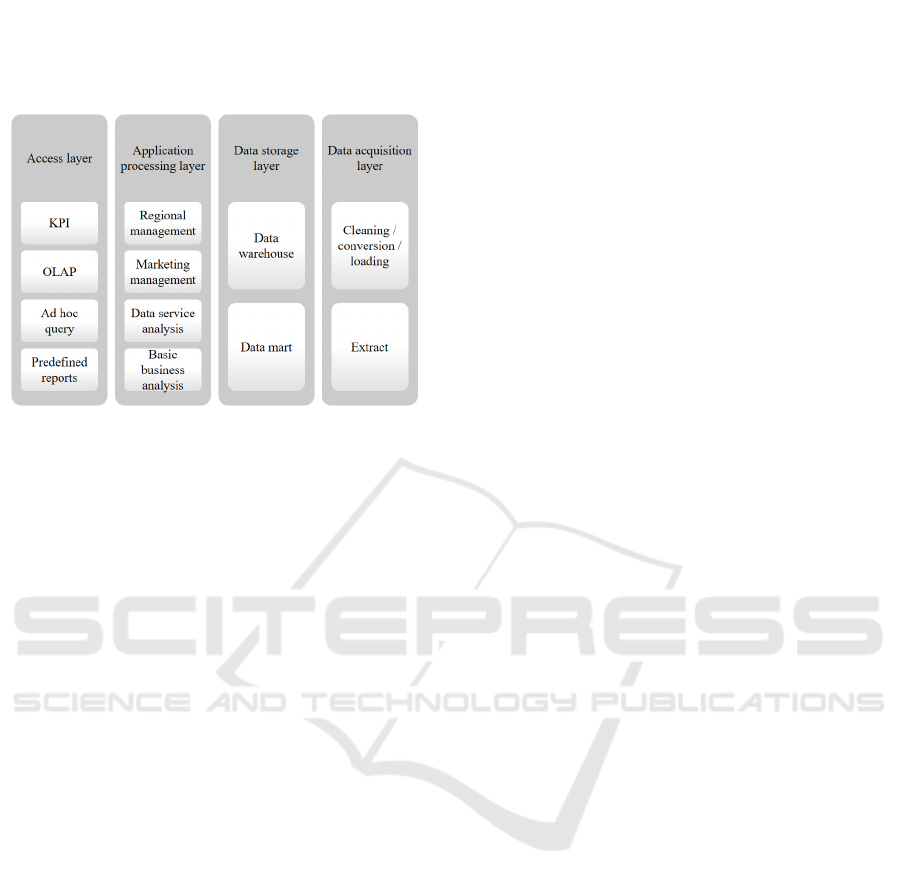
The performance market operation system generally
adopts a four-tier structure, as shown in Figure 4. The
operation system has established a unified enterprise
data information platform for the performance
industry. In this paper, the advanced data warehouse
technology and system analysis and mining tools
which are popular in the market in recent years are
used to extract useful information from the enterprise
historical data, provide services for the enterprise
ICPDI 2022 - International Conference on Public Management, Digital Economy and Internet Technology
314
customers, and comprehensively enhance the
operation level and competitive strength of the
enterprise, so as to embody the customer-centered
enterprise management philosophy.
Figure 4: Framework of operating system.
The architecture of the operating system adopts a
four-tier structure. Include:
(1) Data acquisition layer
The data layer defines the scope of system
management data, which mainly includes different
subsystems of operation system, including
application systems such as distributed data source,
ETL system, operation system, OLAP and front-end
applications.
(2) Data storage layer
The storage layer provides technical means and
data for data quality management, mainly including
metadata management, algorithm base, rule base and
intermediate information.
(3) Application layer
Provide various analytical applications of topic
analysis and thematic analysis, such as group
business analysis, data business analysis and so on.
(4) Data access layer
The access layer is the window and platform for
all kinds of business operators to access the operation
system, which is composed of two parts: the unified
access platform for users and various specific access
tools.
The basic idea of the system is to display rich
information through flexible configuration of the
underlying basic elements. In order to make the
system have good structure and maintainability, the
system is developed by java and jsp, and mature SSH
technology is adopted in the design, which is layered
according to MVC structure, which is convenient for
cooperative development, and also beneficial for
future maintenance and expansion.
In the process of model design, data quality is the
most important of all problems, so we must ensure the
authenticity of the data used, and make records to
compare the impact of each change on the results. In
this way, we can keep clear thinking and not get into
a dead corner. In the application process of the model,
it is necessary to have more contact and
communication with market personnel, so as to
ensure that the data handed over to market personnel
are truly usable data and avoid the disconnection
between development and application.
5 CONCLUSION
Data mining technology is the most powerful data
analysis method in the field of data warehouse at
present. Compared with the verification analysis of
OLAP, the analysis method of data mining uses
known data to find out the hidden business rules by
establishing mathematical models, which has been
successfully applied in many industries. The changes
of market and customer demand put forward new
requirements for the performance market operation
system. It is necessary to establish an efficient data
statistical analysis system to provide decision support
for the development of performance business. The
emergence of data warehouse and data mining makes
it possible for the performance industry to fully
exploit and utilize customer historical data
information. In this paper, the application of data
mining in performance industry is analyzed, and
some preliminary results are obtained, and an
analysis system based on data mining technology is
established The characteristics, architecture and
common models of data warehouse are analyzed. In
addition, OLAP and its multidimensional analysis
and data mining are described in detail.
REFERENCES
B Szafrański, Zieja M, J Wójcik, et al. Data analysis of
information system TURAWA in the aspect of data
mining methods[J]. Computer Science and
Mathematical Modelling, 2018(7/2018):45-52.
Bimonte S, Billaud O, Fontaine B, et al. Collect and
analysis of agro-biodiversity data in a participative
context: A business intelligence framework[J].
Ecological Informatics, 2021(4):101231.
Cui Z, An F, Zhang W. Internet Financial Risk Assessment
Based on Web Embedded System and Data Mining
Algorithm[J]. Microprocessors and Microsystems,
2021, 82(3):103898.
Cui Y. Intelligent Recommendation System Based on
Mathematical Modeling in Personalized Data Mining
Research on the Operation System of Chinese Performance Market Based on Data Mining Technology
315

[J]. Mathematical Problems in Engineering, 2021,
2021(3):1-11.
Chubukova, Ponomarenko, Nedbailo. Using data mining to
process business data[J]. Problems of Innovation and
Investment Development, 2020(23):71-77.
Ebrahimi F, Asemi A, Nezarat A, et al. Developing a
mathematical model of the co-author recommender
system using graph mining techniques and big data
applications[J]. Journal of Big Data, 2021, 8(1):1-15.
Klepac G, Kopal R, Mrsic L. Early Warning System
Framework Proposal, Based on Big Data
Environment[J]. International Journal of Artificial Life
Research, 2019, 9(1):35-66.
Liu Y, Huang J, Lu N. Research on Environmental
Monitoring System Based on Microservices and Data
Mining [J]. E3S Web of Conferences, 2020, 143(3):
02031.
Ozdagoglu G, Oztas G Z, Cagliyangil M. An application
framework for mining online learning processes
through event-logs[J]. Business process management
journal, 2019, 25(5):860-886.
Rahimi B, Sharifzadeh M, Feng X T. Ground behaviour
analysis, support system design and construction
strategies in deep hard rock mining – Justified in
Western Australian's mines [J]. Journal of Rock
Mechanics and Geotechnical Engineering, 2020, 12(1).
ICPDI 2022 - International Conference on Public Management, Digital Economy and Internet Technology
316
