
Study on the Risk Evaluation Method of Ground Collapse in the
Mined-Out Area Based on D-S Evidence Theory
Zheng Yang
1, *
, Guangyao Yang
1
, Feng Guo
1
, Zhongqiang Wang
1
and Chenkang Wei
2
1
Shaanxi Xiaobaodang Mining Company, Dabaodang Town, Shenmu City, Shaanxi Province 719302, China
2
College of Computer Science and Technology, Xi’an University of Science and Technology, Xi’an City,
Shaanxi Province, 710054, China
Keywords:
D-S Evidence Theory, Reverse Distance Weighting Method, Information Entropy, Data Fusion, Interval
Number, Probability Distribution.
Abstract: In the process of coal mining, it is easy to cause geological disasters such as ground collapse, so as to reduce
the loss caused by ground collapse, so it is necessary to evaluate the stability evaluation of the mining area
and the prediction of ground collapse. Ground subsidence is affected by geological, hydrological and weather,
the evaluation of ground subsidence based on multi-source information fusion, with the help of machine
learning, data fusion, integrates geological exploration drilling data, coal mining data and hydrological data.
Based on the mining area, this paper establishes the risk identification framework of 4 states, establishes the
stability evaluation index system with 9 influencing factors, calculates the basic probability distribution of the
indexes and distributes the information entropy, and finally integrates the probability distribution of the
indexes. It provides a new feasible way for risk assessment of mine mining area.
1 INTRODUCTION
China is rich in mineral resources and has a history of
thousands of years of coal mining. Depending on
relevant data, as of December 2004, the total mining
subsidence area of coal mines in China has exceeded
7,000 square kilometers, with a loss of more than 50
billion yuan. The average mining collapse area of key
coal mines accounts for about 10% of the coal
containing area. At present, the mined-out area has
become one of the main hazardous resource affecting
mine production safety (State Administration for
Work Safety, 2003), and it is also one of the two
hidden dangers in production safety. It impacts on
mineral development, life safety, and the natural
environment so seriously that the establishment of
this system has its necessity and urgency.
At present, multi-source information fusion
technology (MSIF: Multi. Sourse Infomation Fusion)
is mostly used in this direction. In the field of research
assessment of ground subsidence risk in the mining
area, many scholars use a single machine learning
model and empirical formula to evaluate, without
considering the uncertainty and correlation between
factors, so data fusion can solve this problem well.
Some scholars also use the information fusion
technology to conduct the risk assessment of the
mined space area, and make full use of the
complementarity and comprehensiveness of the
multi-source data to greatly improve the quality of the
evaluation index information. For example, they use
the hierarchical analysis method (Liu, 2020) to assess
the risk. This algorithm determines the weight ratio
of individual factors mainly based on the relationship
between their respective influence factors and
historical disaster points. It has the advantage of less
quantitative information required, but also, the results
are not convincing. And when there are too many
indicators, the accuracy is also difficult to guarantee.
Another example is the risk matrix evaluation
method. (Liu, Bhote, 2020) Making a subjective
judgment on the risk importance level standard, risk
possibility, and severity of the consequences may
affect the accuracy of the use. (Jin, 1998)
Therefore, this paper adopts the multi-source
information analysis and fusion based on D-S
evidence theory (Wang, 2005) to calculate the
stability level according to the fusion results, and
provides a new way for the stability evaluation of the
mining area. (Jin, 2006)
Yang, Z., Yang, G., Guo, F., Wang, Z. and Wei, C.
Study on the Risk Evaluation Method of Ground Collapse in the Mined-Out Area Based on D-S Evidence Theory.
DOI: 10.5220/0011735200003607
In Proceedings of the 1st International Conference on Public Management, Digital Economy and Internet Technology (ICPDI 2022), pages 297-301
ISBN: 978-989-758-620-0
Copyright
c
2023 by SCITEPRESS – Science and Technology Publications, Lda. Under CC license (CC BY-NC-ND 4.0)
297
2
A MULTI-SOURCE
INFORMATION FUSION
MODEL BASED ON DS
EVIDENCE THEORY
Let all the possibilities of the problem or event be
expressed in a set, and the results are mutually
exclusive and can fully cover all the results of the
problem or event, and the answer to the question we
study is a subset of this set. The identification
framework θ is a non-empty and limited set, which
meets the collection algorithm. The identification
framework is the foundation of evidence reasoning.
Definition 1: Make θ the identification
framework ,R a set class in the power set 2
θ
, and A a
subset of θ. If the function m:R → [0,1]
Meet the following conditions:
1)(
0)(
=Σ
=
Am
m
φ
(1)
Definition 2: Make θ the identification
framework, R a set class in the power set 2
θ
, A a
subset of θ, and m a mass function on θ, and Bel: R
→ [0,1] meets:
)(m)( BABel
AB⊆
Σ=
(2)
Bel is called the probability assignment function
on the identification framework θ. To any proposition
A. Bel (A) is called the confidence of proposition A,
suggesting the full degree of confidence of
proposition A.
Definition 3: Make θ the identification
framework, R a set class in the power set 2
θ
, and A a
subset of θ, and m a mass function on θ, and Pl: R →
[0,1] meets:
)(m)( BABel
AB
φ
≠∩
Σ=
(3)
Then Pl is referred to as the plausible function on
the recognition framework. And for any proposition
A,PI (A) is called the plausibility of the proposition
A. The function Pl represents the degree not opposed
to the proposition A. [Bel (A), PI (A)] indicates the
uncertainty interval of the evidence, which is also the
uncertainty of the evidence. One of the purposes of
evidentiary inference is to reduce the uncertainty
interval.
Definition 4: assuming that two different pieces of
evidence A and B focal elements are summed
respectively, and the mass function is sum
respectively, the D-S combinatorial formula of the
result of m=m
1
⊕ m
2
is as follows:
)()(
1
1
)(
21 iiBABA
BmAm
k
Am
iiii
⋅Σ
−
=
⊆∩=∩
θ
(4)
)()(
21 iiBA
BmAm
ii
⋅Σ=
=
∩
φ
(5)
The k conflict coefficient, which reflects the
degree of conflict between the evidence. The greater
the k, the greater the conflict; when k = 1, it is a
complete conflict and is not suitable for this formula.
3
ANALYSIS OF THE STABILITY
FACTORS IN THE MINED-OUT
AREA
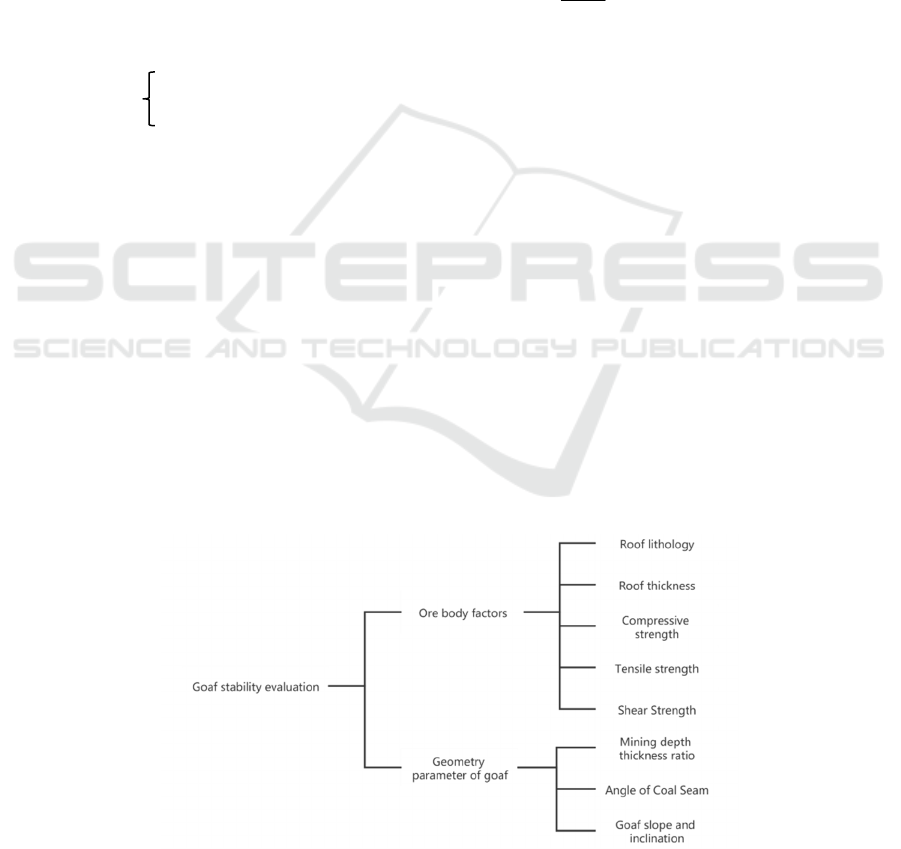
The factors causing geological disasters in the mined-
out area are various and a complex problem.(Gong,
2008) The data in the geological report are processed
and classified, and the influencing factors are divided
into the ore body factors and the collection
parameters of the mined-out area. The evaluation
indicator system of the mined-out area is established
as shown in Figure 1.
Figure 1: Stability evaluation index system of mined space area.
ICPDI 2022 - International Conference on Public Management, Digital Economy and Internet Technology
298

4 THE RISK EVALUATION
METHOD BASED ON D-S
EVIDENCE THEORY
Based on D-S evidence theory, the risk evaluation
method with evidential reasoning is proposed. With
data from a coal mined in Yulin, this part gives the
main experimental processes of the method.
4.1 Identification of the Risk
Assessment and Identification
Framework of the Mined-Out Area
According to D-S evidence theory, assuming that all
possible results we can recognize after the problem
occurs can be expressed in terms of a set called the
identification framework θ. For the risk assessment of
coal mined-out area (Ding, 2009; Chen, 2013), based
on the fact that we want to know the current safety of
an area of the mined-out area, all possible results of
the problem obtain the identification framework for
the mined-out area hazard assessment of this problem
θ = {safety state, basic safety state, critical state,
failure state}. The identification framework can
basically comprehensively express the judgment of
the slope safety assessment
. Conclusions reached
using evidential reasoning methods, it is a confidence
measure vector on a subset of evaluation objects in
the recognition framework. In the research conducted
in this paper, the result is the confidence vector of a
certain mined-out region on the identification
framework (safe state, basic safety state, critical state,
failure state)
.
4.2 The D-S Evidence Argument
Synthetic
4.2.1 Division of the Basic Index Interval
Combined with the risk assessment indicator system
of the mined-out area and the basic probability
division based on interval number, the collected 8
indexes are divided according to the four states of the
identification framework. See in Table 1.
4.2.2 Probability Allocation
Similarly, the basic index selected on the
identification framework, giving the basic probability
distribution process of the mining thickness ratio:
(1) Determines the number of intervals.
According to Table 1 the result of thickness ratio on
identification frame is: [25,35], [15,25], [10,15],
[0,10], using the four interval number as the interval
number model.
(2) Determines the identification interval. The
mining thickness ratio of mined out area No. 1 is
22.74.
The identification interval of the thickness ratio
is: [22.74,22.74].
(3) Calculates the interval distance. The distance
of the deep mining thickness ratio under the
identification framework θ is calculated, and the
results are as shown in Table 2:
Table 1: Division of the risk assessment index interval in the mining space area.
Evaluation indicators Highest
Securit
y
level
Normal Security
level
Hidden
dan
g
ers
Damage
state
Deep mining and thickness ratio [25, 35] [15, 25] [10,15] [0,10]
Top plate thickness (m) [15, 25] [10, 15] [5, 10] [0, 5]
Coal seam inclination angle(°) [0,15] [15, 30] [30, 45] [45,60]
Slope-dip angle is (°) [0, 15] [15, 25] [25, 45] [45,60]
Compressive Strength (Mpa) [70, 100] [50, 70] [30, 50] [0, 30]
Tensile strength (Mpa) [5,10] [3, 5] [1.5, 3] [0, 1.5]
Shear off strength (Mpa) [6, 10] [4,6] [2, 4] [0, 2]
Note: In some index interval division, the maximum interval value cannot be given. For example, the compressive strength
is considered greater than 70, but a determined interval is needed in the calculation, so a maximum value is set artificially,
which does not affect the calculation result.
Table 2: Interval distance.
Identification framework Highest
Security level
Normal
Security level
Hidden dangers Damage state
Basic probability matching 0.1595 0.3992 0.2565 0.1847
Study on the Risk Evaluation Method of Ground Collapse in the Mined-Out Area Based on D-S Evidence Theory
299

Table 3: Interval similarity.
Identification framework Highest Security
level
Normal Security
level
Hidden dangers Damage
state
Distance 10.1459 9.2748 12.0798 14.9161
Table 4: Basic probability allocation of all indicators in the mined space area No. 1.
Evaluation indicators Highest
Security level
Normal
Security level
Hidden
dangers
Damage state
Deep mining and thickness ratio 0.1595 0.3992 0.2565 0.1847
Top plate thickness 0.1522 0.3838 0.2872 0.1768
Coal seam inclination angle 0.4242 0.2949 0.1633 0.1177
Slope inclination angle 0.3615 0.3554 0.219 0.0642
Compressive strength 0.1889 0.3921 0.2606 0.1585
Tensile strength 0.1356 0.3785 0.3179 0.1679
Shear-off strength 0.1528 0.3793 0.2888 0.1791
Lithology 0.25 0.35 0.2 0.2
Table 5: Credibility of the risk grade of some mined-out areas.
Mined-out Area
Num
Caularea risk level credibility
Level I Level II Level III Level IV
Mined-out Area No.1 0.0502 0.4278 0.5132 0.0087
Mined-out Area No.10 0.1392 0.7222 0.1359 0.0026
Mined-out Area No.11 0.1335 0.7332 0.1308 0.0025
Mined-out Area No.34 0.5687 0.3505 0.0783 0.0024
Mined-out Area No.35 0.5854 0.3354 0.0766 0.0025
(4) Calculates the interval similarity. The
similarity between the mining thickness ratio and the
four intervals is calculated by formula. Results are
shown in Table 3.
(5) The normalization treatment of interval
similarity obtains the probability allocation of each
state under the recognition framework and get the
result.
This probability distribution is shown in Table 4.
Through the judgment matrix obtained from the
basic probability allocation function, the index
weight is:
w = [0.1171, 0.0496, 0.2988, 0.2587, 0.1090, 0.0265, 0.0659, 0.0743].
We weighted evidence fusion for mined-out area
1, and the mass function for the influence indicators
of mined-out area 1 is as follows:
Mining thickness ratio (𝑚
),𝑚
{Level I, Level II,
Level III and Level
IV}=(0.1595,0.3992,0.2565,0.1847);
Top plate thickness is (𝑚
),𝑚
{Level I, Level II,
Level III and Level
IV}=(0.1522,0.3838,0.2872,0.1768);
Coal seam dip angle (𝑚
),𝑚
{Level I, Level II,
Level III and Level
IV}=(0.4242,0.2949,0.1633,0.1177);
Slope angle (𝑚
),𝑚
{Level I, Level II, Level III
and Level IV}=(0.3615,0.3554,0.2190,0642);
Compressive strength (𝑚
),𝑚
{Level I, Level II,
Level III and Level
IV}=(0.1889,0.3921,0.2606,0.1585);
Tensile strength (𝑚
),𝑚
{Level I, Level II, Level
III and Level IV}=(0.1365,0.3785,0.3179,0.1679);
Shear strength (𝑚
),𝑚
{Level I, Level II, Level
III and Level IV}=(0.4242,0.2949,0.1633,0.1177);
Top slab lithology (𝑚
), 𝑚
{Level I, Level II,
Level III and Level IV}=(0.25,0.35,0.20,0.20).
The mass functions on 4 identification
frameworks are fused, so the 𝑚
−𝑚
− fusing
result is M, M{Ⅰ} = 0.08, M{Ⅱ} = 0.54, M{Ⅲ} =
0.26, M{Ⅳ} = 0.12, then the new mass function is M
{I, II, III, IV} = (0.08,054,0.26,012). According to the
fusion results of the first two mass functions and the
third mass function, the results of the second fusion
and the fourth mass function, thus the security level
credibility of the final No.1 on the identification
framework 𝜣 after n-1 fusion, and the No.10,11,34
and 35 are randomly selected for the above fusion
calculation. The results are shown in Table 5.
ICPDI 2022 - International Conference on Public Management, Digital Economy and Internet Technology
300

4.3 DS Evidence Theory Fusion Result
Analysis
Combining the above calculation results, the multi-
source information fusion based on D-S evidence
theory is used to determine the selected 5 mined-out
areas, and to get the basic credibility on the
identification framework 𝜣. As it appears from Table
5, the credibility of No.1 is 0.0502. From the
perspective of probability, the probability that mined-
out area No.1 is safe is 5.02%. The probability of
relative safety is 42.78%. The probability of being in
a dangerous state is 51.32%, The probability of being
in very dangerous is 0.87%, Therefore, the final risk
assessment result of No.1 mined-out area is relatively
dangerous, which means Col collapse may occur.
Similarly, the evaluation result of No.10 is level
II ,which is relatively safe; the evaluation result of
No.11 is level II and is relatively safe. The evaluation
result of No.34 and 35 is level I and they are in a very
safe state.
5 CONCLUSIONS
According to the method proposed in this paper, the
risk identification framework of four states was
established using data from a mine in YuLin, nine
influencing factors were selected to establish the
stability evaluation index system, and the D-S
evidence theory is used to weight the probability
distribution of the index. At last, the experimental
result is consistent with the actual situation of the
mine,
The effectiveness of the multi-source information
fusion method is verified, and a new feasible way is
provided for the mine mining area Hazard
assessment.
REFERENCES
Chen J., Luo Z.Q., Hou Z. S.. Stability evaluation of metal
mine goaf based on improved catastrophe progression
method [J]. Journal of Safety Science and Technology,
2013, 9(11):17-24.
Ding C.J., Wang J. L.. Using artificial neural network to
assess the stability of goaf foundation [J]. Journal of
Mining & Safety Engineering, 2009, 26(2):208-211.
Feng C.G., Li J.P., Yu W.Y., et al. Mechanism study of
abandoned stope disposal in Dongtongyu gold mine [J].
Gold, 2002(10): 11-15.
Gong F.Q., Li X.B., Dong L.J., et al. Underground goaf
risk evaluation based on uncertainty measurement
theory [J]. Chinese Journal of Rock Mechanics and
Engineering, 2008, 27(2) :323-330.
Jin Z.D., Lu X.W., Fracture fractal study of Dexing
Zephyry Copper Mine in Jiangxi Province [J].
Geological Review, 1998,44 (1): 57-62.
Jin J.Q., Wu F. C.. Development status and prospect of
information fusion technology. Northern Institute of
Automatic Control Technology, Taiyuan, 2006.
Liu J. 3-D modeling and risk evaluation of landslide scene
based on UAV aerial photography [D]. Lanzhou
Polytechnic University, 2020.
Liu M. Bhote Koshi basin ice lake collapse disaster
mechanism and risk assessment [D]. University of
Chinese Academy of Sciences (Chengdu Institute of
Mountain Disaster and Environment of Ministry of
Water Resources), 2020.
Ma H.T., He H.S., Fu S. G.. Study on factors and classifying
method of goaf stability [J]. Journal of Safety Science
and Technology, 2008, 4(5): 37-47.
State Administration for Work Safety. National
Development Plan for Work Safety Science and
Technology: Research Report on Non-Coal Mine Field
(2004-2010) [R]. Beijing: State Administration of Work
Safety, State Administration of Coal Mine Safety
Supervision, 2003.
Wang Y.J. Stability evaluation of Weichai Power Casting
Center [doctoral thesis]. Nanjing: Nanjing University,
2005.
Zhao L.M., Liu H.P., Zhang B. Multi-source Information
Fusion Technology and Its Industrial Application [J].
Automation Instrument, 2010, 31 (9): 4-5.
Study on the Risk Evaluation Method of Ground Collapse in the Mined-Out Area Based on D-S Evidence Theory
301
