
Study on Influencing Factors of Population Changes in Dongguan
City Based on Principal Component-Regression Analysis
Zhitao Cui
1, a
, Shanle Wan
2, b
and Yong Fang
1, c
1
School of Artificial Intelligence, Dongguan City University, Dongguan, China
2
Dongguan Yeyuying Network Science Co. Ltd, Dongguan, China
Keywords: Influencing Factors, SPSS, Pearson Correlation Coefficient, Hierarchical Clustering, Principal Component
Analysis, Regression Analysis.
Abstract: In this paper, 9 economic and social development indicators are selected from the Statistical Yearbook 2019
of Dongguan. All indicator variables have a significant linear correlation with the permanent population
variable. The similarity of variables is distinguished with the hierarchical clustering method. Variable groups
are divided into 2 categories and then subjected to dimensionality reduction based on principal component
analysis. Two principal components are extracted. Finally, two regression equations are set up according to
the results of variable group clustering and principal component analysis, which have good test indicators.
1 INTRODUCTION
Since the reform and opening up, Dongguan's
economy has developed rapidly with its growth rate
and order of magnitudes among the top of major
economic cities in Guangdong Province. The
demographic dividend is one of the most important
factors (Cai, 2009; Zhao, 2016; Chen, 2008; Wang,
2007; Zhong, 2009). However, China's natural
population growth has entered a low level state since
the 1990s. By 2000, the population aged 65 and over
accounted for 7% in China, marking its entry into an
aging society (Yan, 2021). The decline in the growth
rate of the total supply of labor force combined with
the aging population structure will continue to affect
the innovation momentum and the potential growth
rate of the medium and long-term economy (Li,
2018). The formulation of policies conducive to
increasing population supply and slowing down the
aging process is an urgent task facing all major cities
in China.
The importance of labor supply to the
manufacturing industry is self-evident as Dongguan
is an international manufacturing city. It must work
out relevant policies conducive to promoting the
supply of labor force and slowing down the aging of
population in order to maintain the continuous
increase in social innovation momentum and the
continuous and stable development of the social
economy. To play a positive role in finding an
effective policy focus (Pan, 2012), this paper attempts
to identify the factors with an important impact on
population growth from the economic and social
development indicators of Dongguan.
2 CORRELATION ANALYSIS OF
DATA INDICATORS
The 9 data indicators herein are selected from the
Statistical Yearbook 2019 of Dongguan City, as
shown in Table 1.
Table 1: Interpretation of data indicators.
Variables Variable inter
p
retation
1
x
Regional Gross Domestic Product (GDP), in
100 million
2
x
Annual fixed asset investment
3
x
Number of large-scale industrial enterprises
4
x
Highway mileage
5
x
Number of teachers in regular institutions of
hi
g
her learnin
g
6
x
Number of teachers in other types of schools
7
x
Number of students in regular institutions of
hi
g
her learnin
g
8
x
Registered population
9
x
Natural population growth rate
y
Permanent population
Cui, Z., Wan, S. and Fang, Y.
Study on Influencing Factors of Population Changes in Dongguan City Based on Principal Component-Regression Analysis.
DOI: 10.5220/0011732800003607
In Proceedings of the 1st International Conference on Public Management, Digital Economy and Internet Technology (ICPDI 2022), pages 191-196
ISBN: 978-989-758-620-0
Copyright
c
2023 by SCITEPRESS – Science and Technology Publications, Lda. Under CC license (CC BY-NC-ND 4.0)
191
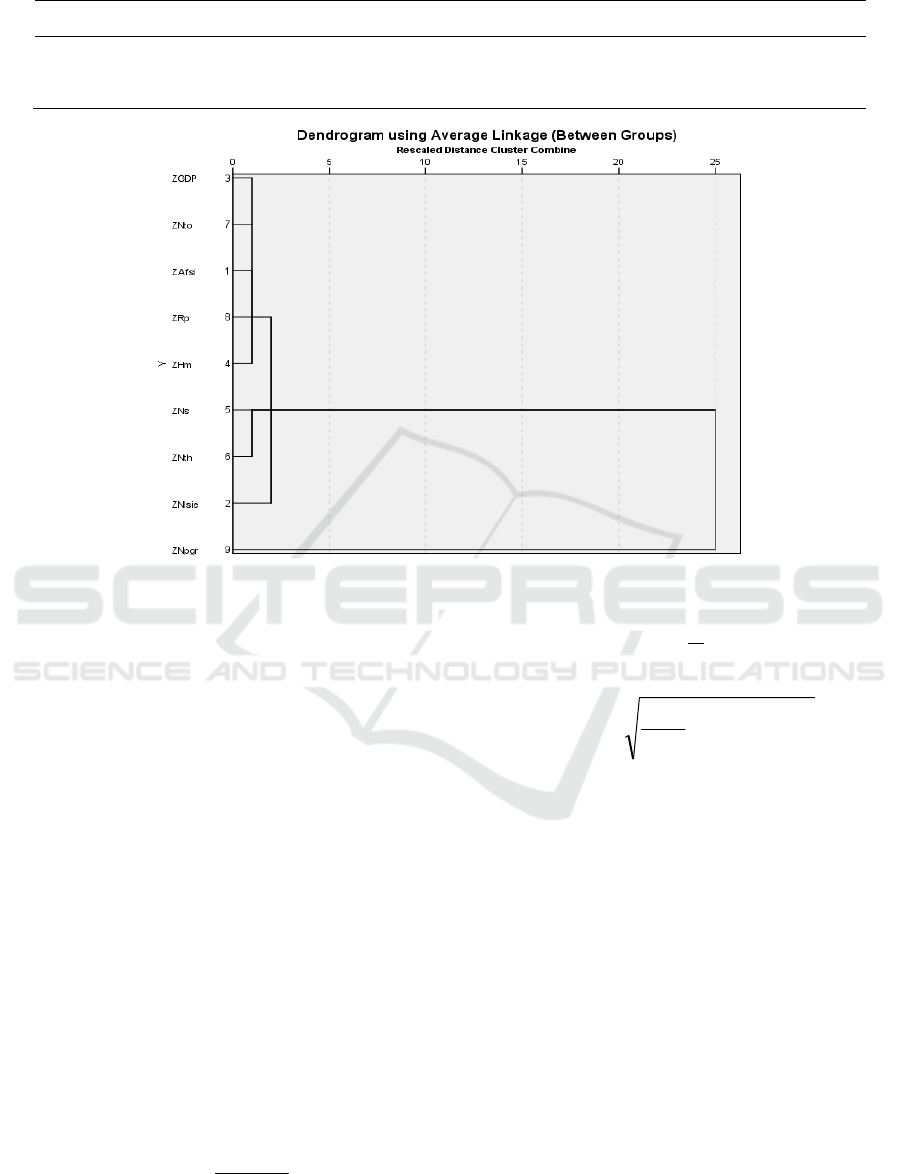
Table 2: Pearson correlation coefficients between permanent population and 9 data variables and their significant test results.
1
x
2
x
3
x
4
x
5
x
6
x
7
x
8
x
9
x
Pearson correlation
coefficient
.831
**
.833
**
.821
**
.881
**
.748
**
.849
**
.696
**
.872
**
-.488
**
si
g
.000 .000 .000 .000 .000 .000 .000 .000 .007
Figure 1: Cluster analysis of 9 data variables.
SPSS25.0 software is used to calculate the Pearson
correlation coefficients between the permanent
population and the 9 data variables (Deng, 2017) and
analyze influencing factors quantitatively (Wang,
2020), as shown in Table 2.
There is a significant linear correlation between
the permanent population and the 9 data variables at
the significance level. The number of teachers and
students in regular institutions of higher learning and
the natural population growth rate are moderately
related to the permanent population, while the other 6
variables are highly linearly related to the latter.
3 DISTINGGUISHING THE
SIMILARITY OF VARIABLE
GROUPS
R-type clustering is made in the cluster analysis, and
variables are classified based on their similarity.
Before clustering, the data must be standardized to
overcome the influence of dimensions (Zhao, 2014):
j
jij
ij
x
x
σ
μ
−
=
*
(1)
=
=
n
i
ijj
x
n
1
1
μ
(2)
=
−
−
=
n
i
jijj
x
n
1
2
)(
1
1
μσ
(3)
The clustering dendrogram is shown in Figure 1.
It is appropriate to divide variable groups into 3
categories by the cutting level of clustering (Wang,
1998) according to the clustering dendrogram.
Category I: Regional GDP, annual fixed asset
investment, highway mileage, number of teachers in
other types of schools and registered population; the
variables in this category mainly involve economic
development;
Category II: Number of large-scale industrial
enterprises, number of teachers in regular institutions
of higher learning and number of students in regular
institutions of higher learning; large-scale industrial
enterprises and institutions of higher learning are
similar in the agglomeration of floating population.
Category III: Natural population growth rate.
In order to have a definite understanding of the
clustering results, SPSS25.0 is used to give the
Pearson correlation coefficients between the 9 data
variables, as shown in Table 3.
ICPDI 2022 - International Conference on Public Management, Digital Economy and Internet Technology
192

The variable groups can be divided into 2 categories
by their Pearson correlation coefficients;
Category I: Natural population growth rate;
Category II: Economic and social development
indicators represented by GDP;(**Significant at
0.01).
4 DIMENSIONALITY
REDUCTION OF VARIABLE
GROUPS
In principal component analysis, the original
variables are transformed into a few new variables.
The sum of variances of the new variables is as
close as possible to that of the original ones.
Therefore, the number of variables is decreased,
achieving the effect of dimensionality reduction of
the data set (He, 2012). Information omission and
overlap are taken into account in the process.
The analysis results are shown in Table 4.
Table 4: Kmo test and Bartlett test.
KMO
value
Approximate
chi-square
Degree of
freedom
Sig
0.837 738.779 36 0.000
The KMO test value is 0.837 and Bartlett test
probability 𝑠𝑖𝑔 <0.05 . The data set is appropriate
for principal component analysis.
Table 5: Variance explanation of principal component
analysis.
Principal
component
facto
r
s
Eigenvalues Variance%
Cumulative
variance%
Component 1 7.658 85.084 85.084
Component 2 1.092 12.129 97.213
Two principal components are extracted and the
cumulative contribution rate of their variances is 97.213%.
Table 3: Pearson correlation coefficients between variable groups.
Pearson correlation
coefficient
Z-𝑥
Z-𝑥
Z-𝑥
Z-𝑥
Z-𝑥
Z-𝑥
Z-𝑥
Z-𝑥
Z-𝑥
Z-𝑥
1
0.992
∗∗
0.927
∗∗
0.961
∗∗
0.985
∗∗
0.998
∗∗
0.957
∗∗
0.982
∗∗
-0.056
Z-𝑥
1
0.951
∗∗
0.973
∗∗
0.968
∗∗
0.995
∗∗
0.931
∗∗
0.970
∗∗
-0.099
Z-𝑥
1
0.914
∗∗
0.899
∗∗
0.941
∗∗
0.843
∗∗
0.931
∗∗
-0.138
Z-𝑥
1
0.918
∗∗
0.968
∗∗
0.874
∗∗
0.943
∗∗
-0.197
Z-𝑥
1
0.977
∗∗
0.987
∗∗
0.963
∗∗
0.091
Z-𝑥
1
0.945
∗∗
0.983
∗∗
-0.096
Z-𝑥
1
0.927
∗∗
0.129
Z-𝑥
1 -0.085
Z-𝑥
1
Table 6: Factor loading matrix in principal component analysis.
Component matrix
Data indicators
Components
1 2
Regional GDP (RMB 100 million) .997 .014
Annual fixed asset investment (RMB 100 million) .995 -.037
N
umber of large-scale industrial enterprises (Nos.) .947 -.094
Highway mileage (km) .967 -.144
N
umber of teachers in regular institutions of higher learning over
the
y
ears
(
Nos.
)
.982 .165
N
umber of teachers in other t
yp
es of schools
(
Nos.
)
.998 -.029
N
umber of students in regular institutions of higher learning (0,000) .952 .213
Registered population (0,000) .984 -.019
N
atural growth rate -.067 .993
Note: Extraction method: principal component
Study on Influencing Factors of Population Changes in Dongguan City Based on Principal Component-Regression Analysis
193

Table 7: Principal component coefficients.
1prin
2prin
*
1
x
0.3603 0.0134
*
2
x
0.3596 -0.0354
*
3
x
0.3422 -0.0900
*
4
x
0.3494 -0.1378
*
5
x
0.3549 0.1579
*
6
x
0.3606 -0.0278
*
7
x
0.3440 0.2038
*
8
x
0.3556 -0.0182
*
9
x
-0.0242 0.9503
Table 8: Test of regression coefficients between permanent population variable and regional GDP and natural population
growth rate in the standardized data.
Model Coefficient t Si
g
VIF
Regional GDP 0.807 12.444 0.000 1.003
Natural population growth rate -0.443 -6.835 0.000 1.003
In the first principal component, all variables
except the natural population growth rate have higher
values and equivalent orders of magnitudes,
indicating that the corresponding variables have
equivalently great influence on the first principal
component. Economic development has brought the
demand for population, while the agglomeration of
population has promoted economic growth (Liu,
2015; Wang, 2018; Gao, 2016). Population growth is
both the result and cause of economic development
(Smith, 2003).
In the second principal component, the natural
population growth rate has the greatest impact.
Calculation formula of principal components:
)4(042.0
3556.03440.00.36063549.0
3494.03422.03596.06033.01
*
9
*
8
*
7
*
6
*
5
*
4
*
3
*
2
*
1
x
xxxx
xxxxprin
×−
×+×+×+×+
×+×+×+×=
*
8
*
7
*
6
*
5
*
4
*
3
*
2
*
1
0182.02308.00.0278-1579.0
1378.0-09.0-0354.0-0134.02
xxxx
xxxxprin
×−×+××+
××××=
)5(9503.0
*
9
x×+
*
i
x
is the standardized variable of
i
x
𝑖 1...9.
5 REGRESSION ANALYSIS
Equations used in the regression analysis describe the
correlation between dependent variables and
explanatory variables. The process includes the least
squares estimation of coefficients of regression
equations, the significance test of equations and the
significance test of regression coefficients.
A regression model of the standardized permanent
population variable, standardized regional GDP
variable and standardized natural population growth
rate is established with the input method in the SPSS
regression analysis according to the results of the
cluster analysis of variable groups:
and . R
2
is adjusted
to 0.878.
Probability of significance test of the model
000.0=sig
.
Regression equation:
(6)
A linear regression equation is established for the
standardized permanent population variable and the 2
principal components:
ICPDI 2022 - International Conference on Public Management, Digital Economy and Internet Technology
194

Table 9: Test of regression coefficients between standardized permanent population variable and 2 principal components.
Model Coefficient t Si
g
VIF
𝑝𝑟𝑖𝑛1
0.303 13.452 0.000 1.000
𝑝𝑟𝑖𝑛2
-0.419 -7.014 0.000 1.000
𝑅 = 0.946 and 𝑅
= 0.895. R
2
is adjusted to 0.887.
Probability of significance test of the model 𝑠𝑖𝑔 =
0.000.
Regression equation:
2419.01303.0
*
prinpriny ×−×=
(7)
Substitute equations (4) and (5) into equation (7):
*
6
*
5
*
4
*
3
*
2
*
1
*
0.12090414.01636.0
1414.01238.00.1036
xxx
xxxy
×+×+×+
×+×+×=
*
9
*
8
*
7
4055.0-1541.00188.0 xxx ××+×+
(8)
It can be concluded that the 9 variables are
sequenced below based on the influence on the
permanent population variable:
*
7
*
5
*
1
*
8
*
6
*
2
*
3
*
4
*
9
xxxxxxxxx >>>>>>>>
(9)
6 DISCUSSION OF VARIABLES
IN THE REGRESSION MODEL
The regression model in this paper is explained as
below based on existing literature research results.
The labor-intensive enterprises represented by the
"three-plus-one" trading-mix and "three kinds of
foreign-funded enterprises" gathering in Dongguan in
the process of reform and opening-up have greatly
improved the demand for labor force and contributed
to the inflow of floating population (Gao, 1995).
Regional income differences represented by regional
GDP and the number of large-scale enterprises are
two manifestations of China's population migration
mechanism (Gao, 1995). From the perspective of
urban-rural dual economic structure, the
agglomeration of production factors and the
advantages of production methods in urban areas
have facilitated the flow of labor from the low-
productivity agricultural sector to the high-
productivity industrial sector (Kong, 2001), forming
population migration.
7 CONCLUSION
In this paper, principal component analysis is used to
rank the influence degree of many independent
variables which are linearly related to the dependent
variables. In view of the dimensionality reduction
idea of principal component analysis, this paper uses
the cluster method of independent variables. Through
the inter group variable correlation analysis, the
representative variables are taken from the unrelated
variable group for regression analysis, and the
dimensionality reduction effect similar to that of
principal component analysis can also be achieved.
The degree of explanation of independent variables to
dependent variables of the two methods is almost
equal.
ACKNOWLEDGEMENT
Supported by the young teacher development fund of
City College of Dongguan University of Technology
(2019QJY008Z);
Supported by Dongguan Science and Technology
of Social Development Program (20221800900952);
REFERENCES
Cai Fang. Future demographic dividend - the development
of sources of China's economic growth [J]. Chinese
Journal of Population Science, 2009, 2 (1): 4-12.
Chen Youhua. Demographic dividend and China's
economic growth [J]. Journal of Jiangsu Administration
Institute, 2008(4): 60-65.
Deng Weibin, Zhou Yumin et al. Practical course of
SPSS23 statistical analysis [M]. Beijing: Publishing
House of Electronics Industry, 2017.
Gao Jian, Wu Peilin. Impact of urban population size on
urban economic growth [J]. Urban Problems, 2016(6):
4-13.
Gao Guoli, Ji Renjun. Research on population migration in
the process of regional economic development - Taking
the Pearl River Delta region in Guangdong Province as
an example [J]. Economic Geography, 1995, 15(2): 76-
82.
Study on Influencing Factors of Population Changes in Dongguan City Based on Principal Component-Regression Analysis
195

He Xiaoqun. Multivariate statistical analysis [M]. Beijing:
China Renmin University Press, 2012.
Kong Weijun. On the influence of rural floating population
on urban-rural dual economic structure [J]. Guangxi
Social Sciences, 2001(1):129-132.
Li Wenxing, Zhang Zhengpeng. Forecast of Guangdong's
population trend under the "two-child" policy [J].
Journal of Guangzhou University (Social Science
Edition), 2018,17(10):89-97.
Liu Zhijia, Huang Heqing. Analysis of spatial-temporal
evolution characteristics of the interaction between the
expansion of construction land and economic and
demographic changes in the Pearl River Delta region
[J]. Resources Science, 2015, 37(7): 1394-1402.
Pan Wenxuan. Focus and path selection of the improvement
of structural tax reduction policy [J]. Taxation and
Economy, 2012(4): 67-71.
Smith. A. The wealth of Nations[M]. New York: Bantam
Classics,2003:35-40.
Wang Xiaoqin, Wang Hongmei." Demographic dividend"
effect and China's economic growth [J]. Economist,
2007(1): 104-110.
Wang You. Transformation of migration pattern of floating
population in Hebei Province and analysis of
influencing factors [D]. Hebei Normal University,
2020.
Wang Xiao'an. Cutting level determination of fuzzy graph
clustering [J]. Acta Botanica Boreali - Occidentalia
Sinica, 1998, 18(3): 445-449.
Wang Zhiyong. Population agglomeration and regional
economic growth - A test of Williamson hypothesis [J].
Social Sciences in Nanjing, 2018(3):60-69.
Yan Yueping, Huang Meixuan, Zheng Yiran. Research on
changes and trend of China’s population age structure
[J]. Dongyue Tribune, 2021, 42(1): 148-163.
Zhao Weihua. Law of urban population growth in China
and its enlightenment [J]. Journal of the Party School of
the Central Committee of the C.P.C, 2016, 20(3): 80-
85.
Zhong Shuiying, Li Kui. Summary of research on the
relationship between demographic dividend and
economic growth [J]. Population & Economics,
2009(2): 57-61.
Zhao Jing, Dan Qi. Mathematical modeling and
experiments. 4th edition [M]. Beijing: Higher
Education Press, 2014.
ICPDI 2022 - International Conference on Public Management, Digital Economy and Internet Technology
196
