
Granger Causality Between the Import Policy and the Comparative
Advantage in China’s Anti-Biotic Product
Yu Hong
1
, Lin Zhang
1
, Kexuan Yu
1
and Aijing Hu
2*
1
College of International Economics and Trade, Jilin University of Economy and Finance, Changchun, China
2
Changchun Humanities and Sciences College, Changchun, China
Keywords: China, Import, Antibiotic Product, Granger Causality.
Abstract: This study examined the Chinese "net export ratio" (NX
ck
) that measures the trade balance as a proportion
of the total trade, "revealed symmetric comparative advantage for export" (RX
ck
) and "import restriction"
(HM
ck
) in the anti-biotic products, by using data of 1987-2019 from UN COMTRADE database. Short-run
and the long-run Granger causality tests between "RX
ck
" and "HM
ck
" were performed with both of the
directions with the specific sizes for the effects. The results revealed that in the optimal non-linear models,
HM
ck
improves RX
ck
with positive short-run effect (p=0.033) and long-run effect (p=0.066); HM
ck
lags
have negative long-run effect (p=0.080) on the indicator of HM
ck
itself, indicating that the Chinese import
restriction intervention in the trade of the anti-biotic products has not been inertial.
1 INTRODUCTION
The 2019-ncov (COVID-19) infected pneumonia has
swept China and across the world. World Heath
Organization reckoned it as a pandemic and declared
the disease a Public Health Emergency of
International Concern (PHEIC). Many countries
including China have started the R&D in the
effective COVID-19 vaccine. The disease has also
triggered the interest in developing the other anti-
biotic pharmaceutical products to protect the public
health, and has aroused the necessity of reassessing
the trade policies in the anti-biotic products or the
anti-biotic pharmaceutical industry.
The theories of dynamic comparative advantage
argue that a developing country should support the
development of the key industries by trade
protectionism, in the form of either export promotion
or import restriction or both (List, 2011; Grossman,
1991; Keynes, 1997), in order to improve the
national comparative advantage in the export of the
industries (Smith, 1998). The Chinese policy makers
and a lot of researchers, however, have insisted that
China is of free trade and is to be against any form of
protectionism. Is there an applicable method to
measure the degree of trade protectionism? If there
is, how is the protectionism in the Chinese import in
the anti-biotic products? Can the import restriction
affect the comparative advantage in the trade of anti-
biotic products? This study aims to answer the
questions by empirical analyses.
This research forwarded an innovative approach
to measuring a country's import restriction
protectionism (HM) by the difference between her
net export ability (NX) and her revealed symmetric
comparative advantage in import (RM), which is the
deduction of Ricardian theory of comparative
advantage under the condition of perfect free trade.
(Ricardo, 2015; Salvatore, 2013)
The econometric (time series) analyses based on
the vector error correction (VEC) models revealed
that the Chinese import restriction policy can
increase the country’s comparative advantage in the
export of anti-biotic products, which is in accordance
with the protectionist theory of "dynamic
comparative advantage".
There is another protectionist policy intervention
in the form of import promotion. This research also
reckons the "import promotion" as trade protectionist
policy intervention, because a government may adopt
the trade policies in this form for various reasons.
This may be true for the Chinese trade in energy
products because China has been a country with
booming domestic energy demand in her fast
economic development during the past decades,
which may have encouraged the Chinese government
to promote the energy import instead of restricting it.
80
Hong, Y., Zhang, L., Yu, K. and Hu, A.
Granger Causality Between the Import Policy and the Comparative Advantage in Chinaâ
˘
A
´
Zs Anti-Biotic Product.
DOI: 10.5220/0011730600003607
In Proceedings of the 1st International Conference on Public Management, Digital Economy and Internet Technology (ICPDI 2022), pages 80-84
ISBN: 978-989-758-620-0
Copyright
c
2023 by SCITEPRESS – Science and Technology Publications, Lda. Under CC license (CC BY-NC-ND 4.0)

2 METHODOLOGIES AND DATA
2.1 Data Curation
This research obtained the 4-digit import and export
yearly data for China and the world in the anti-biotic
products (code: 5413) (Chen, 2020) on March 14
th
,
2021, for the period of 1987-2019, under the
classification of SITC Rev.1 from United Nation
Comtrade database (https://comtrade.un.org/data/).
Some countries’ postponed data reporting to UN
Statistics Division makes the data for the recent years
only partially available (Balassa, 1965; Dalum,
1998). Note that the later accession to the database
may generate slightly different data that may have
impacts on the results.
2.2
The Indicators for The Import
Patterns
• Net export ratio
The indicator of net export ratio (NX) measures a
county's trade balance in the total trade by
NX
ck
= (X
ck
- M
ck)
/ (X
ck
+ M
ck
) (1)
where X is the export and M is the import. The
subscript of c indicate that China, the k indicates the
anti-biotic product. NX
ck
ranges from -1 to 1 with a
mean value of zero around which NX
ck
is distributed
symmetrically.
• Revealed symmetric comparative advantage
Balassa (1965) originated the indicator of
RCA
ck
= (X
ck
/ X
wk
)/ (X
c
/ X
w
) (2)
to capture the comparative advantage that revealed in
the trade. X
c
is the total export of country c and X
w
is
for that of the world (Hong, 2018). RCA
ck
>1 implies
that country c has comparative advantage in product
k, or she is more specialized in product k than the
world as a total (Hong, 2010). Dalum, Laursen and
Villumsen (1998) noted that RCA
ck
ranges from zero
to X
w
/X
c
without a definite mean, and designed the
indicator of
RX
ck
=RSCA
ck
= (RCA
ck
- 1)/ (RCA
ck
+ 1) (3)
to address the problem of the asymmetric distribution
of RCA
ck
(Shi, 2019). The value range of RSCA
ck
or
"revealed symmetric comparative advantage" is [-1,
1] with a definite mean of zero.
This study used RX
ck
to emphasize that it is
applicable to export, and therefore employed
RCAM
ck
= (M
ck
/ M
wk
)/ (M
c
/ M
w
) (4)
RM
ck
=-RSCAM
ck
= -(RCAM
ck
- 1)/ (RCAM
ck
+ 1) (5)
to capture the "revealed symmetric comparative
advantage" in country c's import. Because the larger
RM
ck
reflects that country c imports more product k
than the world average, country c is comparative
disadvantaged. Noting this fact, this research added a
negative sign at the right side of the equals sign in
order to ensure that RM
ck
means the same with RX
ck
.
• The degree of import policy intervention
Under the ideally perfect free trade condition, there is
NX
ck
= RM
ck
(6)
A transposition of this equilibrium generates
HM
ck
= NX
ck
- RM
ck
(7)
where HM
ck
is the indicator of country c's degree of
protectionist import policy intervention which can be
understood as the Chinese import restriction (Pang,
2010).
3 RESULTS AND DISCUSSION
3.1 The Import Patterns of the
Anti-Biotic Product
Figure 1 depicts the Chinese indicators of NX
ck
, RX
ck
and HM
ck
during the sample period of 1987 to 2019.
Figure 1: NX
ck
, RX
ck
and HM
ck
in the Chinese trade in anti-
biotic product (1987-2019).
NX
ck
has been positive but for 1988 when the it
was -0.096. It hit 0.807 in 2015 and the mean is
0.557; RX
ck
was -0.365 in 1990 and reached the high
of 0.583 in 1997 with the mean of 0.283; HM
ck
has
been always positive, implying that China have
adopted the import restriction policies in the anti-
biotic product in order to support the Chinese anti-
biotic industry.
Granger Causality Between the Import Policy and the Comparative Advantage in Chinaâ
˘
A
´
Zs Anti-Biotic Product
81
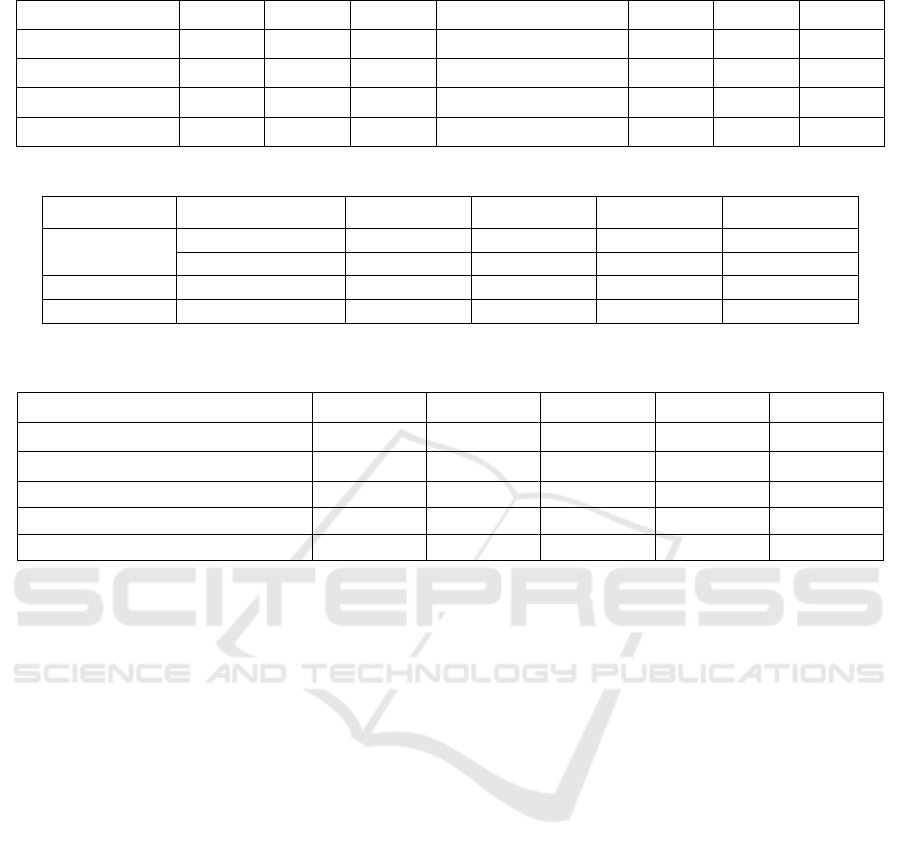
Table 1: ADF unit root test results for RXck,t and HMck (ln(RXck +1) and ln(HMck +1)).
Variable Test type ADF p-value Variable Test type ADF p-value
RX
ck
C, N, 3 -3.98 0.00 ΔRX
ck
C, N, 1 -5.41 0.00
HM
ck
C, N, 0 -3.36 0.02 ΔHM
ck
N, N, 1 -8.14 0.00
ln(RX
ck
+1) C, N, 1 -5.94 0.00 Δln(RX
ck
+1) N, N, 1 -4.80 0.00
ln(HM
ck
+1) C, N, 0 -3.38 0.02 Δln(HM
ck
+1) N, N, 1 -7.93 0.00
Table 2: Number of co-integration.
Data Trend: None None Linear Linear Quadratic
Test Type
No Intercept Intercept Intercept Intercept Intercept
No Trend No Trend No Trend Trend Trend
Trace 0 1 0 0 0
Max-Eig 0 0 0 0 0
a. Critical values based on MacKinnon-Haug-Michelis
Table 3: VEC model specification results.
Information Criteria Model 1 Model 2 Model 3 Model 4 Model 5
Determinant resid covariance (dof adj.) 0.000 0.000
*
0.000 0.000 0.000
Determinant resid covariance 0.000 0.000 0.000 0.000 0.000
*
Log likelihood 91.372
*
93.926 94.023 94.680 96.072
Akaike information criterion -5.291 -5.395
*
-5.335 -5.312 -5.338
Schwarz criterion -4.731 -4.788
*
-4.681 -4.611 -4.591
b. * indicates the model assumption selected by each individual information criterion.
3.2 ADF Unit Root Test Results
Table 1 presents the Augmented Dicky-Fuller
(ADF) test results for RX
ck
and HM
ck
. Because the
relationship of the variables can also be non-linear
and the level series of RX
ck
and HM
ck
recorded have
negative values, the results of ln(RX
ck
+1) and
ln(HM
ck
+1) are also reported. (Shi, 2019; Hong,
2020).
All series are stationary under both linear and
non-linear model assumptions. The first differences,
however, are also stationary (p=0.001), making the
time series are applicable for the econometric
analyses based on the VEC models.
3.3 Selection of The Linea/Non-Linear
Model Assumptions
This research compared the lag interval of
unrestricted vector auto regression (VAR) models
with the maximum lag of 6, which is approximately
one fifth of the total sample period (32 years),
between the linear and the non-linear VAR model
assumptions. For both linear and non-linear model
assumptions, all of the information criteria of FPE,
AIC, SC and HQ selected lag order of 3 as the
optimal. The non-linear models have smaller
information criteria, making us select the non-linear
models with the lag interval of 1-3, which implies
that the optimal VEC models are non-linear with the
lag interval of 1-2.
3.4 Summary of Johansen
Co-Integration
Table 2 summarizes the five sets of co-integration
test types with the critical value set to be 0.05 level.
Trace statistic identified one co-integrating
relation, while Max-eigenvalue identified none. This
may be because the omission of some key
variable(s) in the model, which can be expected to
be improved by extending the model to include the
indicator of the "export policy intervention". This
research, however, reckoned that ln(RX
ck,t
+1) and
ln(HM
ck,t
+1) are co-integrated and then proceeded
to further analyses.
3.5 VEC Model Specification Results
Model 1 in Table 3 assumes "no intercept or
deterministic trend in CE (co-integrating equation)";
model 2 assumes "intercept (no deterministic trend)
ICPDI 2022 - International Conference on Public Management, Digital Economy and Internet Technology
82
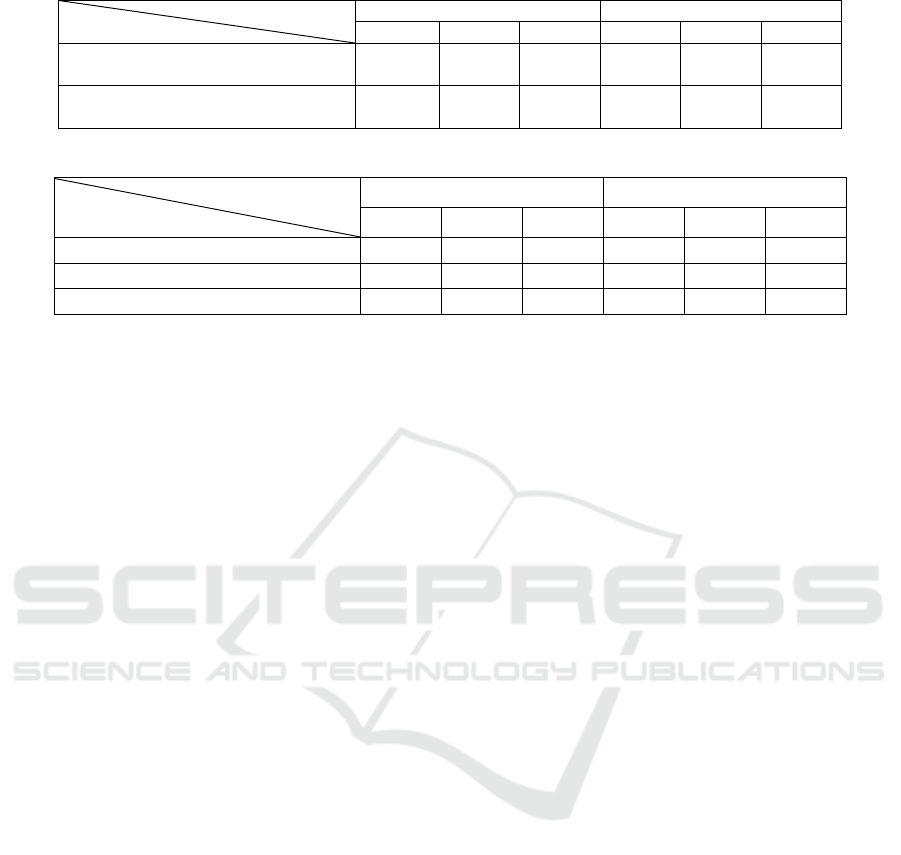
Table 4: Short-run Granger causality test results for ln(RXck,t +1) and ln(HMck,t +1).
Dependent
Independent
Δln(RX
ck,t
+1) Δln(HM
ck,t
+1)
Chi-s
q
p
SE Chi-sq
p
SE
Δln(RX
ck,t-1
+1),
Δln(RX
ck,t-2
+1)
—— —— —— 2.646 0.266 ——
Δln(HM
ck,t-1
+1),
Δln
(
HM
ck,t-2
+1
)
6.850 0.033 1.900 —— —— ——
Table 5: Long-run Granger causality test results for ln(RXck,t +1) and ln(HMck,t +1).
Dependent
Independent
Δln(RX
ck,t
+1) Δln(HM
ck,t
+1)
F-stat p LE F-stat p LE
ECT
t-1
1.604 0.217 —— 0.548 0.466 ——
ECT
t-1
,Δln(RX
ck,t-1
+1), Δln(RX
ck,t-2
+1) 1.251 0.313 —— 0.967 0.111 ——
ECT
t-1
,Δln(HM
ck,t-1
+1), Δln(HM
ck,t-2
+1) 2.719 0.066 0.020 2.531 0.080 -0.105
in CE"; model 3 assumes "intercept (no
deterministic trend) in CE"; model 4 assumes
"intercept and trend in CE"; model 5 assumes
"quadralic deterministic trend", compares the
information criteria for the non-linear VEC models
with the lag interval of 1-2.
The statistics of both "Akaike information
criterion" (AIC) and "Schwarz criterion" (SC)
selected "model 2" as the optimal, and the statistics
of "determinant residual covariance (dof adj.)" also
confirmed this selection. This research thus
determine "model 2" or "intercept in CE, no
deterministic time trend in the VAR" to be the
optimal.
3.6 Short-Run Granger Causality Test
Results
Table 4 reports the results of short-run Granger
causality tests or the block exogeneity Wald tests.
Along with the direction, this research also reports
the specific value(s) for the short-run effect(s) (SE)
by aggregating the coefficients of all lags of the
independent variable(s).
There is a unidirectional Granger causality
running from ln(HM
ck,t
+1) to ln(RX
ck,t
+1)
significantly (p=0.033) with positive short-run effect
(SE=1.900), implying that the import restriction can
improve the Chinese comparative advantage. At
least in the short-run, the prediction of the theories
of dynamic comparative advantage holds for the
trade in anti-biot product.
3.7 Long-Run Granger Causality Test
Results
Table 5 shows the long-run Granger causality test
results.
The long-run effect(s) (LE) are measured by the
converge values (at the 25th period) of the
generalized impulse-response functions after the
shock. The long-run equilibrium error correction
term (ECT
t-1
) of the VEC models does not Granger
cause either Δln(RX
ck,t
+1) or Δln(HM
ck,t
+1). The
lags of Δln(HM
ck,t
+1) jointly with ECT
t-1
, however,
Granger cause Δln(RX
ck,t
+1) with positive long-run
effect (LE=0.020, p=0.066) and Granger cause
Δln(HM
ck,t
+1) with negative long-run effect (LE=-
0.105, p=0.080).
The evidence show that in the long-run, the
Chinese trade in the anti-biot products has also
complied to the predictions of the dynamic
comparative advantage theories. The Chinese import
policy intervention policy has been effective in
improving the export comparative advantage in the
anti-biot product, although marginally significant.
Not surprisingly, the evidence from China differ to
the results for the Indian protectionism policies in
the anti-biotic industry (Hong, 2019). This implies
that even the same industry (product) of the two
comparable developing countries can be different.
4 CONCLUSION
This study obtained the trade patterns of NX
ck
, RX
ck
and HM
ck
for the Chinese trade in the anti-biotic
pharmaceutical products using UN Comtrade annual
data. We conducted time series analyses of "revealed
symmetric comparative advantage for export" (RX
ck
)
and "import restriction" (HM
ck
), including both short-
run and long-run Granger causality tests.
• During the sample period of 1987-2019, China
has restricted the import of the anti-biot product
significantly and has had comparative advantage in
the product export;
Granger Causality Between the Import Policy and the Comparative Advantage in Chinaâ
˘
A
´
Zs Anti-Biotic Product
83

• The Chinese import restriction (HM
ck
) improves
the comparative advantage in the anti-biotic product
(RX
ck
) with positive short-run and long-run effect.
• The lags of HM
ck
have negative long-run effect
on of HM
ck
, implying that the Chinese trade policy
intervention has not been inertial.
The empirical evidence is in accordance with the
predictions of the dynamic comparative advantage
theories. (Ma, 2019; Yang, 2020; Hong, 2021) The
short-run and long-run effects of the import
interventions have improved the comparative
advantage of the anti-biotic industry.
Every country has right to choose its own path to
the development. A developing country's
protectionist policy intervention should not be
criticized so much, as long as it can improve the
country's comparative advantage in a certain specific
industry that is crucial for its development.
ACKNOWLEDGEMENTS
This work was financially supported by Jilin
Provincial Social Science Fund (2020J58, 2020J60),
Changchun Social Science Fund (CSK2020ZYJ-
001) and the College Poverty Stricken Students
Supporting Programme funded by Jilin Provincial
Ecological Industry Company Limited.
REFERENCES
A. Smith, “An inquiry into the nature and causes of the
wealth of nations”, Oxford: Oxford World's Classics,
1998 (1776).
B. Balassa, “Trade liberalization and revealed comparative
advantage”, Manchester Sch. 33 (2) (1965) 99-123.
B. Dalum, K. Laursen, G. Villumsen, “Structural change
in OECD export specialisation patterns: de-
specialisation and 'stickiness'”, Int. Rev. Appl. Econ.
12 (3) (1998) 423-443.
C.J. Chen, K.X. Yu, A.J. Hu, Y. Hong, “How does the
import restriction Granger cause the comparative
advantage of the USA's energy imports”, Basic Clin.
Pharmacol. Toxicol. 126 (S4) (2020) 307.
D. Ricardo, “On the principles of political economy and
taxation”, Cambridge: Cambridge University Press,
2015 (1871).
D. Salvatore, (2013) “International Economics (11th
edition)”, John Wiley & Sons Inc, Hoboken.
D.L. Pang, Y.Hong, “Measuring distortions of trade
patterns: an application to China”, Proc. 2010 IEEE
Int. Conf. Serv. Oper. Logi. Inform. (2010) 124-429.
F. List, “The National system of political economy”,
Hoboken, NJ: John Wiley & Sons, Inc, 2011 (1841).
G.M. Grossman and E. Helpman, “Quality ladders in the
theory of growth”, Rev. Econ. Stud. 58, (1991) 43-61.
G. Shi, Y.M. Yang, A.J. Hu, Y. Hong, “Israel's export
promotion and comparative advantage in services
export: 2005-2018”, Basic Clin. Pharmacol. Toxicol.
126 (S4) (2019) 342
G. Shi, Y. M. Yang, A. J. Hu, Y. Hong, “Assessing the
effectiveness of the import restriction on improving the
Israeli services export comparative advantage”, Basic
Clin. Pharmacol. Toxicol. 126 (S4) (2019) 342-343
Hong, Y., Chen, C. J., Yang, Y. M., Hu, A. J., Ma, P.
(2019) Can protectionism improve the Indian
comparative advantage in the export of penicillin
streptom, tyrocidine and other antibiot? Basic Clin.
Pharmacol. Toxicol.126 (S4): 48
H. X.Yang, Y. M. Yang, A. J. Hu, Y. Hong, (2020) “Time
series analyses of Japan’s export promotion and the
export comparative advantage in electronic and
radiological apparatus”, Basic Clin. Pharmacol.
Toxicol. 126 (S4): 308-309.
J.M. Keynes, “The general theory of employment, interest,
and money”, Amherst, NY: Prometheus Books, 1997
(1936).
P. Ma, Y.M. Yang, K.X. Yu, A.J. Hu, Y Hong, “How
have the degree of import restriction impacted Japan's
revealed comparative advantage in the services
exports?”, Basic Clin. Pharmacol. Toxicol. 126 (S1)
(2020) 121.
P. Ma, Y. M. Yang, K. X. Yu, A. J. Hu, Y. Hong, (2019)
Can India’s export promotion efforts improve the
comparative advantages in the Indian services export?
Basic Clin. Pharmacol. Toxicol. 125 (S1): 119-120.
Y. Hong, Y.M. Yang, X.W. Mu, “The import patterns of
the Korean agro-manufactures: exploring the short-run
and long-run Granger causal relationship”, Adv. Intel.
Syst. Res. 164 (2018) 109-112.
Y. Hong, H.W. Su, “A test of dynamic comparative
advantage hypothesis using panel data of the Chinese
trade in medium-technology products”, 2010 Int. Conf.
Manage. Sci. Eng. (2010) 1600-1605
Y. Hong, K. X. Yu, Y. M. Yang, A. J. Hu, P. Ma,
“Exploring Granger causality of China's policies of
export promotion and import restriction in the
medicinal and pharmaceutical products”, Basic Clin.
Pharmacol. Toxicol. 126(S4) (2020) 61-62
Y. Hong, C. J. Chen, D. Yan, T. Liu, (2021) “Short-run
and long-run Granger causality analysis of the United
Kingdom’s trade patterns in the fossil energy trade”,
IOP Conf. Ser.: Earth Environ. Sci. 702 012008.
doi:10.1088/1755-1315/702/1/012008.
ICPDI 2022 - International Conference on Public Management, Digital Economy and Internet Technology
84
