
Study Experimental of Cooling Tower Forced Draft With Variation
of Ratio Obstacle in Film Filler
Achmad Syifa'urromli, Arrad Ghani Safitra and Fifi Hesty
Politeknik Elektronika Negeri Surabaya, Institut Teknologi Sepuluh Nopember, Kampus Jl. Raya ITS, Keputih, Kec.
Sukolilo, Kota SBY, Jawa Timur 60111, Indonesia
Keywords: Cooling Tower, Forced Draft, Filler Ratio Obstacle, Efficiency, Performance.
Abstract: This study aims to build and test the Cooling Tower of the Forced draft type. Cooling Tower is a heat
exchanger that functions to cool water with high temperatures from the condenser and remove heat into free
air or atmosphere in the power plant. It aims to bring the water back to its normal temperature or original
condition. To cool, supplier components are needed, one of which is filler. The filler is a very influential
compoent, because the contact between liquid (hot water) and gas (cooling water) occurs in fillers with heat
transfer of conduction. This research was conducted by changing or varying the type of obstacle ratio. The
variation of the filler film is to calculate the ratio of the resistance area and surface area of the filler film with
a variation value of 1 without filler, a variation of 2 times 0.31 , with the type of material used which is
Steinleesstell 0.75 mm. The results showed their effectiveness of 0.47 and 2.43 and the resulting efficiency
of 29.53% and 54.48%.
1 INTRODUCTION
The cooling system plays an important role in
maintaining the temperature of the production
machine so that it can work optimally. An example of
a cooling system is a cooling tower which is a heat
exchanger to lower the temperature the of
wateairflowir flow. One type of cooling tower is a
forced draft cooling tower (Mugisidi et al., 2021). In
the forced draft type, hot water flows down through a
barrier in the form of ,filler and from under the
airflowir flow is blown. The performance of cooling
towers is greatly influenced by filler materials (fillers)
both in the form of arrangements and types of raw
materials (fillers).
The type of filling material used in the cooling
tower has an important point because it provides a
surface area factor that affects the efficiency
especially the thermal performance of the charging
zone of 70% of the heat dissipation capacity
depending on the charging zone (E. Novianarenti et
al., 2019).
Research on the type of cooling tower type forced
draft is still rare because many studies use cooling
tower type wet and type induced draft. Many wet-
type studies are widely used toperformanceomancy
values and NTU values ( Mirabdolah Lavasani et al.,
2014).
The factor that affects the rate of heat transfer
from hot water to air as a cooling medium is when the
two fluids meet in the filler. Filler functions as a
barrier and breaker of water droplets and slows down
the motion of waterfalls so that the contact time
between fluids is longer and the contact area is also
greater, it will increase the amount of heat transfer
that occurs. Some of the studies that have been carri
ouof support for cooling towers include varying the
composition of fillers to obtain cooling tower
performance characteristics (Pita & Sob, 2020),
For the cooling tower performance, several things
must be considered, including the value of the heat
transfer rate,number of trans the fer units (NTU), and
the effectiveness of the cooling tower. In previous
studies, cooling tower induce drafts developed
variations in filler shapes with variations in straight,
zigzag, and wavy fillers and resulted in highest efthe
fectiveness in wave filler variations (Eky
Novianarenti & Setyono, 2019).
This research will compare cooling tower forced
draft by comparing cooling towers without fillers
(empty) with cooling towers containing fillers which
have a obstacle ratio value of 0.31. The data taken are
the discharge of incoming water, the temperature of
Syifa’urromli, A., Safitra, A. and Hesty, F.
Study Experimental of Cooling Tower Forced Draft With Variation of Ratio Obstacle in Film Filler.
DOI: 10.5220/0011710700003575
In Proceedings of the 5th International Conference on Applied Science and Technology on Engineering Science (iCAST-ES 2022), pages 25-30
ISBN: 978-989-758-619-4; ISSN: 2975-8246
Copyright © 2023 by SCITEPRESS – Science and Technology Publications, Lda. Under CC license (CC BY-NC-ND 4.0)
25
water in and out, the temperature of wet and dry air in
and out, and the speed of air. After data collection,
data processing is carried out to obtain calorific
values, effectiveness values, NTU values, efficiency
and evaporation that occur.
2 EXPERIMENTAL APPARATUS
AND PROCEDURE
The cooling tower made is a forced draft type cooling
tower. With cooling air conditions using a fan /
blower. The hot fluid used is water by raising the
temperature to a temperature of 60 °C with a heater
of 1000 watts. The hot fluid is then pumped into the
cooling tower with a cooling tower size of 0.15 x 0.15
x 1.1 m.
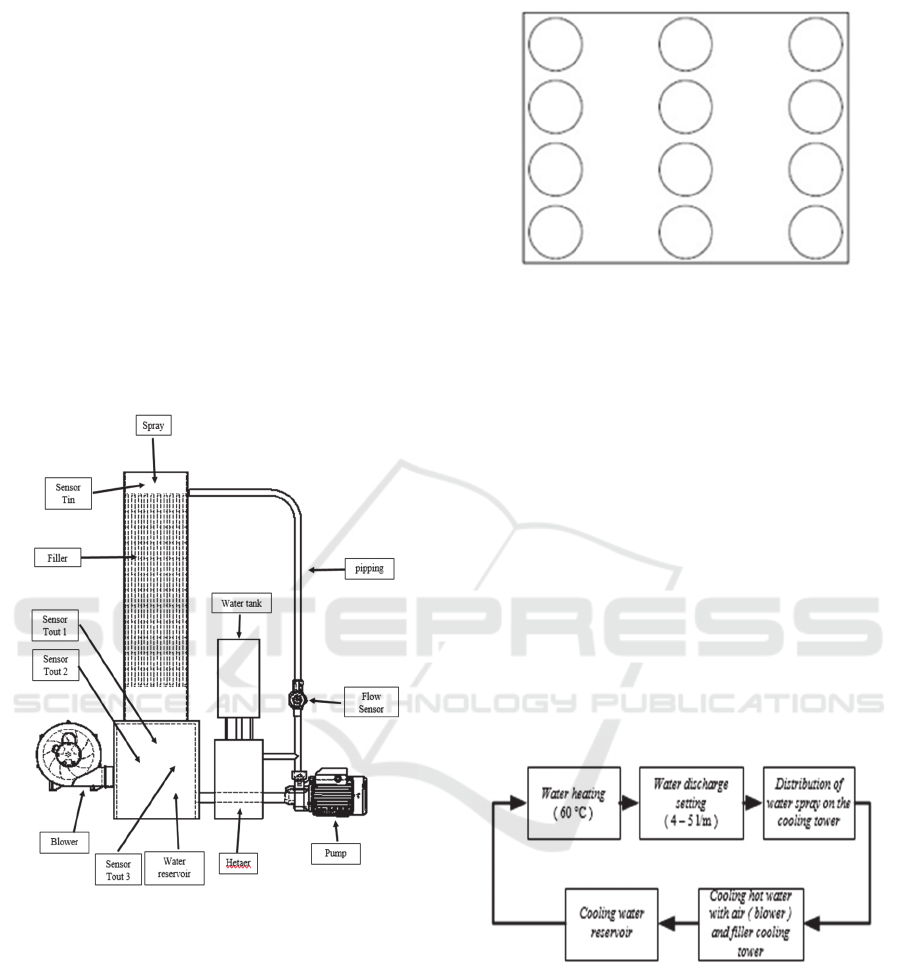
Figure 1: Scheme Cooling tower.
Seen As seenig.1 there is a filler in the cooling
tower which functions as a barrier to the flow of hot
fluid (hot water) and cold fluid (air). The fifillersed
has dimensions of 0.13 x 0.1 m with a total of 6 filler
layers and has 8 levels and the type of material used
is an aluminum plate with a thickness of 0.75 mm.
Figure 2: Filler ratio 0.31.
In fig.2 is an image of one filler layer with a
anbstacle ratio of 0.31. The obstacle ratio is obtained
by adding obstacles (rounds on fig.2) with
dimensions of 21 mm in diameter and 3 mm
invulnerability using acrylic with an amount of 24
pieces (front layer and back layer), and the ratio value
is obtained by a comparison of the area of the total
obstacle divided by the total area of 1 filler layer.
In fig.1 there is the placement of sensors used for
data retrieval and data processing. For the
temperature sensor, namely using a thermocouple
sensor, for the water discharge sensor using a flow
meter ,and everything is connected to the Arduino.
Data collection includes the temperature of the heated
fluid in and out, the discharge of hot fluid flow, the
temperature of wet bulbs in and out, the dry
temperature out and in, and the speed othe f incoming
wind.
Figuro 3: retrievalrival process.
On fig. 3, namely the stages for data retrieval for
data processing. The first stage ensures that the
cooling tower and filler used are perfectly installed,
fill the water into the heater and then heat the water
by adjusting the temperature set point to a
temperature of 60 waiting and wait for the water
temperature to reach the set point value, then turn on
the pump and blower and adjust the valve opening
with a range of 4-5 l / min. do data collection, data
collection is carried out as much as 10-12 times data
iCAST-ES 2022 - International Conference on Applied Science and Technology on Engineering Science
26

collection with the condition that if the water
temperature decreases and the temperature wett is
always lower, then the next data collection can be
continued. After all the data retrieval on variation 1 is
done, turn ofpertains peraltans and replace them with
the second variation.
3 ANALYSIS METHOD
The performance of the cooling tower can be known
by the following equations and can also be analyzed
with the approach of the value of the range and the
value of the approach. And the equations used are as
follows the range
Range
Range is the value of the difference between the
temperature of the heat fluid entering and leaving the
cooling tower, and if the difference in value is high,
the coolong tower can be said to be effective in
performance, and the formula is (H et al., 2014) :
Range (°C) = [T
in
- T
out
] (1)
Approach
Approach is the value of the difference between
the temperature of the hot fluid out of the cooling
tower and the twet bulbure of the wetbulb in, the
lower the value, the better the performance of the
cooling tower. and the formula is (H et al., 2014) :
Approach (°C) = [T
out
– T
wet, in
] (2)
The paradeterminingeded in determing the value
of heat transfer rate (q), effectiveness ε) , number of
a transfer unit (NTU), efficiency, and evaporation loss
are the following values: temperature water inlet ( T
in
), temperature water outlet ( T
out
), Temperature wet-
bulb in and out ( T
wetin
and T
wetout
), temperature dry in
and out ( T
dryin
and T
dryout
), water mass flow rate ( m
,
),
and inlet air flow rate (V)
Inlet air Characteristic
From fig.4 it is used to find the value of the
calculation value of the inlet air characteristic which
includes realtive humirelativen), absolute humidity
(ωin), the rate of incoming moist air ( m
,
moist in
),the rate
of w ater vapor in the air (m
,
vin
), the flow rate of dry
air masses(m
,
dry air
)And from fig4. Can be used to find
relative humidity by using temperature dryin ( T
dryin
)
and temperature wet in ( T
wetin
)(Singh & Das, 2016)
Absolute humidity (ω
in
) the formula is (3).
ω
in
= 0,622
p
v, in
p - p
v,in
(3)
p
v, in
= ϕ
in
× p
g,in
(4)
The rate of incoming moist air
(
ṁ
𝒎𝒐𝒊𝒔𝒕 𝒊𝒏
the
formula is (5).
Figure 4: Psychometric chart.
m
moist,in
= ρ
air
× V × A
u
(5)
Based on table A-2 of Stoecker's book the nature
of humid air at measured temperatures (T
dryin
) to find
a specific volume (m³/kg) so that Pudara = 1/v.
The flow rate of dry air masses((ṁ
the
formula is (6).
m
v,in
=
m
moist,in
1
ω
in
+1
(6)
h
air,in
= C
p
T
1
+ω
in
h
v,in
(7)
and the h
vin
value is obtained using a psychometric
chart table at T
dryin
temperature.
The flow rate of dry air masses (
ṁ
𝒅𝒓𝒚 𝒂𝒊𝒓
the
formula is (8).
m
dry air
= m
moist,in
- m
v,in
(8)
Outlet Air Characteristics
On the calculation of the outlet air
chareteristicharacteristics Fig. 4, by using the dry out
temperature ( T
dry out
) and wet out temperature ( T
wetout
)parameters to find out the value of the relative
humidity(
ϕ
out
, while to find other parameters using
the following equations: (Singh & Das, 2016).
ω
out
= 0,622
p
v, out
p - p
v,out
(9)
p
v, out
= ϕ
out
× p
g,out
(10)
how to find
p
g,out
by using the A-2 stoecker table
Mass flow vapour out vaporrmula is
m
v,out
= ω
out
𝑥 𝑚
dry air
(11)
Study Experimental of Cooling Tower Forced Draft With Variation of Ratio Obstacle in Film Filler
27

Mass flow rate evaporation m
evap
the formula is
(12).
m
evap
= m
v,out
- m
v,in
(12)
Mass flow rate outlet moist air (m
moistout
) the
formula is (13).
m
moist,out
= m
moist,in
+ m
evaporation
(13)
Water Characteristics
The result of the difference between the inflow rate
(
𝑚
and the magnitude of the evaporation rate m
evap
and the formulated as follows (14).
m
wout
= m
win
- m
evap
(14)
and how to find (
𝑚
i.e. by using the conversion
from discharge (l/m) to (kg/s)
Heat mass transfer or kalor
q = m
win
× h
win
-
m
wout
× h
wout
(15)
enthalpy values are searched using tables A-2
properties of saturated water (liquid vaporliquid-
vaporwater temperatures in and
Maximum Kalor
q
max
=
m
win
× h
win
-
m
wout
× h
wwb
(16)
h
wwb
is the enthalpy obtained from the temperature
of the water outlet (T
out
) coupled with the wetbulbin
temperature (T
wetin
) in then divided by 2.
Effectiveness
Effectiveness is a comparison between the actual
heat released by the cooling tower and the maximum
heat that the cooling tower may be able to remove and
formulated such as (17).(ghani saitra et al., 2016;
Ramkrishnan & Arumugam, 2013).
ε =
q
q
max
(17)
Number of Transfer Unit (NTU)(Jaber & Webb,
1989)
NTU = -
ln
1 - ε
1 - εm
*
1 - m
*
(18)
m
*
=
m
moistin
m
moistout
×
C
s
C
p
(19)
C
s
=
h
win
- h
wout
T
in
- T
out
(20)
Evaporation loss
is the evaporation loss per mass conditioned
subduction every 1 °C at each unit of time.
Evaporation loss usually represents the efficiency of
cooling towethe r and the heat of equipment. There is
a formula to calculate evaporation loss
volume:(Tower, n.d.) (21)
Evap loss = 0.00085 × 1.8 × circulating rate
m
3
hr
×
T
w,in
-T
w,out
4 RESULT AND DISCUSSION
After data collection, data processing can be carried
out to determine the performance of the cooling tower
which is influenced by the obstacle ratio on the filler
film which includes data: range and approach,
maximum calorific value and calorific value,
effectiveness and Number of Transfer Unit (NTU), as
well as efficiency values and evaporation loss.
Table 1: Data Process Result.
PARAMETER
variation of filler
U
NIT
No Filler 0,31
Range 7,34 11,45 °C
Approach 17,52 13,38 °C
Q 2,47 4,18
kJ/
s
Q max 5,29 5,91
kJ/
s
efektivitas 0,47 0,71
NTU 0,87 2,33
efisiensi 29,53 54,48 %
evaporation
loss
5,0064466
88
8,51735
8735
ml
C/min
Based on the results of data processing above Tab.
1 can be known to be graphed as shown below.
Figure 5: Graph of the effectiveness of Obstacle ratio
variation.
Effectiveness is a depiction of the performance of
the cooling tower which can be seen from the range
0,47
0,71
0,00
0,20
0,40
0,60
0,80
NoFiller 0,31
EFFECTIVENESS
OBSTACLE RATIOVARIATION
EFFECTIVENESS
iCAST-ES 2022 - International Conference on Applied Science and Technology on Engineering Science
28

value and approach value. The greater the value of the
resulting range value, the cooling tower can be said to
be effective but also must pay attention to the
approach value also because the smaller the value of
the approach, the cooling tower can be called an
effective cooling tower. The range and approach
values of the cooling tower without fillers are 7.34 °C
and 17.52 °C and can be seen from Tab.1 that with
the addition of fillers at the obstacle ratio level of 0.31
resulting in range and approach values of 11.45 °C
and 13.38 °C, this indicates that fillers with a obstacle
ratio level of 0.31 can improve the performance of
this cooling tower.
Figure 5. is to illustrate that the effectiveness of
the cooling tower, with an empty condition and with
a filler condition whose variation in the ratio of the
obstacle is 0.31 . It can be seen that the effectiveness
value has increased quite significantly due to the
obstacles that occur in the cooling tower due to the
filler. With an effectiveness value of no filler of 0.47
and with filler an obstacle ratio level of 0.31 resulted
in a value of 0.71.
Figure 6: Graph of the NTU of obstacle ratio variation.
From fig.6 is a graphic depiction of the number of
transfer unit (NTU) values which show that in cooling
towers nilia NTU is so small because the transfer of
heat resistance is so small that it can be seen that it is
only worth 0.87, while for cooling towers with fillers
with an obstacle ratio of 0.31 it produces a value of
2.33, this is due to the contact of hot fluid and cold
fluid in the installed filler so that the energy transfer
that occurs between 2 fluids is increasing.
Figure 7: Graph of Efficiency of obstacle ratio variation.
From fig.7 is a graph of the cooling efficiency of
the tower. The cooling efficiency of the tower without
filler only resulted in 29.53% and the efficiency of the
cooling tower filled with a filler ratio of 0.31 resulted
in an efficiency of 54.48%. This is caused by the
exhaustion of the inlet temperature and outlet
temperature of the cooling tower.
Figure 8: Graph of Evaporation loss of obstacle ratio
variation.
Figure 8 is a graph of evaporation loss from
cooling towers. Evaporation loss is a condition where
the evaporation loss (fluid volume) at a temperature
change (°C) in a unit of time. Evaporation loss usually
describes the efficiency of cooling towers and the
heat of equipment. As seen on fig 8. The evaporation
loss value in the cooling tower without filler is 5.0064
(mL°C/min) and the nilia evaporation loss in the
cooling tower with a filler ratio of 0.31 which is
8.5174 (mL°C/min) there is an increase caused by the
contact between the hot fluid and the cold fluid more
and more due to the filler.
0,873
2,327
0
1
1
2
2
3
NoFiller 0
NTU
OBSTACLERATIOVARIATION
NTU
29,53
54,48
0
10
20
30
40
50
60
NoFiller 0,31
EFFICIENCY(%)
OBSTACLERATIOVARIATION
EFFICIENCY
5,0064
8,5174
0
2
4
6
8
10
NoFiller 0,31
evaporationloss(mL.C/min)
OBSTACLERATIOVARIATION
EVAPORATIONLOSS
Study Experimental of Cooling Tower Forced Draft With Variation of Ratio Obstacle in Film Filler
29

Figure 9: Graph of the NTU of Effectiveness.
Figure.9 shows a graph of the value of the NTU
cooling tower against the value of the effectiveness of
the cooling tower. The NTU value is directly
proportional to the effectiveness value, because the
higher the heat transfer value or energy transfer in a
cooling tower, the higher the effectiveness value of
the cooling tower. It can be seen here that with the
influence of the addition of fillers (variations in
obstacle ratio) the effectiveness value increases. At
the time of cooling tower without filler, it was seen in
fig.9 NTU was valued at 0.87 with an effectiveness of
0.47, while when the cooling tower was filled with
filler with an obstacle ratio of 0.31 NTU was worth
2.43 and the effectiveness value was 0.71. Therefore,
fillers in cooling towers are very important for their
role to improve the performance in cooling towers.
5 CONCLUSION
Based on the results of experiments and data
processing on each variation in the obstacle ratio, it
can be concluded that:
1. Filler ( obstacle ratio ) in the cooling tower
is a very important influence, because it can improve
the performance of the cooling tower.
2. The effectiveness and efficiency of the
cooling tower can be seen from the range and
approach values.
3. The addition of filler ( obstacle ratio )
affects the efficiency and effectiveness of cooling
tower which have increased with successive values :
54.48 % and 0.71 values.
4. The higher the NTU value of the cooling
tower, the highger the value of uts effectiveness.
REFERENCES
ghani saitra, A., hesty sholihah, F., & nabilah fauziyah, I.
(2016). karakteristik menara pendingin tipe induced
draft dengan bahan isian kain flanel. Seminar Nasional
Sains Dan Teknologi Terapan IV 2016.
H, A. T., S, D. L., & Sutjahjono, H. (2014). ANALISIS
BEBAN KALOR COOLING TOWER INDUCED
DRAFT COUNTERFLOW DENGAN BAHAN
PENGISI BAMBU WULUNG ( Heat Load Analysis Of
Induced Draft Counterflow Cooling Tower With
Bamboo Filler Wulung ) Abstrak Pendahuluan Metode
Penelitian.
Jaber, H., & Webb, R. L. (1989). Design of cooling towers
by the effectiveness-NTU method. Journal of Heat
Transfer, 111(4), 837–843.
https://doi.org/10.1115/1.3250794
Mirabdolah Lavasani, A., Namdar Baboli, Z.,
Zamanizadeh, M., & Zareh, M. (2014). Experimental
study on the thermal performance of mechanical
cooling tower with rotational splash type packing.
Energy Conversion and Management, 87, 530–538.
https://doi.org/10.1016/j.enconman.2014.07.036
Mugisidi, D., Heriyani, O., Gunawan, P. H., & Apriani, D.
(2021). Performance improvement of a forced draught
cooling tower using a vortex generator. CFD Letters,
13(1), 45–57. https://doi.org/10.37934/cfdl.13.1.4557
Novianarenti, E., Setyono, G., & Safitra, A. G. (2019).
Experimental Study of the Performance Characteristic
an Induced Draft Cooling Tower with Variates Fillings.
IOP Conference Series: Materials Science and
Engineering, 462(1). https://doi.org/10.1088/1757-
899X/462/1/012027
Novianarenti, Eky, & Setyono, G. (2019). Peningkatan
Performansi Cooling Tower Tipe Induced Draft
Counter Flow Menggunakan Variasi Bentuk Filler.
R.E.M (Rekayasa Energi Manufaktur) Jurnal, 4(1).
https://doi.org/10.21070/r.e.m.v4i1.1766
Pita, M., & Sob, P. B. (2020). Experimental study on the
performance of a vertical plate packing cooling tower
at various air flow rates. Proceedings of 2020 IEEE
11th International Conference on Mechanical and
Intelligent Manufacturing Technologies, ICMIMT
2020, 22–26.
https://doi.org/10.1109/ICMIMT49010.2020.9041232
Ramkrishnan, R., & Arumugam, R. (2013). Experimental
study of cooling tower performance using ceramic tile
packing. Processing and Application of Ceramics, 7(1),
21–27. https://doi.org/10.2298/pac1301021r
Singh, K., & Das, R. (2016). An experimental and multi-
objective optimization study of a forced draft cooling
tower with different fills. Energy Conversion and
Management, 111, 417–430.
https://doi.org/10.1016/j.enconman.2015.12.080
Tower, S. C. (n.d.). 7. cooling tower.
0,87
2,43
0,00
1,00
2,00
3,00
0,00 0,50 1,00
NTU
EFFECTIVENESS
NTU - EFFECTIVENESS
NoFiller
0,31
iCAST-ES 2022 - International Conference on Applied Science and Technology on Engineering Science
30
