
Characteristics of PHCs, District's Population, GRDP per Capita, and
Covid-19 Booster Vaccination Coverage in Indonesia: Negative Binomial
Regression Model
Asep Hermawan
Research Center for Public Health and Nutrition, National Research and Innovation Agency, Gedung Kusnoto,
Jl. Ir. H. Juanda No.18, RT.04/RW.08, Paledang, Kota Bogor, Indonesia
Keywords: Covid-19 Booster Vaccination, Characteristics of PHCs, District's Population, GRDP per Capita.
Abstract: Public Health Center (PHC) is one of the health facilities designated to provide Covid-19 vaccination services
and has an essential role in the success of the Covid-19 booster. This article explores the relationship between
characteristics of PHC, population, Gross Regional Domestic Product (GRDP) per capita) and the Covid-19
booster vaccination coverage. This article used secondary data from the Ministry of Health (MoH) dashboard,
2019 Health Facilities Research data. The observation unit was a district/city has started organizing a Covid-
19 booster vaccination, and all PHC were enumerated, as many as 512 regencies/cities. The model used to
determine the factors affecting coverage of the Covid-19 booster vaccination is a negative binomial regression
model since the dependent variable was not Poisson distributed. The result showed that the number of doctors,
midwives, and nurses in PHCs, the proportion 24 hours electricity PHCs by district/city, remote PHCs, PHCs
had a cold chain, the number of residents, and GRDP per capita had a significant effect on coverage of the
Covid 19 booster vaccination. Improvement in the human health workforce, 24- hour electricity, cold chain
availability, accessibility to PHCs, and the villages are essential factors in increased coverage.
1 INTRODUCTION
On December 31st, 2019, Wuhan, China, received the
first report of the 2019 coronavirus disease (COVID-
19) outbreak. The World Health Organization (WHO)
declared this outbreak a pandemic on March 11th,
2020, following the disease's global spread and the
death of over 3,000 people (World Health
Organization, 2020). One month later, in April 2020,
the Indonesian government declared the COVID-19
pandemic a national disaster after receiving reports
from all provinces confirming the presence of
COVID-19 on their territory (Presiden RI, 2020).
As of July 8th, 2022, there were 551,226,298
confirmed cases of COVID-19 worldwide, with
6,345,595 deaths. There were 6,106,024 approved
COVID 19 in Indonesia, with 156,781 deaths (World
Health Organization, 2022). The Indonesian
government is taking massive anti-epidemic
measures to provide comprehensive public health
protection to prevent the spread of Covid 19. These
efforts include public awareness, security, and mass
vaccination against COVID-19 (Kementerian
Kesehatan RI, 2021).
The mass vaccination campaign in Indonesia
began on January 12th, 2021, one day after the
President of Indonesia and several high-ranking
Indonesian officials received the Sinovac vaccine for
the first time as a symbol of the campaign's start
(Andrianto and Manafe, 2021). The success of
COVID-19 Vaccination can be measured by the
proportion of the population that must be vaccinated
to prevent the spread of infectious diseases. This can
be calculated using the initial reproductive rate (R0),
an epidemic statistic used to explain the transmission
of contagious diseases (Anderson and May, 1985,
Metcalf et al., 2015, Smith, 2019). According to
WHO and the Indonesian Technical Advisory Group
on Immunization (ITAGI), herd immunity can be
formed with a minimum vaccination target of 70%
(Kementerian Kesehatan RI, 2021). Until June 26th,
2022, the first dose of COVID 19 vaccination was
given to 201,229,048 people (92.24%), the second
dose to 168,718,027 people (74.40%), and a booster
to 50,282,986 people (20.06%) (Kementerian
Kesehatan RI, 2022).
On January 12th, 2022, the Advanced Dose of
Hermawan, A.
Characteristics of PHCs, District’s Population, GRDP per Capita, and Covid-19 Booster Vaccination Coverage in Indonesia: Negative Binomial Regression Model.
DOI: 10.5220/0011643200003608
In Proceedings of the 4th International Conference on Social Determinants of Health (ICSDH 2022), pages 167-173
ISBN: 978-989-758-621-7; ISSN: 2975-8297
Copyright
c
2023 by SCITEPRESS – Science and Technology Publications, Lda. Under CC license (CC BY-NC-ND 4.0)
167

CQVID-19 Vaccination (booster) began. The
COVID-19 booster vaccination is administered after
a person has received a total primary vaccination dose
to maintain immunity and extend the protection
period. The COVID-19 Vaccination Booster is
provided free of charge by the government to people
aged 18 and up, with priority given to the elderly and
immunocompromised patients. The elderly booster
vaccination target can be implemented
simultaneously in all districts/cities. In contrast, the
non-elderly target is implemented in districts/cities
with dose one coverage of at least 70% and quantity
one coverage for the elderly of at least 60%
(Direktorat Jenderal Pencegahan dan Pengendalian
Penyakit, 2022).
The Public Health Center (PHC) is one of the
healthcare facilities designated to administer the
COVID-19 booster vaccine. The large number of
PHCs spread across all sub-districts in Indonesia
represents a potential health facility for achieving
high booster coverage. In Indonesia, no studies on
PHC and population characteristics have been
conducted. The research hoped to strengthen policies
for implementing the COVID-19 booster vaccination.
2 METHOD
2.1 Data Source
This study used secondary data, which came from
several data sources, including the 2019 health
facility research data (Rifaskes) PHCs module, which
provides data on the characteristics of PHCs. The
information is taken from the Health Development
Policy Agency, MoH (BKPK), which may be
accessed by following specified guidelines at
www.litbang.kemkes.go.id. Rifaskes 2019 is a
national-scale study on health facilities, specifically
PHCs, hospitals, clinics, and the practice of
doctors/midwives. Data collection for Rifaskes 2019
PHCs takes place between June 1st and July 31st,
2019, depending on the number of PHCs in each
district/city throughout Indonesia. Data on the
projected population per district/city in 2019 and
GRDP per capita in 2020 are from Statistics
Indonesia, and booster vaccination data are from the
Ministry of Health's dashboard data on COVID-19
vaccination coverage (Kementerian Kesehatan RI,
2022). The analysis unit consists of 512
districts/cities, and two districts are excluded from the
analysis because of a lack of data.
2.2 Variable
The number of people who have received booster
vaccines by districts/cities until June 26th, 2022, is
the dependent variable in this study (Y). This
information was from the Covid 19 vaccination
coverage dashboard maintained by the Ministry of
Health (Kementerian Kesehatan RI, 2022). The
independent variables are the Number of PHCs by
district/city (X1), the number of doctors, midwives,
and nurses in PHCs by district/city (X2), and the
proportion of PHCs with a travel time of more than 3
hours from PHCs to the remotest villages by
district/city (X3). The following variables are the
proportion of PHCs with 24-hour electricity by
district/city (X4), the proportion of remote PHCs by
district/city (X5), and the proportion of PHCs with
cold chains by district/city (X6). The availability of
refrigerators (freezers open top or side/refrigerator),
refrigerator thermometers, cold boxes/vaccine
carriers/flasks, water pack/ cool pack and vaccine
temperature monitoring thermometer, and 24-hour
availability of electricity from a power source were
indicators of PHCs readiness in maintaining the cold
chain. To calculate X1 to X6 used Rifaskes 2019 data.
The number of population by district/city (X7) is
information on the number of population of
districts/cities obtained from a Statistics Indonesia
report book on population projections in 2019 based
on the Inter-Census Survey (SUPAS) organized by
Statistics Indonesia (Badan Pusat Statistik et al.,
2018). The 2020 GRDP per capita (x1000) (X8) is the
average income of the Indonesian population
calculated from the quotient of GRDP and people in
regencies/cities in 2020, as also published by
Statistics Indonesia (Badan Pusat Statistik RI, 2021).
2.3 Data Analysis
The data were descriptively analyzed to obtain mean,
minimum, maximum, median, and standard deviation
values to describe dependent and independent
variables. Data were analyzed using a Generalized
Linear Models (GLMs) (Greene, 1994).
GLMs are a
general form of the Linear Model. In the classical
linear model, Y is assumed to be normally
distributed. In GLM, the Y response variable can
be distributed other than normal but is included in
the exponential family (Exponential Terms)
(Myers and Montgomery, 1997).
The
equisdispersion assumption, which states that the
mean value and variance value are equal, is applied in
Poisson Regression. However, the equisdispersion
postulate is not always met in the real world.
ICSDH 2022 - The International Conference on Social Determinants of Health
168
Overdispersion occurs when the variance value is
higher than the average value. Overdispersion in
Poisson regression causes the regression parameter
conjecture biased because the standard error's value is
underestimated. Negative binomial regression is a
method for dealing with overdispersion in Poisson
regression (Hilbe, 2011, Greene, 1994). There are
stages in the GLMs test. The first identified the
distribution and then examined correlations between
predictor variables in linear regression models, also
known as multicollinearity, using the Variance
Inflation Factor (VIF). We excluded a variable that
variable had a VIF value greater than ten. The last
stage was running GLMs, a negative binomial test
with family(log) link (log).Results and discussion
2.4 Descriptive Statistics
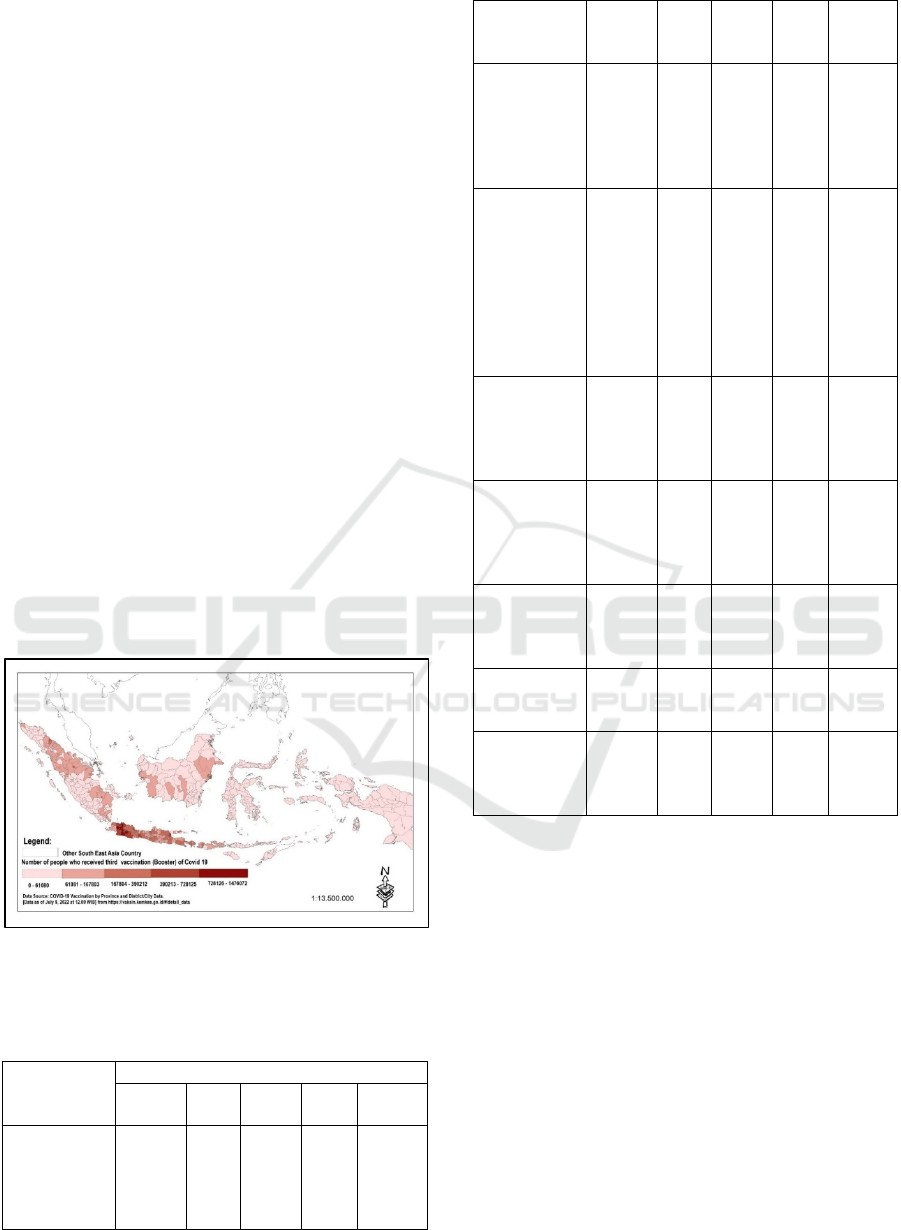
Compared to other locations, the number of persons
vaccinated with boosters seems to be the highest in
Java and Bali. The population of Papua, Maluku,
Nusa Tenggara and Sulawesi is still below 61080.
However, certain regencies/cities in Kalimantan and
Sumatra seem to be doing better. It resulted in a lower
population density than in the Java and Bali areas
(Figure 1). One of the reasons for low vaccination
coverage in some locations is insufficient access to
PHC services.
Figure 1: The number of people who have received booster
vaccines.
Table 1: The statistical description of dependent and
independent variables.
Variable
Statistic Descriptive
Mean
Mini
mu
m
Maxi
mu
m
Media
n
SD
The number
of people has
received
booster
vaccines
98399,4
1
21 14760
72
39824 167195,
10
X1 The
Number of
PHCs
19,20 3 101 17 11,86
X2 The
number of
doctors,
midwives,
and nurses in
PHCs
571,71 40 2177 475 367,13
X3 The
proportion of
PHCs with a
travel time of
more than 3
hours from
PHCs to the
remotest
villages
7,99 0 100 0 14,40
X4 The
proportion of
PHCs with
24-hour
electricit
y
87,08 0 100 97 21,80
X5 The
proportion of
remote PHCs
by
district/cit
y
23,67 0 100 11 28,86
X6 The
proportion of
PHCs with
cold chains
68,70 0 100 75 24,08
X7 The
number of
p
o
p
ulation
52164
8,90
138
79
5965
410
276
597
64783
6,40
X8 The 2020
GRDP per
capita
(x1000)
54538
,93
685
1
7537
10
387
07
62366
,84
Table 1 reveals that, out of 512 regencies/cities,
the average number of persons who have gotten the
Covid 19 booster vaccination is 98399.41, with a
minimum of 21 people and a high of 1476072, with a
standard deviation of 167195.1. The Number of PHCs
varies greatly, ranging from 3-101 PHCs with a
median of 17 PHCs with a median number of
physicians, nurses, and midwives (health
professionals) PHCs in districts/cities with as many
as 475 people, ranging from 40-2175 people.
The proportion of PHCs with travel time from
PHCs to the remotest village of more than 3 hours,
PHCs with 24-hour electricity, remote PHCs, and the
proportion of PHCs with cold chain availability from
storage until the vaccination spot ranges from 0 to 100
percent. The median percentage of PHCs with travel
duration from PHCs to the remotest village of more
than 3 hours (0 %) and the proportion of remote PHCs
Characteristics of PHCs, District’s Population, GRDP per Capita, and Covid-19 Booster Vaccination Coverage in Indonesia: Negative
Binomial Regression Model
169
(11 %) indicate that access to the community is
limited in the coverage of the Covid 19 immunization.
The median percentage of health facilities with 24-
hour electricity availability (97%) and good cold
chain availability (75 %) is, on the other hand,
relatively high. Similarly, the range of population
(13879-5965410) and GRDP per capita (6851-
753710) is reasonably comprehensive, with a
significant standard deviation. So, the data look varies
greatly
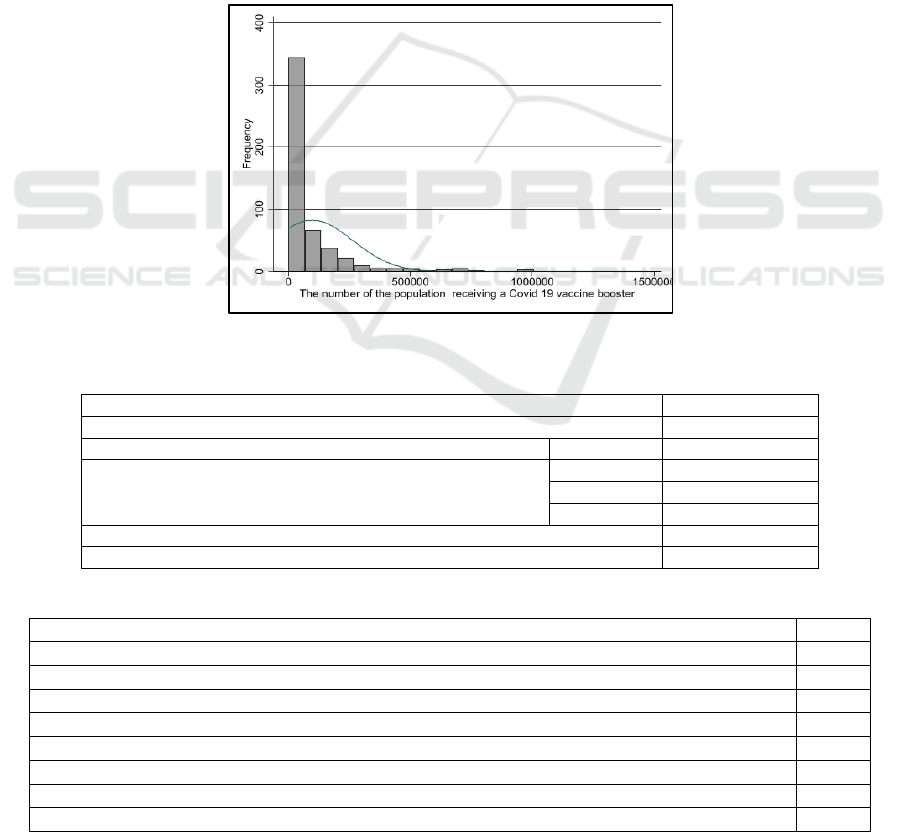
2.5 Identification of Distribution
First, identify the distribution of the Y response
variable using the histogram. Based on figure 2, the
distribution of the Y response variable is not a bell-
shaped curve (normally distributed) but right-skewed.
Count data numbers identified as having a Poisson
distribution (Maxwell et al., 2018). Identifying
whether or not the bound variables follow the Poisson
distribution is necessary. This distribution test used
the Kolmogorov-Smirnov Test with a significance
threshold of 0.05. The test findings indicated that the
data for the Y variable was not Poisson distributed (P
value < 0.005) (Table 2). Hence a negative binomial
regression model was used for the GLM test.
2.6 Multicollinearity Test
Multicollinearity appears when two or more
independent variables in the regression model are
correlated. A little multicollinearity can occasionally
result in significant issues, but when it is moderate to
high, it becomes a problem that needs to be addressed
(Daoud, 2017). We use the variance of inflation factor
(VIF) to identify multicollinearity. We omitted the
Figure 2: Histogram of Y variable.
Table 2: Kolmogorov Smirnov test.
The number of the
p
o
p
ulation receivin
g
a Covid 19 vaccine booster Result test
N 511
Poisson Paramete
r
Mean 98399,41
Most Extreme Differences
Absolute 0,742
Positive 0,742
Ne
g
ative -0,254
Kolmo
g
orov-Smirnov Z 16,766
Nilai P 0,000
Table 3. Multicollinearity Test.
Variable VIF
X1 The number of PHCs
4,96
X2 The number of doctors, midwives, and nurses in PHCs
4,29
X3 The proportion of PHCs with a travel time of more than 3 hours from PHCs to the remotest villages
3,81
X4 The proportion of PHCs with 24-hour electricity
3,77
X5 The proportion of remote PHCs by district/city
2,46
X6 The proportion of PHCs with cold chains
1,92
X7 The Number of Population
1,78
X8 The 2020 GRDP per capita (x1000) 1,03
ICSDH 2022 - The International Conference on Social Determinants of Health
170

Table 4: Modelling using negative binomial regression predicts factors affecting the population receiving a Covid-19 booster
vaccine.
Variable Coef (95% CI)
Standard
error
Pr (>|z|)
X1 The number of PHCs 1x10
-3
0,009 0,894
X2 The number of doctors, midwives, and nurses in PHCs 4.8x10
-4
0,000 0,019
X3 The proportion of PHCs with a travel time of more than 3 hours from PHCs
to the remotest villages
-7x10
-3
0,004 0,097
X4 The proportion of PHCs with 24-hour electricity 8x10
-3
0,004 0,049
X5 The proportion of remote PHCs by district/city -6x10
-3
0,002 0,010
X6 The proportion of PHCs with cold chains 1,2x10
-2
0,004 0,001
X7 The Number of Population 1x10
-6
0,000 0,000
X8 The 2020 GRDP per capita (x1000) 3x10
-6
0,000 0,000
Constant 8,39 0,329 0,000
variable if the variable exhibits multicollinearity (VIF
> 10). Table 3 demonstrates that all independent
variables have a VIF value of 10, indicating no
multicollinearity in all variables. So, we included all
variables in the ensuing study.
2.7 Generalized Linear Model (GLM)
GLM modelling will use a negative binomial
distribution with a link function (log). The results
demonstrated that the number of doctors, nurses, and
midwives in PHCs, the proportion of PHCs with 24-
hour electricity, remote PHCs, and PHCs with cold
chain availability, as well as the population and
GRDP per capita (x1000), had a significant impact on
the coverage of the Covid 19 booster vaccination
(Table 4).
The number of doctors, nurses, and midwives at
the PHCs, the proportion of PHCs with 24-hour
electricity, the Number of PHCs with a cold chain, the
district population, and the GRDP per capita (x1000)
have a positive impact. It indicates that the coverage
of the Covid 19 booster vaccine increases as the
number or fraction of variables increases. On the
other hand, the proportion of remote PHCs and the
fraction of PHCs with more than a three-hour travel
time to the most distant villages had a negative effect
on vaccination coverage for Covid 19 boosters. The
higher the proportion, the lower the vaccine coverage.
The GLMs Model for Negative Binomial
Regression distribution summarized:
μ = Exp (8.39 x10
0
+ 4.8x10
-4
X
2
+ 8x10
-3
X
4
−
6x10
-3
X5
+1,2x10
-2
X
6
+ 1x10
-6
X
7
+3x10
-6
X
8
)
The study found that the number of doctors,
nurses, and midwives at the PHCs positively impacts
COVID-19 booster vaccination. This finding was still
consistent with previous studies. The number or
density of health workers affects the health indicators
outcome such as life expectancy (Nguyen et al.,
2016), immunization coverage (Mitchell et al., 2008),
neonatal mortality (Sousa et al., 2013) and skilled
birth attendant (Mayhew et al., 2008). Health workers
are an integral part of the health system and play an
essential role in achieving effective healthcare
delivery. Health workers with adequate quantity and
quality are essential because they directly affect the
quality of health services (World Health
Organisation, 2013, Ghosh, 2014).
The cold chain is used to keep vaccinations in
potent condition during storage. It is also known as
the supply chain for vaccinations or the immunization
supply chain. From the point of manufacture to the
point of administration, the cold chain comprises
several linkages intended to keep vaccines within the
temperatures specified by the WHO (2-8
o
C). Health
facility freezers may be powered by electricity, solar
energy, or gas to remain at the recommended
temperature. A refrigerator for a medical facility
should be chosen based on the most dependable
power source (World Health Organization
Department of Immunization, 2015). So, it was
important that the availability of a cold chain and
electricity as a power source in delivery services for
COVID-19 booster vaccination.
The proportion of remote PHCs by district/city
and PHCs with a travel time of more than 3 hours
from PHCs to the remotest villages negatively
impacts Covid-19 booster vaccination. Both are
indicators of access to transport the Covid-19 vaccine
booster and to deliver the vaccine to the receivers.
Access will make it difficult for officials to provide
covid 19 vaccine boosters. This result remains
consistent with earlier research, which showed that
accessing PHCs is a major obstacle to ensuring
immunization services.(Ayeni et al., 1987, Al-Taiar
et al., 2010, Hierink et al., 2021, Nainggolan et al.,
2016). GRDP per capita is one of the indicators of
Characteristics of PHCs, District’s Population, GRDP per Capita, and Covid-19 Booster Vaccination Coverage in Indonesia: Negative
Binomial Regression Model
171

the success of development implementation that can
be used as a macro benchmark is economic growth
(Romhadhoni et al., 2019). GRDP at the prevailing
price describes the added value of goods and services
calculated using the price per current year, while
GRDP based on constant prices shows the added
value of goods and services calculated using the
prevailing price in one year as the base year (Badan
Pusat Statistik RI, 2021). This study found that GRDP
per capita affects Covid-19 booster vaccination
success in districts/cities in Indonesia.
3 CONCLUSION
The study reveals that Java and Bali are regions with
the highest number of people who have received
Covid 19 booster vaccines. The number of doctors,
nurses, and midwives at the PHCs, the proportion of
PHCs with 24-hour electricity, the proportion of
PHCs with a cold chain, the district population, and
the GRDP per capita (x1000) have a positive impact.
On the other hand, the proportion of remote PHCs and
the fraction of PHCs with more than a three-hour
travel time to the most distant villages had a negative
effect on vaccination coverage for Covid 19 boosters.
Improvement in the human health workforce, 24-
hour electricity, cold chain availability, accessibility
to PHCs, and the villages are essential factors in
increased coverage
ACKNOWLEDGEMENTS
We would like to thank the Head of NIHRD MoH for
allowing the author to analyze the 2019 Health
Facility Research (Rifaskes) data. We also would like
to thank Drs. Max Joseph Herman Apt., M.Kes for
guiding me in writing this article
REFERENCES
Al-Taiar, A., Clark, A., Longenecker, J. C. & Whitty, C.
2010. Physical accessibility and utilization of health
services in Yemen. International journal of health
geographics, 9, 1-8.
Anderson, R. M. & May, R. M. 1985. Vaccination and herd
immunity to infectious diseases. Nature, 318, 323-329.
Andrianto, H. & Manafe, D. 2021. Mass Vaccination
Begins in Indonesia as Coronavirus Cases, Deaths
Reach New High. [Online]. Jakarta: JAKARTA
GLOBE. Available: https://jakartaglobe.id/news/mass-
vaccination-begins-in-indonesia-as-coronavirus-cases-
deaths-reach-new-high/ [Accessed 14 Januari 2021].
Ayeni, B., Rushton, G. & McNulty, M. 1987. Improving the
geographical accessibility of health care in rural areas:
A Nigerian case study. Social science & medicine, 25,
1083-1094.
Badan Pusat Statistik, Kementerian PPN/Bapennas &
UNFPA 2018. Proyeksi Penduduk Indonesia 2015-
2045 Hasil SUPAS 2015 (Indonesia Population
Projection 2015-2045 result of SUPAS 2015), Jakarta,
BPS RI.
Badan Pusat Statistik RI 2021. Produk Domestik Regionel
Bruto per Kabupaten/Kota di Indonesia 2016-2020
(Gross Domestic Regional Product of Regencies and
Municipalities 2016-2020), Jakarta, Badan Pusat
Statistik RI (Statistics Indonesia).
Daoud, J. I. Multicollinearity and regression analysis. IOP
Conf. Series: Journal of Physics, 2017 2017. IOP
Publishing, 012009.
Direktorat Jenderal Pencegahan dan Pengendalian Penyakit
2022. Surat Edaran Nomor: HK.02.02/II/252/2022
Tentang Vaksinasi Covid-19 Dosis Lanjutan (Booster).
Jakarta: Direktorat Jenderal Pencegahan dan
Pengendalian Penyakit Kementerian Kesehatan RI.
Ghosh, S. 2014. Equity in the utilization of healthcare
services in India: evidence from National Sample
Survey. International journal of health policy and
management, 2, 29.
Greene, W. H. 1994. Accounting for excess zeros and
sample selection in Poisson and negative binomial
regression models.
Hierink, F., Okiro, E. A., Flahault, A. & Ray, N. 2021. The
winding road to health: A systematic scoping review on
the effect of geographical accessibility to health care on
infectious diseases in low-and middle-income
countries. Plos one, 16, e0244921.
Hilbe, J. M. 2011. Negative binomial regression,
Cambridge University Press.
Kementerian Kesehatan RI 2021. Keputusan Menteri
Kesehatan Republik Indonesia Nomor
HK.01.07/Menkes/4638/2021, Tentang Petunjuk
Teknis Pelaksanaan Vaksinasi dalam Rangka
Penanggulangan Pandemi Corona Virus Disease 2019
(Covid-19). Jakarta: Kementerian Kesehatan RI,.
Kementerian Kesehatan RI 2022. Vaksinasi COVID-19
Nasional [Data per Tanggal 26 Juni 2022 Pukul 18.00
WIB]. 26 Juni 2022 ed. Jakarta: Kementerian
Kesehatan RI.
Maxwell, O., Mayowa, B. A., Chinedu, I. U. & Peace, A.
E. 2018. Modelling count data; a generalized linear
model framework. Am J Math Stat, 8, 179-183.
Mayhew, M., Hansen, P. M., Peters, D. H., Edward, A.,
Singh, L. P., Dwivedi, V., Mashkoor, A. & Burnham,
G. 2008. Determinants of skilled birth attendant
utilization in Afghanistan: a cross-sectional study.
American journal of public health, 98, 1849-1856.
Metcalf, C. J. E., Ferrari, M., Graham, A. L. & Grenfell, B.
T. 2015. Understanding herd immunity. Trends in
immunology, 36, 753-755.
ICSDH 2022 - The International Conference on Social Determinants of Health
172

Mitchell, A. D., Bossert, T. J., Yip, W. & Mollahaliloglu,
S. 2008. Health worker densities and immunization
coverage in Turkey: a panel data analysis. Human
Resources for Health, 6, 29.
Myers, R. H. & Montgomery, D. C. J. J. o. Q. T. 1997. A
tutorial on generalized linear models. 29, 274-291.
Nainggolan, O., Hapsari, D. & Indrawati, L. 2016.
Pengaruh akses ke fasilitas kesehatan terhadap
kelengkapan imunisasi baduta (analisis riskesdas
2013). Media Penelitian dan Pengembangan
Kesehatan, 26, 15-28.
Nguyen, M. P., Mirzoev, T. & Le, T. M. 2016. Contribution
of health workforce to health outcomes: empirical
evidence from Vietnam. Human Resources for Health,
14, 68.
Presiden RI 2020. Keputusan Presiden Republik Indonesia
Nomor 12 Tahun 2020 Tentang Penetapan Bencana
Non alam Penyebaran Corona Virus Disease 2019
(Covid -19) Sebagai Bencana Nasional. Jakarta:
Kementerian Sekretariat Negara RI.
Romhadhoni, P., Faizah, D. Z. & Afifah, N. 2019. Pengaruh
Produk Domestik Regional Bruto (PDRB) Daerah
terhadap Pertumbuhan Ekonomi dan Tingkat
Pengangguran Terbuka di Provinsi DKI Jakarta. Jurnal
Matematika Integratif, 14, 113.
Smith, D. R. 2019. Herd immunity. Veterinary Clinics:
Food Animal Practice, 35, 593-604.
Sousa, A., Dal Poz, M. R. & Boschi-Pinto, C. 2013.
Reducing inequities in neonatal mortality through
adequate supply of health workers: evidence from
newborn health in Brazil. PLoS One, 8, e74772.
World Health Organisation 2013. A Universal Truth: No
health without a workforce. World Health Organisation
(WHO) Report, 1-104.
World Health Organization. 2020. Coronavirus disease
(COVID-19) outbreak; 2020 Available:
https://www.who.int/emergencies/diseases/novel-
coronavirus-2019 [Accessed August 31, 2020].
World Health Organization 2022. WHO Coronavirus
(COVID-19) Dashboard. July 8th, 2022 ed.
World Health Organization Department of Immunization
2015. Immunization in practice: a practical guide for
health staff, World Health Organization.
Characteristics of PHCs, District’s Population, GRDP per Capita, and Covid-19 Booster Vaccination Coverage in Indonesia: Negative
Binomial Regression Model
173
