
Intelligent Decision Support System for Precision Medicine:
Time Series Multi-variable Approach for Data Processing
Nasim Sadat Mosavi
a
and Manuel Filipe Santos
b
Algoritmi Research Centre, University of Minho, Guimaraes, Portugal
Keywords: Intelligent Decision Support, Precision Medicine, Optimization, Data Processing, Intensive Care Unit.
Abstract: This study has introduced a new approach to clinical data processing. Clinical data is unstructured,
heterogeneous, and comes from various resources. Although, the challenges associated with processing such
data have been discussed widely in literature, addressing those aspects is fragmented and case-based. This
paper presents the initial outcome of applying the Time series Multi-Variables model (TsMV) to 12 different
datasets from Intensive Care Units (ICU), medications, and laboratories. TsMV supports the development of
an Intelligent Decision Support System for PM (IDSS4PM) by preparing effective data. Moreover, the
CRISP-DM methodology was employed, and based on the proposed solution, we have adjusted the significant
steps to CRISP-DM, where those extra phases are essential for taking future works.
1 INTRODUCTION
While, growing the aging population,
consumerism, increasing the availability of patient
data and limited human-cognitive for timely
decision-making, in addition to the economic
pressure have challenged the old model of clinical
decision-making, big data, and analytics have
provided the opportunity for developing Precision
Medicine (PM). Although there is various
definition of PM,
the US National Library of
Medicine, referred it to as “an as emerging approach
for disease treatment and prevention that takes into
account individual variability in genes, environment,
and lifestyle for each person” (Hulsen et al.,
2019),(Y. Zhang, Silvers, & Randolph, 2007).
Hence, not only biological factors are taken into
the consideration, but also environmental,
lifestyle, and patient’s condition and preferences
are important for releasing the best possible
treatment (Fenning, Smith, & Calderwood,
2019)
,(Williams et al., 2018).
The advantages of Artificial Intelligence (AI) and
analytics to reduce medical errors and increase the
performance of clinical decision-making are
extensively highlighted in the literature (Jiang et al.,
a
https://orcid.org/0000-0002-6153-2524
b
https://orcid.org/0000-0002-5441-3316
2017). While descriptive, diagnosis and predictive
analytics discover insights from data, prescriptive
analytics focuses on optimal decision-making
(Mosavi & Santos, 2020). Even though such
promising technologies are advanced to extract, and
interpret meaningful information from raw data, there
are major challenges and limitations associated with
data acquisition and processing in the context of the
adoption of PM. Based on that, current studies have
not demonstrated practical and valid frameworks to
address the limitations in processing diverse and
complex data (McPadden et al., 2019). This paper
aims to present TsMV approach for filling the
identified gaps in clinical data processing which is
essential for the development of IDSS4PM.
IDSS4PM is a framework from the concept of
“Decision Support Systems”, where AI and analytics
pioneer the development of PM to propose an optimal
outcome for clinical decision-making.
The Time series Multiple-Variables Approach for
Precision Medicine (TsMVs4PM) is designed to
address the challenges such as infrequent registration
of data, dimensionality, variety, velocity, and
integration aspects.
From a general point of view, the key limitations
and restrictions that have challenged the adoption of
PM are classified into three categories: “Definition of
Mosavi, N. and Santos, M.
Intelligent Decision Support System for Precision Medicine; Time Series Multi-variable Approach for Data Processing.
DOI: 10.5220/0011590600003335
In Proceedings of the 14th International Joint Conference on Knowledge Discovery, Knowledge Engineering and Knowledge Management (IC3K 2022) - Volume 3: KMIS, pages 231-238
ISBN: 978-989-758-614-9; ISSN: 2184-3228
Copyright
c
2022 by SCITEPRESS – Science and Technology Publications, Lda. All rights reserved
231

PM”, “Data source/Data Management” and
“Validity/Reliability of clinical practice”. Although
there are wide contributions to explaining PM, the
terms have evolved and it requires time and practice
to emerge with the best possible performance.
Moreover, issues related to the variety and types of
data that come from diverse resources resulted in
limitations in data integration. Even though there are
defined standards for data exchange, stakeholders and
potential adopters need to cooperate to employ the
available policies (Sadat Mosavi & Filipe Santos,
2021). In addition, dealing with data quality, privacy,
dimensionality, integration, and interoperability have
provided remarkable research opportunities under the
category of “Data Management” (Liu, Luo, Jiang, &
Zhao, 2019). Finally, the shift from the traditional
protocol of clinical decision-making to the new one
needs valid and reliable practices in the area of AI and
Machine Learning (ML). This effort mostly depends
on overcoming the limitations of data sources,
handling big data, and data processing. However,
policies and regulations of data privacy, cost of
project development, multidisciplinary cooperation,
and technology acceptance by the professionals must
be considered to facilitate the fusion of PM (Sadat
Mosavi & Filipe Santos, 2021).
The TsMV method supports the development of
an analytical dashboard to monitor and analyze all the
clinical transactions from the time of admission to
discharge. This solution addresses infrequent data
registration and provides an integrated/unique
platform for the decision maker to analyze the clinical
background. Where It facilitates future works
(clustering prediction and optimization).
Furthermore, since the objective is to maximize
the rationality of clinical decision-making via
adopting analytics, we have employed Simon's model
of decision-making as the theoretical foundation.
Intelligence-Design-choice, introduced by Simon has
been identified as the most common framework in
decision making where the “Intelligence” phase is
about identifying the problem, searching and
collecting relevant information, and “Design” is
associated with generating alternatives and
developing possible courses of action. Furthermore,
evaluating the consequences of each option and
choosing the optimal performance are related in the
“Choice” phase (Mosavi & Santos, 2021).
Simon in “Bounded Rationality” identified that
the decision-maker chooses the first attention which
is good enough without evaluating alternatives, but
the optimum option cannot be the best decision as
there is a difference between decision making and
searching for the best (Barros, 2010),(Gigerenzer,
2001). Following the assumptions to decide
rationally, the decision-maker should know all the
alternatives as well as the consequence of each
alternative. In addition, the decision-maker should be
able to compute with perfect accuracy. Hence,
optimization is one step closer to normative decision-
making. In other words, optimization identifies the
best course of action; maximizing the value between
alternatives(Hertog, 2015),(Delen, 2020).
This paper has employed the CRISP-DM
methodology, so it is organized based on the six
phases of this methodology to present the initial result
in the data processing phase. Therefore, the first
three-phased are explained and the last three are
planned as future work for developing the final
framework of IDSS4PM.
2 CRISPS_DM METHODOLOGY
CRoss-Industry Standard Process for Data Mining
refers to the process of applying intelligent techniques
to data to extract patterns and identify valid and useful
information (S. Zhang, Zhang, & Yang, 2003). It is a
multidisciplinary subject, leveraging various
techniques such as ML, statistics, and data analytics
(Leprince, Miller, & Zeiler, 2021). Whereas Fayyad
considers DM as one of the phases in the Knowledge
Discovery from Database (KDD) process for
searching and discovering patterns(Fayyad &
Uthurusamy, 1996), CRISP-DM guides people to
know how DM can be applied in practice in real
systems (Ipp, Azevedo, & Santos, 2004). This is a
standard methodology used to support translating
business problems or application requirements and
objectives into data mining projects. Regardless of
the type of industry, CRISP-DM helps the
effectiveness of the outcome by extracting knowledge
from the raw data (Pete et al., 2000). This
methodology was introduced in the late 90s for
Knowledge Discovery from Database (KDD) (Grady,
2016) and was developed by the means of the effort
of a consortium initially composed of Daimler-
Chrysler, SPSS, and NCR. The six phases of CRISP-
DM 0.1 include “Business/Application
Understanding”, to identify problems or to define
objectives. This phare requires domain knowledge
and consists of various tasks and reports. “Data
Understanding” includes activities such as data
collection, exploration, and quality verification. The
third phase, “Data Preparation”, includes different
activities to prepare data for modelling. Moreover, in
“Modelling”, the most promising and potential ML
algorithms will be applied. In addition, “Evaluation”,
KMIS 2022 - 14th International Conference on Knowledge Management and Information Systems
232
uses techniques to assess the accuracy of the result,
and finally, in “Deployment”, the most suitable
algorithm will be selected for practical use (Pete et
al., 2000). This paper presents the result of the first
three steps of developing IDSS4PM. This road map is
adjustable to analytics where Simon’s model of
decision-making is taken into consideration.
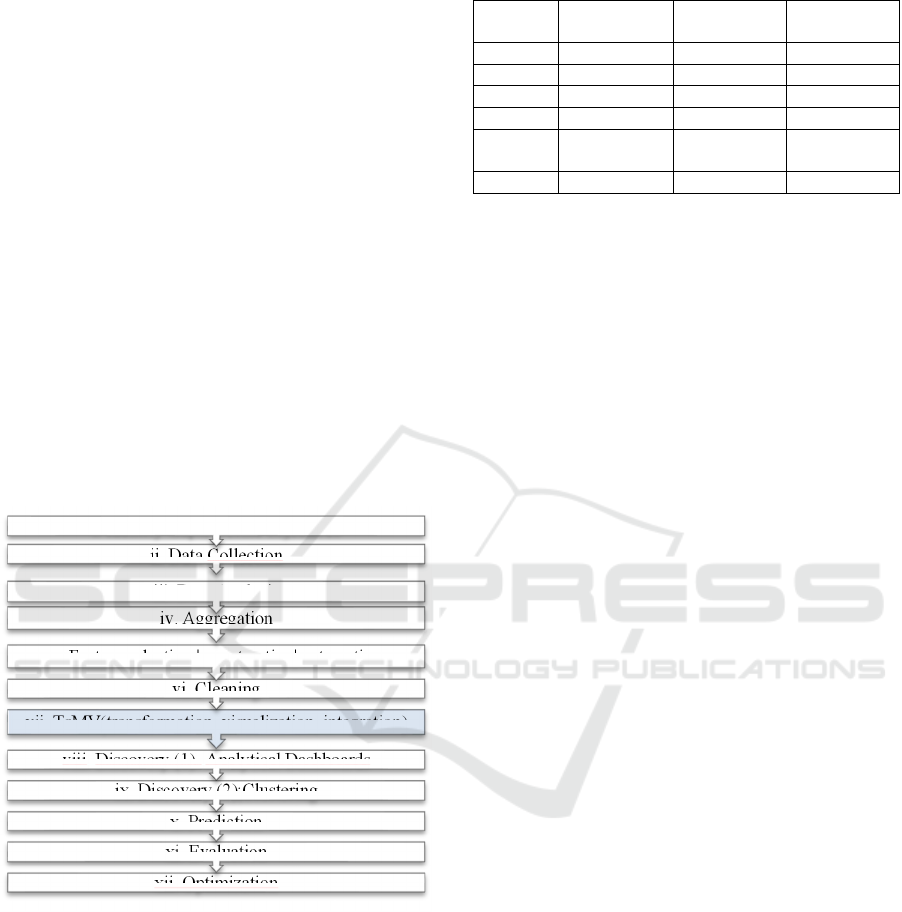
According to table 1, the first step is “Business
Understanding”; identifying scientific gaps and
defining objectives. Moreover, data collection and
analysis are associated with “Data Understanding”. In
addition, major activities are required to prepare
effective data such as data aggregation, feature
engineering, transformation, and cleaning.
Furthermore, TsMV as an integrated approach is
necessary for performing the discovery and
prediction. Accordingly, prediction and evaluation
are associated with “Modelling” and “Evaluation”.
Finally, we have justified “Optimization” as the part
of “Modelling “and “Evaluation” phases for
obtaining the sub-optimal result.
Table 1: Workplan According to CRISP-DM.
As table 2 presents, phases 1,2,3, and 4 which are
informative, are adjustable with the “Intelligence”
phase in Simon’s framework. Moreover, phases 1,2,
and 3 are based on “Descriptive” analytics. phase 4 is
associated with “Design” since in “Modelling” and
“Evaluation”, various algorithms will be generated,
and different scenarios will be analysed and assessed.
Finally, based on objectives and the outcome of the
evaluation, the most potentials and suitable
performance (algorithm) will be selected Hence, this
step is about decision making and performance
selection and it is related to “choice and prescriptive
analytics.
Table 2: Towards optimal clinical decision making.
Tasks CRISP_DM Simon’s
Framewor
k
Analytics
i Phase (1) Intelligence None
i, iii Phase (2) Intelligence Descriptive
iv,v,vi, vii Phase
(
3
)
Intelli
g
ence Descri
p
tive
viii, ix NEW Intelli
g
ence Descri
p
tive
x, xi Phase (4,5) Design,
Intelligence
Predictive
xii Phase
(
4,5,6
)
Choice Prescri
p
tive
2.1 Application| Business
Understanding
2.1.1 Precision Medicine
PM as a new approach in medical decision-making
has been motivated by major opportunities and
challenges such as the failed business model of “one
size fits all” (releasing similar treatments for patients
with similar symptoms) (Barros, 2010) which
resulted in less effective medical performance. In
addition, the cost of overtreatment, less balance
between patient expectations and the quality of
services, the global aging population growth, and an
increasing number of new chronic diseases, need a
supply of advanced scientific and medical
commitment and technologies (C. Kennedy & Turley,
201AD). Besides, the availability of healthcare big
data and advanced technologies such as AI, cloud
computing, the Internet of Things (IoT), and analytics
provide actionable and useful information for
decision-making (Wu et al., 2017). Thus, it is
expected, that by 2050, because of healthcare
digitization under the influence of technological
advancement, using patients’ biological data for
clinical decision-making will pioneer the adoption of
PM (Khadanga, Aggarwal, Joty, & Srivastava, 2019).
This shift from the traditional approach to the new
way of clinical decision-making will effectively
change the quality of treatment, especially for PM
where IoT facilitates customized data collection for
individual patients by considering the influence of
heterogeneous data (Brown, 2016).
2.1.2 Scientific Gaps in Data Processing
Phase
“As ever, where new technology promises “Big
Advances,” significant challenges remain” (Hulsen et
al., 2019).
As it was mentioned above, whereas aspects
related to data processing such as “data source and
management” are identified as the major limitations
xii. Optimization
xi. Evaluation
x. Prediction
ix. Discovery (2);Clustering
viii. Discovery (1)- Analytical Dashboards
vii. TsMV(transformation, visualization, integration)
vi. Cleaning
v. Feature selection ¦ construction| exteraction
iv. Aggregation
iii. Data Analysis
ii. Data Collection
i. Identify Gaps, Define objectives
Intelligent Decision Support System for Precision Medicine; Time Series Multi-variable Approach for Data Processing
233

for standardizing the fusion of the “one-size-fits-all”
model, other problems are related to terminology
itself, and existing clinical practices. Although there
is, a definition of PM released by the U.S national
library of medicine, since literature is heterogeneous
in terms of using the terminology of PM, there has not
been a standard paradigm used to develop a data-
driven DSS to conduct the protocol of PM (Sadat
Mosavi & Filipe Santos, 2021). For example, some
research works have considered genetic profiles as
necessary data for obtaining precise treatment
pathways, and others have defined PM as a process
that needs to be evolved and completed over time.
Therefore, by considering the general purpose of
emerging PM in healthcare which is accepted as a
process to develop the treatment pathway with more
accuracy and transparency based on patient profile,
research works and study designs strongly depend on
the particular research questions (Hulsen et al., 2019).
On the one hand, features (heterogeneous,
diverted, and unstructured) carried by clinical data
have resulted in poor synchronization, particularly in
data acquisition and integration phases (Y. Zhang et
al., 2007). On the other hand, the lack of an integrated
platform for considering multi-variable data
paradigm caused useful data and trend information
not able to be incorporated into a single model for
further decision-making (C. E. Kennedy & Turley,
2011). One considerable reason is the diverse
frequency of data registration from various resources.
In addition, the different time granularity of data
collection can result in ambiguous data correlation(Y.
Zhang et al., 2007). For example, data from bedside
monitoring has generally high frequency while
clinical sampling and lab tests might be taken
irregularly. Therefore, aspects such as frequency and
regulations of data generation strongly influence the
performance of the data processing phase (Wu et al.,
2017). In addition, verification of data quality is a
critical step in data processing. Data quality
considerably depends on major factors such as the
assessment of a patient’s condition by the clinical
team, misinterpretation of the original document,
and mistakes in data entry(Brown, 2016). Also,
Medical Waveforms (MW) such as
electrocardiograms and electroencephalograms,
which are widely utilized in physiological
examination, might caries random noise and
gaps(Khadanga et al., 2019).Therefore, deal with
missing values is another point needs to be addressed
in data cleaning and preparation (Adiba, Sharwardy,
& Rahman, 2021).Finally, the validity and reliability
of existing clinical practices in this area need
maturity, and new policies, regulations, and
cooperation pipelines between stakeholders to speed
up the emergence of PM. In other words, successful
and valid projects in scale affect positively the quality
of performance in general and indirectly best
practices boost problem solving associated with
technical areas such as data processing aspects
(Blasimme, Fadda, Schneider, & Vayena, 2018).
One common situation in digitized healthcare
platforms is where various physiological variables of
patients are continuously monitored and stored
resulting in huge amounts of data collected. Whereas
the integration of data collected at the bedside is
required to study associated with other data generated
during the patient’s involvement with treatment, and
other clinical aspects, outliers, and abnormal data
present bias, and related data must be ignored in
modelling and many cases data has to be filtered from
the study(Seyhan & Carini, 2019). Hence, despite the
promising start of Big Data analysis, manipulation,
and interpretation in clinical research, which has seen
a rising number of peer-reviewed articles, very
limited applications have been used to overcome
those aspects. A close future effort should be done to
validate the knowledge extracted from clinical Big
Data and implement it in clinical practice(Carra,
Salluh, da Silva Ramos, & Meyfroidt, 2020).
Major studies that contributed to offering a
promising framework have focused on time series
data and addressed limitations in data preparation.
One example is the “attention scores” technique for
feature importance in time series clinical data. This
method is complex and applicable for nonlinear
(Johnson, Parbhoo, Ross, & Doshi-Velez, 2021).
Another research works used summaries of patient
time series data for 24-72 hour from ICU to examine
the early prediction of in-hospital mortality. In this
study, static observations and physiological data
including labs and vital signs extracted based on
hourly circumstances. This approach limited the data
to vital signs and lab results and considered data
extraction and integration of time series clinical data
in the context of data aggregation (Johnson et al.,
2021). Another limitation related to data
management, and processing is storage and
computing. Especially for handling data that is
created with high frequency such as physiological
indicators. Although this data is valuable for
analyses, storing and managing such records needs
high computation and storage facilities. The
“Electron” framework is a solution offered to store
and analysed longitudinal physiologic monitoring
data (McPadden et al., 2019). Furthermore, the TDA
approach is an effective way for large-scale datasets
and employs algebraic topology to analysed big data
KMIS 2022 - 14th International Conference on Knowledge Management and Information Systems
234

by reducing the dimension, particularly for geometric
representations to extract patterns and obtain insight
into them. In addition, to deal with data velocity, the
“anytime algorithm “to learn from data streaming has
been introduced as a useful approach for time series
data which copies its growth over time. The
effectiveness of this method depends on the amount
of computation they were able to perform. Moreover,
to deal with heterogeneous data (variety), although
GNMTF is an efficient data integration framework,
subject to the number of data types to be integrated
the competencies complexity increased (Gligorijević,
Malod-Dognin, & Pržulj, 2016)
.
therefore, existing
approaches have offered solutions to manage data
such as time-series and case-based challenges such as
feature importance, feature selection, dimensionally
reduction, and velocity.
2.2 Data Understanding
According to table 2, there are 12 datasets collected
as excel files. The “vital sign” includes 439025
records with 108 features and many of them came
from biological sensors in ICU. Furthermore, “Lab
Result” is a dataset that includes outcomes of
laboratory exams. This table has113320 records with
9 features. “Procedure”, with 911 records, and 6
features consisting of raw data associated with an
action prescribed by the doctors. In addition, “SOAP”
with 2435 records and 8 features, keeps key data
about the SOAP framework (Subject, Object,
Assessment, Plan). Gravity score or “saps” presents
data about the level of gravity where it has 176
records and 6 features. Moreover, “Glasgow” carries
861 records and 6 features. The Glasgow table has
data about the consciousness status of each patient.
The “diagnosis” table with 124 records and 9 features
is about signs, symptoms, and laboratory findings.
While “prescription of medicine” addresses key
information about medications prescribed by the
clinician, “administration of medicine”, with 993496
records and 17 features is associated with drug
administration. The tenth table shows the intervention
data of each patient. Finally, an “admin-discharge”
dataset includes data on admission and discharge
from ICU. In addition, there is a reference dataset that
includes episode/process number exist in eleven
datasets. Those two variables are key to linking
datasets and are patient identifications.
The only dataset including time-series data is a
“vital sign” marked by #. Moreover, tables such as
“vital sign”, “procedure”, “SOAP” and “diagnosis” are
arked by | including time or date of admission. Based
on that, others specified by ||, have both time and date
(admission). In addition, tables marked by * consist of
data from ICU. R means the number of records and F
means the number of features. Also, two features
include distinct values whether “Process Number”
(DP) or “Episode Number” (DE). The “procedures”
and “SOAP” include DP (distinct process number) and
other tables have DE (distinct episode number).
Table 3: Data Collection/Initial Analysis.
2.3 Data Preparation
According to the CRISP_DM methodology, “Data
Preparation” consists of activities to prepare data for
the modelling phase. Since analytical dashboards and
clustering (discovery) require integrated clinical data,
TsMV performs to solve the limitation in the data
processing. Thus, In addition to the initial data
manipulation, TsMV method was applied. In this
case, we have modified the CRISP-DM methodology
by adding TsMV approach in data preparation and an
extra step before modelling which is discovery.
Figure 1: CRISP-DM - Adjusted for IDSS4PM.
Patient Data
# *| vital sign 70DE, 439025R, 108F
|| lab result 69DE,113320R, 9F
*| procedure 63DP,911R, 6F
*| SOAP 70DEP, 2435R,8F
*|| saps 17DE,176R,6F
*|| galgw 49DE, 861R,6F
*| diagnosis 67DE,124R,9F
|| med prescription 70DE,35422R, 39F
|| med administration 70DE, 993496R, 17F
*|| intervention 70DE,18674R, 4F
*admin-discharge -ICU
70DE, R,2F
process-episod number 70DEP,70R, 2F
1.Business
Understanding
2.Data
Understanding
3. Data Preparation
TsMV
4.Discovery
5.Modelling
6.Evaluation
7. Deployment
Intelligent Decision Support System for Precision Medicine; Time Series Multi-variable Approach for Data Processing
235
2.3.1 Data Preparation- TsMV
As it was mentioned above, In addition to the initial
data manipulation (feature engineering, data
cleaning, data extraction, etc.,), specific data
processing works were performed.
To solve the limitation associated with irregular data
acquisition and synchronization, we aggregated
physiological data (vital sign dataset) based on hourly
circumstances. This solution addressed the diverse
frequency of time series data registered by different
sensors. In addition, because data generation from
ICU (monitoring) has a high frequency compared
with other data resources (medications, procedures,
SAP, Glasgow, and intervention), therefore, to deal
with fragmented and infrequent data generation, we
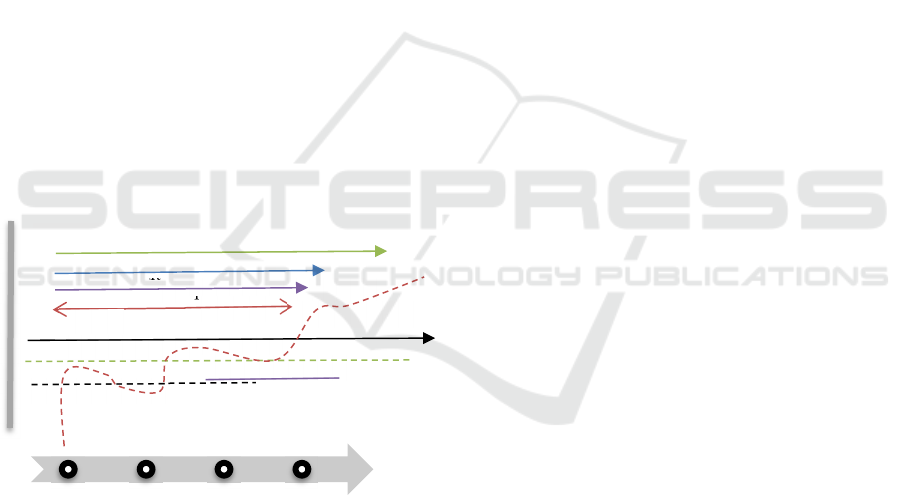
performed a specific data transformation. where data
has been transformed from the time/date dimension
into a sequence dimension we called “Time Slot”
(TS). According to the figure2, each patient has a
Time Slot TS1 to TSn where the TS1 to TS23
includes one day of clinical transactions. In other
words, each (TS+1)-TS= 1 hour Therefore, each
patient with different episode numbers has TS from 1
to n where TS1 to TS23 shows transactions on the
first day of admission and TS24 to TS71 is associated
with the second day.
Figure 2: Timeline platform using TsMV model.
Data preparation is summarised in table 3 including
transformation to TS, aggregation, feature
engineering, selection, and data cleaning.
Transformation to TS: Each data set includes the
time/date of admission. Hence, in the transformation
from time/date to TS, each episode number has TS (1
to n).
Feature Engineering | selection and Extractions:
all tables had admission time in the format of seconds
and data was extracted in the form of the hour to
support TsMV solution.
The “vital sign” data set consists of time series
data from ICU, considering data quality analysis, and
based on studying the domain|literature, significant
physiological features were selected for hourly
aggregation. Hence, out of 108 features, specific
biological indicators (pulse rate, temperature,
oxygen, saturation, and heart rate) were chosen. In
addition, a new conditional column was constructed
where oxygen saturation value resulted in four
categories: “actual danger to life”, “critical-refer to a
specialist”, “decrease-insufficient”, and “serve
hypoxia hospitalization”. This new feature will
support clustering performance and the same type of
constructed feature will be applied to other biological
indicators too.
Lab result dataset includes features such as exam
classification, detailed exam, and references
associated with the value of the exam. This feature
was split into min and max references to support the
clustering phase. Moreover, result_status was created
as a conditional column where it compares the result
of the exam with the min-reference and max_refence,
to show if the result is below the minimum or more
than the maximum values. This new feature will be
used in the clustering phase.
The “procedures” table includes “zona” (specific area
of the patient body) and “DNOME” (in the category
of ZONA). Furthermore, the “SOAP” table includes
the subject, assessment, and plan.
The “saps”, has a feature (valor) to show the value
of the patient's gravity. Furthermore, in “Glasgow”,
The status of the patient’s consciousness level is
presented in a feature called valor.
In the “diagnosis” dataset, out of 124 features, 4
are selected where “SERVICE” shows the type of
diagnosis, and “DIAG1” addresses the description of
diagnosis for each episode number.
In addition, “medical administration” consists of
features such as the dose of a drug used by the nurse,
recommended dose, and the code of the drug.
Of the “medical prescription” with 14, out of 39
features, 10 effective ones were selected. Where the
code of medication, prescriptions, dose, and unit of
medicine are the essential ones. we have constructed
a new feature: “Period of Stay” to analyse the period
that a patient starts medication and finishes. This new
feature will be used in clustering.
Finally, the “intervention” like other datasets has
time|date of admission and episode number.
Moreover, intervention service shows the type of
service.
In terms of handling missing cells, in some tables
such as “vital sign,” we filled null cells with the
average of previous and next values and in some other
lab result
procedure
glasgw
TS1
TS2
TS24
TSn
SOAP
vital sign
saps
diognosis
med_admin
Interventinon
KMIS 2022 - 14th International Conference on Knowledge Management and Information Systems
236

datasets, we deleted null cells and marked some other
null cells to decide on the modelling phase. In “lab
result” we constructed three columns to mark null
cells with zero where this method will be used in the
modeling phase. In addition, in “SOAP” we deleted
variables with the majority of missing values and
marked missing cells associated with main features.
As it was discussed, all datasets include
episid|process number, so this feature is used to link
each table to the look-up table (the table consisting of
the episode and process number was considered as the
look-up).
Besides, features such as age, gender, and status
(pre-operation, post-operation) are excluded to a new
table called demographics.
Table 4: Summary of data preparation.
Dataset
Time/Date
to TS
Aggregation
Feature
Engineering|
Selection
Missing
Cells
Vital sign Time hourly X Fille
d
Lab result Time - X Marke
d
p
rocedures Date - X Delete
d
SOAP Date - X Marke
d
sa
p
s
b
oth - X Delete
d
Glas
g
ow
b
oth - X Delete
d
Diagnosis Time - X Delete
d
Med_admin
b
oth - X Delete
d
Med
_p
res
b
oth - X Delete
d
intervention
b
oth - X Delete
d
3 CONCLUSIONS
This paper presents the initial result of TsMV
approach to address the limitations and challenges
identified in the clinical data processing phase.
12 datasets have been used under the guidance of
CRISP_DM methodology to develop the framework
of IDSS4PM.
The current study considered the literature gaps in
integrating time series data from ICU and other
clinical data resources which are multi variables.
They proposed a solution by transforming time-
dependent data to TS (independent of time). This
solution not only provided a unique time sequence
platform for analysing the whole clinical background
from admission to discharge but also can solve
challenges highlighted in literature such as
infrequence data registration. In addition, having sync
data in a unique platform will facilitate the clustering
phase to classify similar patients by various indicators
(medications, period of stay, laboratory results, vital
signs, and SOAP). In addition, the modelling phase
will be performed based on the outcome of the
preparation phase. Based on that, the first three stages
of CRISP-DM are discussed, and this methodology
was modified by adding extra steps (TsMV,
discovery).
Future work will be developed using the outcome
of the fusion of TsMV for discovery phases
(analytical dashboards and clustering) and predicting
the best treatment pathway. Where optimization will
present the sub-optimal outcome by considering the
clinical objectives. Hence, “Discovery”,
“Modelling”, “Evaluation” and “Optimization” will
be performed as further steps to introduce an
IDSS4PM.
ACKNOWLEDGMENTS
The work has been supported by FCT – Fundação
para a Ciência e Tecnologia within the Projects
Scope: DSAIPA/DS/0084/2018.
REFERENCES
Adiba, F. I., Sharwardy, S. N., & Rahman, M. Z. (2021).
Multivariate time series prediction of pediatric ICU
data using deep learning. 2021 International
Conference on Innovative Trends in Information
Technology, ICITIIT 2021. https://doi.org/10.1109/
ICITIIT51526.2021.9399593
Barros, G. (2010). Herbert A . Simon and the concept of
rationality : Boundaries and procedures. 30(March
2009), 455–472.
Blasimme, A., Fadda, M., Schneider, M., & Vayena, E.
(2018). Data sharing for precision medicine: Policy
lessons and future directions. Health Affairs, 37(5),
702–709. https://doi.org/10.1377/hlthaff.2017.1558
Brown, S. A. (2016). Patient similarity: Emerging concepts
in systems and precision medicine. Frontiers in
Physiology, 7(NOV), 1–6. https://doi.org/10.3389/
fphys.2016.00561
Carra, G., Salluh, J. I. F., da Silva Ramos, F. J., &
Meyfroidt, G. (2020). Data-driven ICU management:
Using Big Data and algorithms to improve outcomes.
Journal of Critical Care, 60, 300–304. https://doi.org/
10.1016/j.jcrc.2020.09.002
Delen, D. (2020). Prescriptive Analytics The Final Frontier
for Evidence-Based Management and Optimal
Decision. In Library. Pearson Education, Inc.
Fayyad, U., & Uthurusamy, R. (1996). Data Mining and
Knowledge Discovery in Databases. Communications
of the ACM, 39(11), 24–26. https://doi.org/10.1145/
240455.240463
Intelligent Decision Support System for Precision Medicine; Time Series Multi-variable Approach for Data Processing
237

Fenning, S. J., Smith, G., & Calderwood, C. (2019).
Realistic Medicine: Changing culture and practice in
the delivery of health and social care. Patient Education
and Counseling, 102(10), 1751–1755.
https://doi.org/10.1016/j.pec.2019.06.024
Gigerenzer, G. (2001). Decision Making : Nonrational
Theories. 5, 3304–3309.
Gligorijević, V., Malod-Dognin, N., & Pržulj, N. (2016).
Integrative methods for analyzing big data in precision
medicine. PROTEOMICS, 16(5), 741–758.
https://doi.org/10.1002/PMIC.201500396
Grady, N. W. (2016). Knowledge Discovery in Data KDD
Meets Big Data. Archives of Civil Engineering, 62(2),
217–228. https://doi.org/10.1515/ace-2015-0076
Hertog, D. Den. (2015). Bridging the gap between
predictive and prescriptive analytics - new optimization
methodology needed. 1–15. Retrieved from
http://www.optimization-
online.org/DB_HTML/2016/12/5779.html
Hulsen, T., Jamuar, S. S., Moody, A. R., Karnes, J. H.,
Varga, O., Hedensted, S., … McKinney, E. F. (2019).
From big data to precision medicine. Frontiers in
Medicine, 6(MAR), 1–14. https://doi.org/10.3389/
fmed.2019.00034
Ipp, C. I., Azevedo, A., & Santos, M. F. (2004). Double-
Coated Bonding Material. Appliance, 61(1), 35.
Jiang, F., Jiang, Y., Zhi, H., Dong, Y., Li, H., Ma, S., Wang,
Y. (2017). Artificial intelligence in healthcare: Past,
present and future. Stroke and Vascular Neurology,
2(4), 230–243. https://doi.org/10.1136/svn-2017-
000101
Johnson, N., Parbhoo, S., Ross, A. S., & Doshi-Velez, F.
(2021). Learning Predictive and Interpretable
Timeseries Summaries from ICU Data. ArXiv.Org.
Retrieved from https://www.proquest.com/working-
papers/learning-predictive-interpretable-
timeseries/docview/2576125188/se-
2%0Ahttp://lenketjener.uit.no/?url_ver=Z39.88-
2004&rft_val_fmt=info:ofi/fmt:kev:mtx:journal&genr
e=preprint&sid=ProQ:ProQ%3Aengineeringjournals&
atitl
Kennedy, C. E., & Turley, J. P. (2011). Time series analysis
as input for clinical predictive modeling: Modeling
cardiac arrest in a pediatric ICU. Theoretical Biology
and Medical Modelling, Vol. 8. https://doi.org/10.1186/
1742-4682-8-40
Kennedy, C., & Turley, J. (201AD). Time Series Analysis
As Input for Predictive Modeling : Predicting Cardiac
Arrest in a Pediatric Intensive Care Unit. Theoretical
Biology and Medical Modelling, 8(40), 1–25.
Khadanga, S., Aggarwal, K., Joty, S., & Srivastava, J.
(2019).
Using Clinical Notes with Time Series Data for
ICU Management. Retrieved from
http://arxiv.org/abs/1909.09702
Leprince, J., Miller, C., & Zeiler, W. (2021). Data mining
cubes for buildings, a generic framework for
multidimensional analytics of building performance
data. Energy and Buildings, 248, 111195.
https://doi.org/10.1016/j.enbuild.2021.111195
Liu, X., Luo, X., Jiang, C., & Zhao, H. (2019). Difficulties
and challenges in the development of precision
medicine. Clinical Genetics, 95(5), 569–574.
https://doi.org/10.1111/CGE.13511/
McPadden, J., Durant, T. J. S., Bunch, D. R., Coppi, A.,
Price, N., Rodgerson, K., … Schulz, W. L. (2019).
Health care and precision medicine research: Analysis
of a scalable data science platform. Journal of Medical
Internet Research, 21(4), 1–11.
https://doi.org/10.2196/13043
Mosavi, N. S., & Santos, M. F. (2020). How prescriptive
analytics influences decision making in precision
medicine. Procedia Computer Science, 177, 528–533.
https://doi.org/10.1016/j.procs.2020.10.073
Mosavi, N. S., & Santos, M. F. (2021). To what extent
healthcare analytics influences decision making in
precision medicine. Procedia Computer Science,
198(2021), 353–359. https://doi.org/10.1016/j.procs.20
21.12.253
Pete, C., Julian, C., Randy, K., Thomas, K., Thomas, R.,
Colin, S., & Wirth, R. (2000). Crisp-Dm 1.0. CRISP-
DM Consortium, 76.
Sadat Mosavi, N., & Filipe Santos, M. (2021). Adoption of
Precision Medicine; Limitations and Considerations
(David C. Wyld et al. (Eds), Ed.).
https://doi.org/10.5121/csit.2021.110302
Seyhan, A. A., & Carini, C. (2019). Are innovation and new
technologies in precision medicine paving a new era in
patients centric care? Journal of Translational
Medicine, 17(1), 1–28. https://doi.org/10.1186/s12967-
019-1864-9
Williams, A. M., Liu, Y., Regner, K. R., Jotterand, F., Liu,
P., & Liang, M. (2018). Artificial intelligence,
physiological genomics, and precision medicine.
Physiological Genomics, 50(4), 237–243.
https://doi.org/10.1152/PHYSIOLGENOMICS.00119.
2017
Wu, P. Y., Cheng, C. W., Kaddi, C. D., Venugopalan, J.,
Hoffman, R., & Wang, M. D. (2017). -Omic and
Electronic Health Record Big Data Analytics for
Precision Medicine. IEEE Transactions on Biomedical
Engineering, 64(2), 263–273. https://doi.org/10.1109/
TBME.2016.2573285
Zhang, S., Zhang, C., & Yang, Q. (2003). Data preparation
for data mining. Applied Artificial Intelligence,
17(5–
6), 375–381. https://doi.org/10.1080/713827180
Zhang, Y., Silvers, C. T., & Randolph, A. G. (2007). Real-
time evaluation of patient monitoring algorithms for
critical care at the bedside. Annual International
Conference of the IEEE Engineering in Medicine and
Biology - Proceedings, 2783–2786. https://doi.org/
10.1109/IEMBS.2007.4352906
KMIS 2022 - 14th International Conference on Knowledge Management and Information Systems
238
