
Student-centered Development of an Online Software Tool to Provide
Learning Support Feedback: A Design-study Approach
Gilbert Drzyzga
a
and Thorleif Harder
b
Institute of Interactive Systems, Technische Hochschule L
¨
ubeck, Germany
Keywords:
Student-centered Design, Design Process, Gestalt Laws, Interaction Principles, Usability, User Experience.
Abstract:
Students in online degree programs have a higher risk of dropping out (Diaz, 2002; Beard and Harper, 2002;
Baker et al., 2015). The use of learning support tools such as learner dashboards (LD) can promote self-
regulated learning, which can have a positive impact on student learning (Jivet et al., 2018; Konert et al.,
2016). This paper presents a three-stage design study and shows how the layout of the proposed LD was
implemented from the initial digital design to a low-fidelity prototype. First, the developed wireframes were
checked for consistency with respect to the Gestalt laws (Wertheimer, 1922). From the resulting wirefame
design, a clickable low-fidelity prototype was developed. In the second step, this interactive prototype was
reviewed by students (n=24) respect to the seven interaction principles (DIN EN ISO 9241-110, 2020). In
the third step, the revised prototype was subjected to an eye-tracking procedure using the Thinking Aloud
technique (n=10). The results so far show that the LD should be presented at a reduced information level during
initial access, but that this level can be supplemented by additional elements if necessary. The navigation
hierarchy should be kept flat and the information should be easy to understand.
1 INTRODUCTION
In order to be able to offer students of digital study
programs support that promotes learning during their
studies and to reduce dropout in this form of study
overall, a research project of a university network
for digital study programs with over 4,000 enrolled
students is investigating how students could be sup-
ported in their learning process (Diaz, 2002; Beard
and Harper, 2002; Baker et al., 2015). To this end,
a learner dashboard (LD) is being developed to stim-
ulate student self-regulation. The LD is to be inte-
grated as a plug-in into the university network’s Moo-
dle learning management system (LMS) and, once
completed, will be made available to the community
as open source. Within the framework of a user-
centered design (UCD) approach, it is to be inves-
tigated which indicators, representation, information
and intervention possibilities could be useful in this
process and in which way. To this end, a design-study
was conducted that employed various usability meth-
ods in three steps to obtain qualitative feedback for
the implementation of the user interface from experts
a
https://orcid.org/0000-0003-4983-9862
b
https://orcid.org/0000-0002-9099-2351
(see Figure 1).
The design-study is based on findings from an ini-
tial literature review with the focus on self-regulated
learning in digital learning environments and expert
interviews (n=9). Based on these findings, a first wire-
frame was implemented in the winter semester 2021 /
2022 and subsequently evaluated (Figure 1, Level 1).
During the summer semester of 2022, a low-fidelity
prototype was implemented and is to be used in the
Moodle LMS of the university network in the near
future as the first development level of an LD (Fig-
ure 1, Level 2 and 3). This first technical deployment
level provides descriptive evaluations for students. In
this paper, we present the research questions based on
qualitatively conducted studies presented in the cur-
rent version of the LD as a work in progress. This
approach has proven successful, as it has enabled suc-
cessive optimization of the design of the user interface
with the involvement of experts.
Research Questions (RQ):
• RQ1: How must the user interface elements of
an online support tool be designed to effectively
support learning?
• RQ2: How must the user interface and individual
244
Drzyzga, G. and Harder, T.
Student-centered Development of an Online Software Tool to Provide Learning Support Feedback: A Design-study Approach.
DOI: 10.5220/0011589100003323
In Proceedings of the 6th International Conference on Computer-Human Interaction Research and Applications (CHIRA 2022), pages 244-248
ISBN: 978-989-758-609-5; ISSN: 2184-3244
Copyright
c
2022 by SCITEPRESS – Science and Technology Publications, Lda. All rights reserved
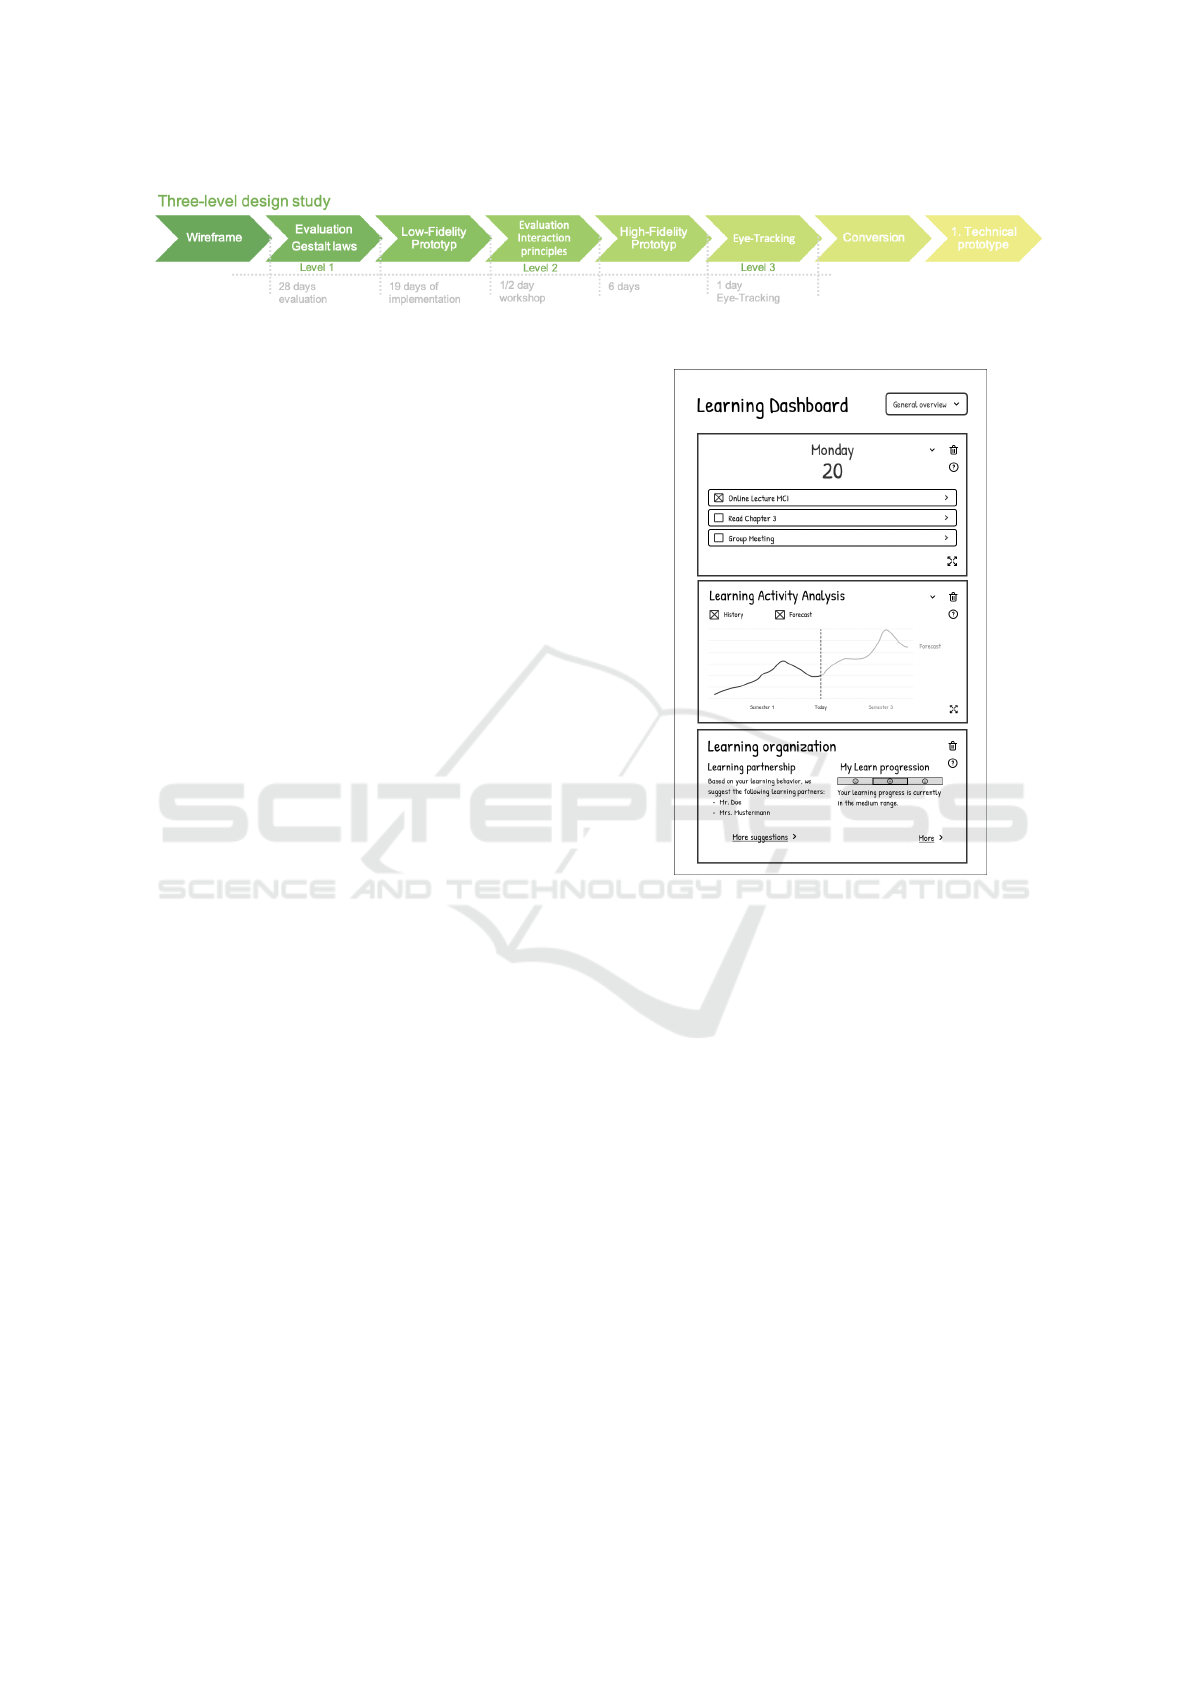
Figure 1: Representation of the three-level design study.
content elements of the online support tool be de-
signed to promote usability and user experience?
2 METHODOLOGICAL
APPROACH
The used investigations in the design-study were con-
ducted on the basis of three usability tests with the
focus group of students.
1. Evaluation of the wireframe by students (n=24)
using the Gestalt laws
(students of a module on human-computer inter-
action)
2. Evaluation of the low-fidelity prototype using
seven interaction principles.
(Students of a human-computer interaction mod-
ule)
3. Student evaluation of the low-fidelity prototype,
including examination of the user experience
(UX) using the User Experience Questionnaire-
Short (UEQ-S)
(Students of a usability module)
3 DEVELOPMENT AND
IMPLEMENTATION OF THE
LD
The first graphic design in the form of a wireframe
of the LD (Figure 2) formed the basis for the investi-
gations. The wireframe was developed based on the
literature review and expert interviews (n=9) as part
of the UCD process following the paper prototype
method.
3.1 Evaluation based on Gestalt Laws
and Fact and Interaction Problems
(Step 1)
The wireframe shown in Figure 2 was examined in
two parts with an additional assignment over a period
of four weeks as part of a module in the online course
Figure 2: First version of the LD wireframe.
Media Informatics in the summer semester of 2022:
In the first part, the online students (n=24) were asked
to evaluate the wireframe for the five Gestalt laws:
”Law of Proximity”, ”Law of Similarity”, ”Law of
Proximity”, ”Law of (Good) Continuation”, ”Law of
Good Gestalt” (Wertheimer, 1922) with at least one
positive or one negative example each. The findings
of Gestalt psychology are intended to reduce the cog-
nitive effort required to assimilate information in LD
in the first place (Wagemans et al., 2012). The second
part was to investigate whether factual and interac-
tional problems are present in the design. Both were
justified with examples in the elaboration. In the sec-
tion ”Created alternative solutions of the wireframe
by students” the additional task is considered sepa-
rately with an example. The result of the investigation
was a total of 75 DIN A4 pages of student findings.
Figure 3 shows an example of an identified problem
on the ”Law of Proximity”.
Student-centered Development of an Online Software Tool to Provide Learning Support Feedback: A Design-study Approach
245
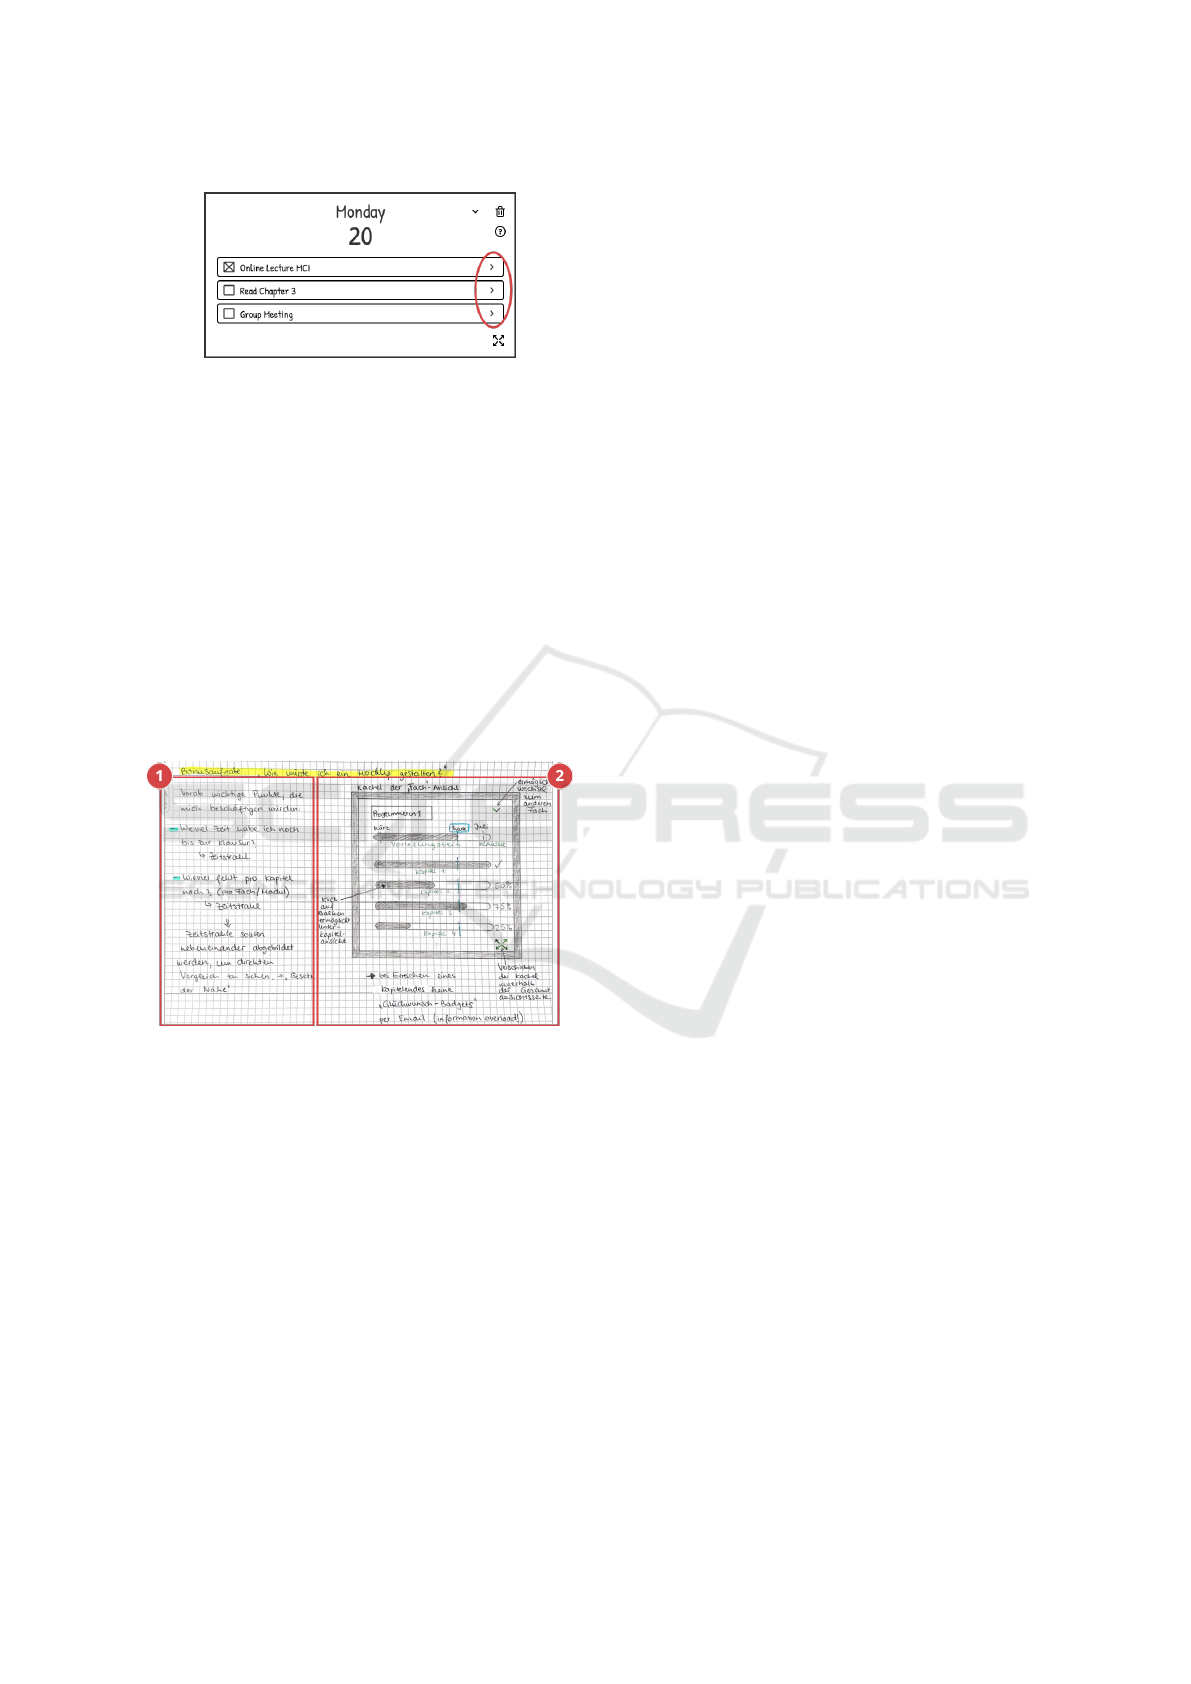
Figure 3: Example from a student of an identified problem
with the Gestalt ”Law of Proximity”.
Alternative Solution of the Wireframe
Created by Students
Those students were given the additional task of cre-
ating an alternative solution for a map of their choice
based on the ”Law of Proximity”. 11 of the 24 stu-
dents solved this task. An example of such a design
can be seen in Figure 4, which illustrates how stu-
dents perceive such functionalities and which aspects
are important to them. Moreover, this demonstrates
the benefits of the approach taken in this design-study,
where the involvement of students results in high-
quality, student-centered outcomes.
Figure 4: Example of a wireframe of a card developed by a
student.
The following text describes the German text
shown in Figure 4 in English.
Bonus Task ”How would I design a mockup?” The
area outlined in red with the number one describes the
issues that would concern the student when viewing
the card:
• How much time do I have until the exam? → time-
line
• How much is still missing per chapter? (per sub-
ject / module of study) → timeline
• Timelines should be displayed side by side to see
direct comparison → ”Law of proximity”
The area outlined with the number two represents the
card of the ”Course” view. The course ”Program-
ming 1” is displayed as the heading. Next to the head-
ing, there is a possibility to go to another course us-
ing the downward arrow. Below that, bars for dif-
ferent information are displayed. The top one shows
the complete lecture period, including the start of the
exam period. The following four progress bars in-
dicate chapters to be completed within the course.
Progress bars show a subchapter view when clicked.
Click on the icon in the lower right corner to move
the card anywhere within the overall view page. A
”congratulations-badge” should not be emailed to
the student as this could result in information over-
load.
The navigation concept was revised because it was
described as contra-intuitive by those students. In or-
der to take the aspect of individualizability into ac-
count, an editing functionality was also integrated.
For the calendar, the interaction options were revised
(marker element deleted, information expanded or
summarized, navigation elements for changing the
days of the week). For the learning progress, the
graphical representation was adapted by popular re-
quest of the students. Due to the variety of infor-
mation within the LD, an additional information el-
ement in the form of a question mark was inserted
in a prominent position (in the first line of the grid,
right-aligned). This can be used to quickly obtain in-
formation about dashboard elements from any view.
Figure 5 shows the revision in detail.
3.2 Evaluation based on the Seven
Interaction Principles (Step 2)
The revised wireframe served as the basis for creat-
ing a low-fidelity prototype. There were 14 different
views with different modal dialog boxes in the final
version of the LD prototype. The individual interac-
tion elements of the LD (question mark icon, zoom
icon, pencil icon, and menu) were designed to be
clickable.
The prototype was made available to students of a
human-computer interaction module (n=24) for eval-
uation during a four-hour online workshop via an
Internet browser. The experts tested and evaluated
the seven interaction principles using a two-part task
(DIN EN ISO 9241-110, 2020). The workshop was
accompanied by 3 persons from the university sector.
The result of the study was a total of 54 DIN A4 pages
with the students’ findings.
CHIRA 2022 - 6th International Conference on Computer-Human Interaction Research and Applications
246
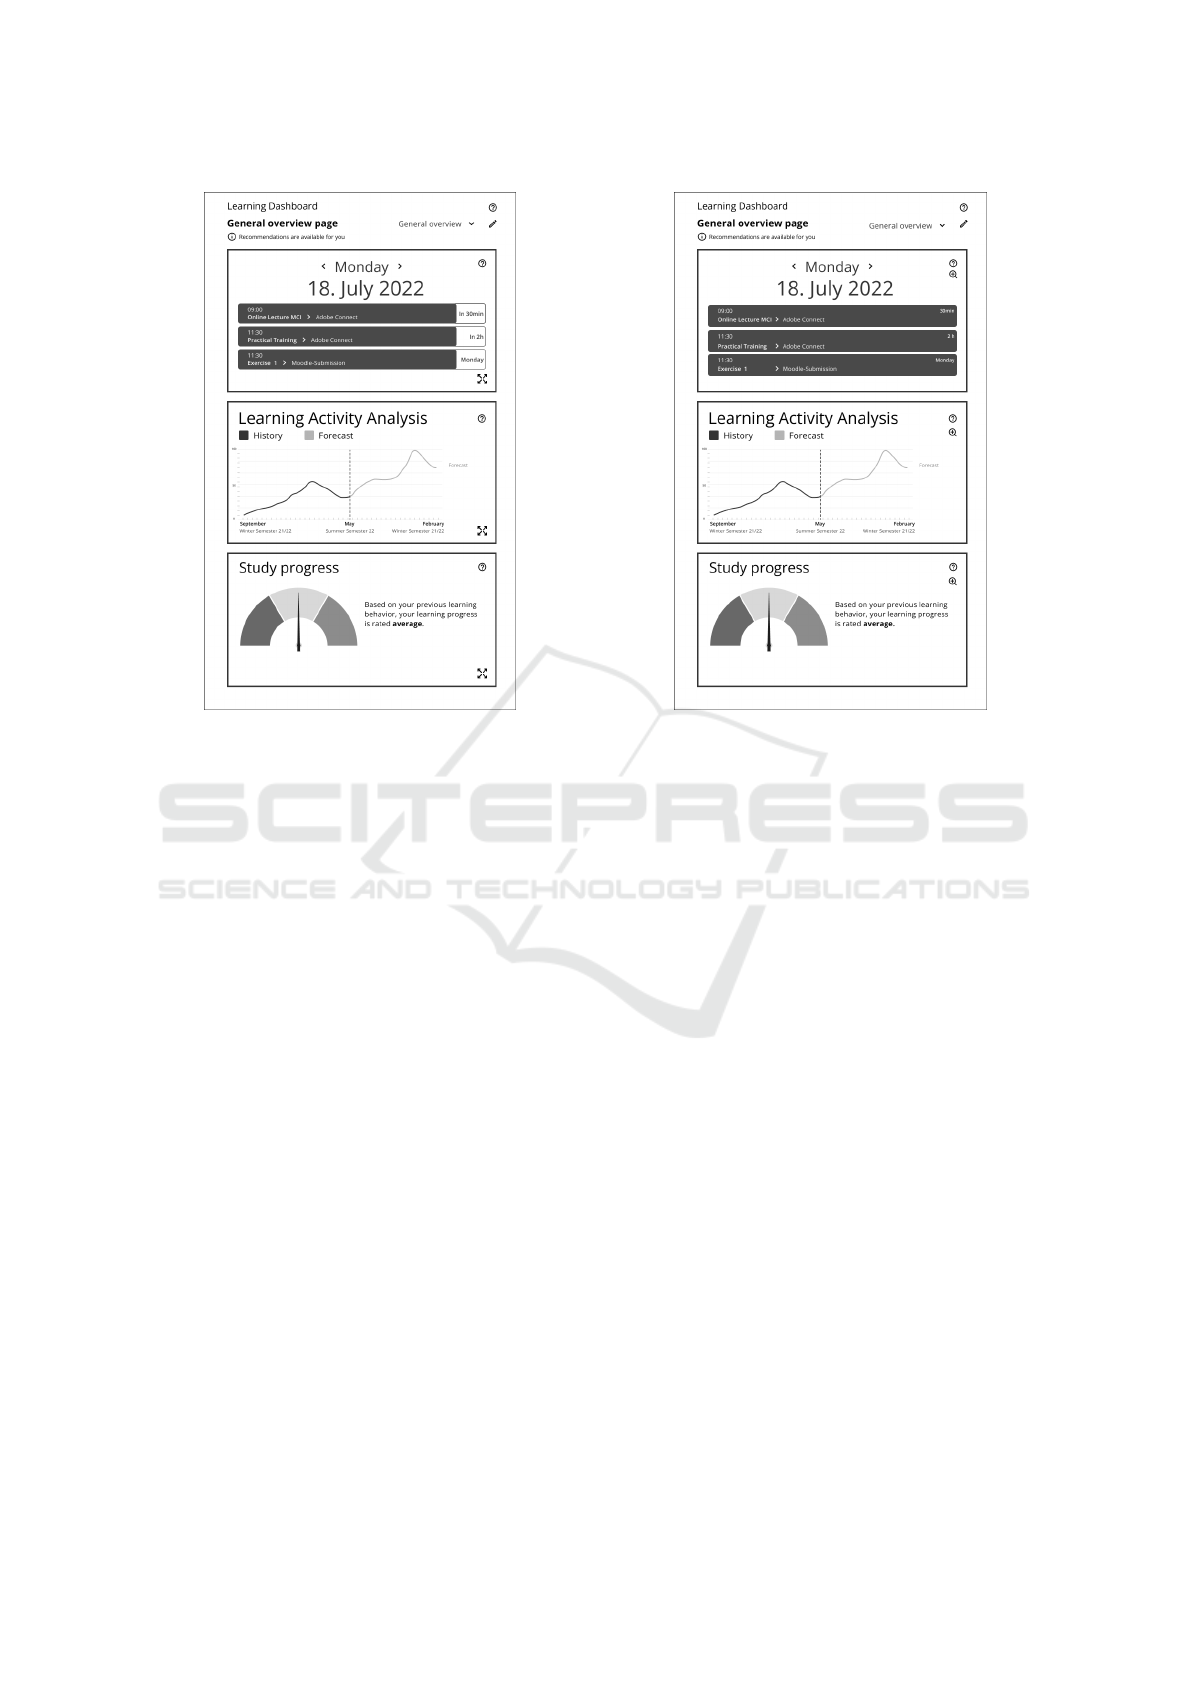
Figure 5: Revised variant of the LD’s wireframe.
3.3 Performing the Eye-tracking
Procedure with Thinking Aloud
(Step 3)
The entire low-fidelity prototype was revised with the
new findings (Figure 5 shows part of the revised LD).
Afterwards, it was evaluated by a group of students
from a usability module (n=10). The entire study was
conducted in one day. Each session lasted a total of
30 minutes (including a welcome, introduction of the
project, and explanation of the procedure). Students
were presented with several subtasks to complete dur-
ing the 20-minute testing period and were guided by
moderators. After the eye-tracking study, students
performed a rating of the LD using the short ver-
sion of the User Experience Questionnaire (UEQ-S)
(Schrepp et al., 2017). This was used to evaluate the
overall usability of the prototype. Since eye-tracking
study was conducted only recently, only the already
available results are presented below.
First Results of the Third Step of the
Design Study
The students confirmed the implementation of the
navigation concept and the general structure of the
LD. Specifically, they stated that the descriptions
should be precise and brief and can be expanded by
Figure 6: Low-fidelity prototype of the LD.
clicking on further or more detailed information as
needed. This applies, for example, to the recommen-
dations on learning progress, which should initially be
presented only in condensed form when the detailed
view is called up. The reason for this is that the LD is
accepted as an additional element to support learning,
but this should not interfere too much with the actual
learning time of the students. It should be possible to
add additional user-defined information to the assess-
ments (e.g., current exam grades or progress in read-
ing the learning content). However, this needs further
research as students expressed that the functionality
might be too complicated or time-consuming. For
the top-level help page, students would like to see a
walkthrough or short slideshow for the LD instead of
textual information (also time-consuming). In the us-
ability test, it was found that the navigation structure
is not always intuitive: for example, the icon for more
information about the displayed content was not al-
ways recognized as such. One solution would be to
make the entire map clickable. The individual views
(overall view, semester view and module view) could
not be distinguished in some cases. Here, the way the
content is displayed should be reconsidered in order
to better distinguish between the different views.
Student-centered Development of an Online Software Tool to Provide Learning Support Feedback: A Design-study Approach
247

3.4 Student Opinions from the
Evaluations
The evaluations clearly showed that the students got
a good idea of the future purpose and benefit that
the shown wireframes depicted. For example, the
students commented in particular on the interaction
principle ”User Engagement” that the interest was
aroused ”[...] whether the learning behavior has im-
proved (or worsened) after a few days - the ambition is
aroused, game character”. Further feedback showed
that the students were pleased with the LD in their
studies and could imagine ”[...] that the available in-
formation would lead to structuring my studies fur-
ther or better and thus increase the chances of success.
Which in turn leads to using the system permanently.”
4 OUTLOOK & DISCUSSION
The next steps include the evaluation of the eye-
tracking study, the revision of the LD and subsequent
transfer as a plug-in into the LMS. The results so far
show that the direct exchange with the students is cru-
cial in order to be able to offer a LD that is used and
accepted. Important aspects and impulses for the in-
formation transfer, the design as well as the structure
and conception of a learning-supporting LD could be
gained. It is important that no additional (time and
cognitive) effort is required when using the LD, e.g.
for familiarization and understanding of its use, as it
bears the risk of not being used by online students.
The design study brought substantial results for fur-
ther research and implementation of the LD in the
LMS.
ACKNOWLEDGEMENTS
This work was funded by the German Federal
Ministry of Education, grant No. 01PX21001A /
01PX21001B.
REFERENCES
Baker, R. S., Lindrum, D., Lindrum, M. J., and Perkowski,
D. (2015). Analyzing early at-risk factors in higher ed-
ucation e-learning courses. International Educational
Data Mining Society.
Beard, L. A. and Harper, C. (2002). Student perceptions of
online versus on campus instruction. EDUCATION-
INDIANAPOLIS THEN CHULA VISTA-, 122(4):658–
663.
Diaz, D. P. (2002). Online drop rates revisited. The tech-
nology source, 3(3):35–51.
DIN EN ISO 9241-110 (2020). DIN EN ISO
9241-110:2020-10, ergonomie der mensch-system-
interaktion - teil 110: Grunds
¨
atze der dialoggestal-
tung (ISO 9241-110:2020); deutsche fassung EN ISO
9241-110:2020.
Jivet, I., Scheffel, M., Specht, M., and Drachsler, H.
(2018). License to evaluate: Preparing learning an-
alytics dashboards for educational practice. In Pro-
ceedings of the 8th international conference on learn-
ing analytics and knowledge, pages 31–40.
Konert, J., Bohr, C., Bellh
¨
auser, H., and Rensing, C. (2016).
Peerla-assistant for individual learning goals and self-
regulation competency improvement in online learn-
ing scenarios. In 2016 IEEE 16th International Con-
ference on Advanced Learning Technologies (ICALT),
pages 52–56. IEEE.
Schrepp, M., Hinderks, A., and Thomaschewski, J. (2017).
Design and evaluation of a short version of the user ex-
perience questionnaire (ueq-s). International Journal
of Interactive Multimedia and Artificial Intelligence, 4
(6), 103-108.
Wagemans, J., Elder, J. H., Kubovy, M., Palmer, S. E.,
Peterson, M. A., Singh, M., and von der Heydt, R.
(2012). A century of gestalt psychology in visual per-
ception: I. perceptual grouping and figure–ground or-
ganization. Psychological bulletin, 138(6):1172.
Wertheimer, M. (1922). Untersuchungen zur lehre von der
gestalt. Psychologische forschung, 1(1):47–58.
CHIRA 2022 - 6th International Conference on Computer-Human Interaction Research and Applications
248
