
The Concept of Application of the Wroclaw Taxonomy for QoS
Assessment in Mobile Networks
Dariusz Zmysłowski
a
and Jan M. Kelner
b
Institute of Communications Systems, Faculty of Electronics, Military University of Technology, Warsaw, Poland
Keywords: Assessment of Services, Dendrite, Diagnostic Variables, KPI, Matrix of Parameters, Mobile Networks,
Non-Linear Taxonomy, User Experience, QS, QoE, Wroclaw Taxonomy, 4/5g Networks, Readiness for 5g.
Abstract: Measurement and analysis of the QoS/QoE parameters of the 5G network are of great importance for
telecommunications operators, telecommunications market regulators, and end users of networks. The
assessment of the preparation of the network infrastructure and cellular systems for the provision of 5G
services has become particularly important. METIS II project defined the functional requirements for each of
the five service use case scenarios. Benchmark measurements of cellular networks operating in the same area
using drive tests make it possible to estimate the key performance indicators (KPI) value for every use case
scenario. They also provide data to calculate each use case's aggregated values and thus compare the network
in terms of readiness for 5G services. The paper aims to present the concept of using the Wroclaw Taxonomy
method to assess the QoS of the network and to determine an aggregated measure characterizing the mobile
network for readiness for 5G services.
1 INTRODUCTION
The quality of services in mobile networks is
currently of immense importance both for
telecommunications infrastructure operators, its end
users (subscribers and subscribers of services), and
regulators of telecommunications markets (DRP,
2020).
In the literature on the subject, standards, and
recommendations, both ETSI and ITU-R, but also in
the so-called "good practices", there are visible
methodologies of research and quality assessment
based on QoS (Quality of Service) and perceived
quality of QoE (Quality of Experience) measures
(Berger, 2019), (Falkowski-Gilski & Uhl, 2020). QoS
indicators allow you to research, analyze and evaluate
the technical aspects of the functioning of the network
providing services in terms of meeting the
requirements set by them (Mellouk et al, 2013). QoE
parameters are used to characterize the services of a
given network from the user's perspective (Pierucci,
(2015).
When deciding on the user's choice of the selected
mobile network and the specific services it offers, it
a
https://orcid.org/0000-0002-1214-1308
b
https://orcid.org/0000-0002-3902-0784
is important to have QoE data for individual services.
Such a knowledge is also important for the
telecommunications market regulator to indicate to
users and to compare individual networks available to
them (DRP, 2020). In addition, the regulator may use
the conclusions of QoS and QoE analyses when
assessing the compliance of a given operator with
declarations submitted in auction and concession
procedures in terms of network and service
development, their scope, range, and quality (3GPP,
(2022).
For the network operator, knowledge of QoS and
QoE is a valuable tool for assessing the network and
the level of services provided by it, but it is also used
to determine the causes of network failures,
unavailability of services, and their performance
fluctuations. In addition, operators can use the
conclusions from the analysis of QoS and QoE
measurements to assess the performance of devices
and systems offered by suppliers at the stage of PoC
(Proof of Concept) pilot studies of new network
solutions (ETSI, 2019).
The key problem is to use computationally
efficient methods to compare networks (Kolenda,
Zmysłowski, D. and Kelner, J.
The Concept of Application of the Wroclaw Taxonomy for QoS Assessment in Mobile Networks.
DOI: 10.5220/0011575900003318
In Proceedings of the 18th International Conference on Web Information Systems and Technologies (WEBIST 2022), pages 485-494
ISBN: 978-989-758-613-2; ISSN: 2184-3252
Copyright
c
2022 by SCITEPRESS – Science and Technology Publications, Lda. All rights reserved
485
2006), (Loska &Dąbrowski, 2014
)
in terms of QoS
and QoE offered in them.
2 ASSESSMENT OF QOS IN 5G
NETWORKS
Scoring operational aspects of the mobile network by
comparing the current values of representative key
performance indicators (KPIs) obtained from
operational measurements should allow for
evaluating individual areas of its activity. In addition,
it is possible to assess the readiness of a given
network and its components to meet the functional
and system requirements, such as readiness for
operation, continuity, and integrity of service
provision, operational reliability, for the indicated
areas of its use by current and future users, and utility
applications (Soós et al.,2020). These requirements
were defined by standardization institutions such as
ITU-R (ITU-R, 2015), ETSI (ETSI, 2019), as well as
teams of researchers of 3GPP (3GPP, 2022), 5G PPP
(5GPPP, 2022
)
, and METIS I and II projects
(Boccardi, et al 2014).
The indicators for each of the
services, as well as the method of their measurement
and evaluation, have been defined (ETSI, 2009),
(ETSI, 2011), (ETSI, 2014), (ETSI, 2018),
(ETSI,2018-10), and are widely used by
telecommunications operators, market regulators,
companies that perform professional QoS/QoE
measurements, and research & development
institutions.
As part of the METIS, and METIS II projects, use
cases (UC) were defined that relate to their use by 5G
network users in end-to-end connections (Elayoubi et
al., 2016). In 2013, METIS project working groups
appointed twelve UCs for five service scenarios
named (METIS D1.1, 2013):
amazingly fast,
great service in a crowd,
ubiquitous things communicating,
best experience follows you,
super real‐time and reliable connections.
The revision and update of service requirements
were the results of the work of the METIS II project.
Finally, completed in the 2016 year by the
development of the Deliverable D 1.1 “Refined
scenarios and requirements, consolidated use cases,
and qualitative techno-economic feasibility
assessment” (METIS-II D1.1, 2016). This resulted in
the identification of the following three Use case
families: Extreme Mobile BroadBand (xMBB),
Massive Machine-Type Communications (mMTC),
and Ultra-reliable Machine-Type Communications
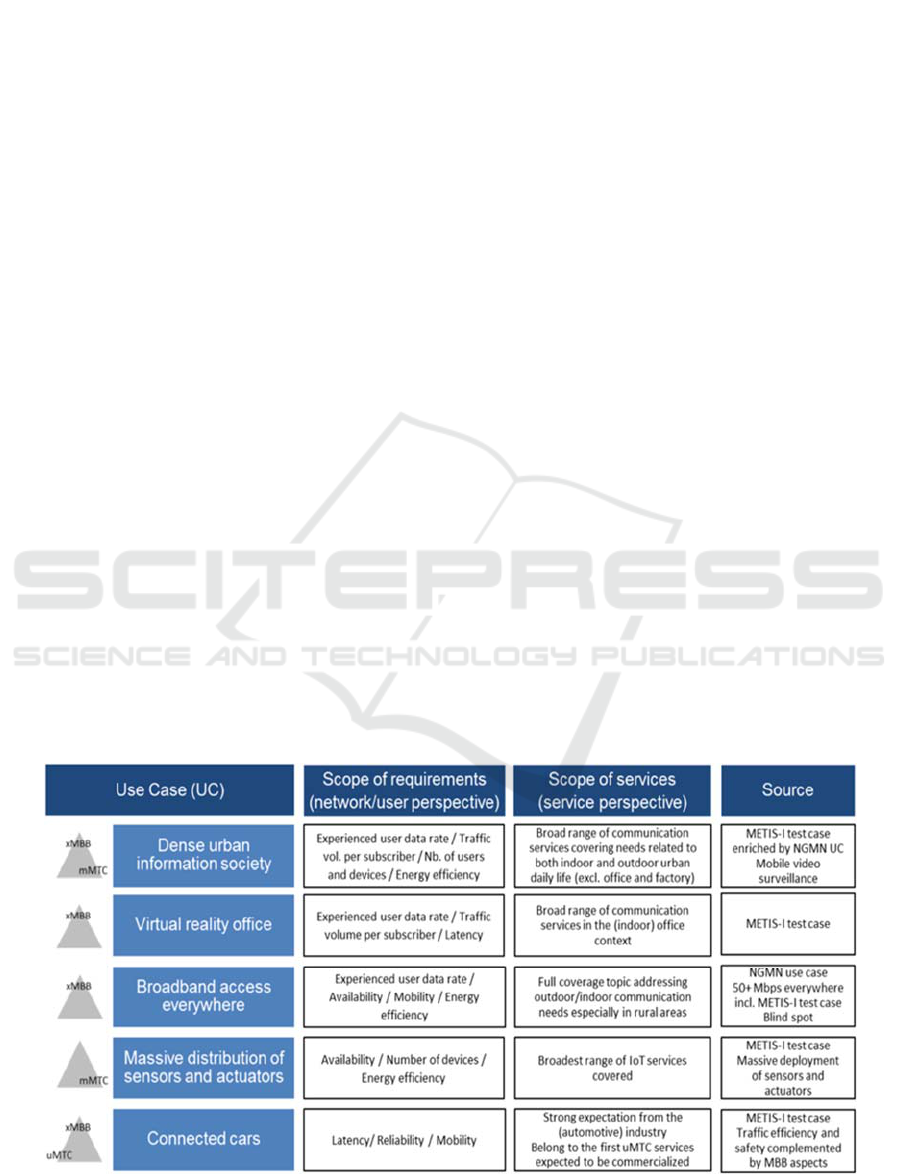
(uMTC). The structure of service use case families
with the requirements for them and assigned to the
UC is presented in Table 1.
The following five UCs were distinguished: UC1-
Dense urban information society, UC2 - Virtual
reality office, UC3 - Broadband access everywhere,
UC4 Massive distribution of sensors and actuators,
UC5 Connected cars. Each UC has defined
quantitative requirements expressed in the values of
the KPIs assigned.
Table 1: The structure of families of service use cases (METIS-II D1.1., 2016).
QQSS 2022 - Special Session on Quality of Service and Quality of Experience in Systems and Services
486
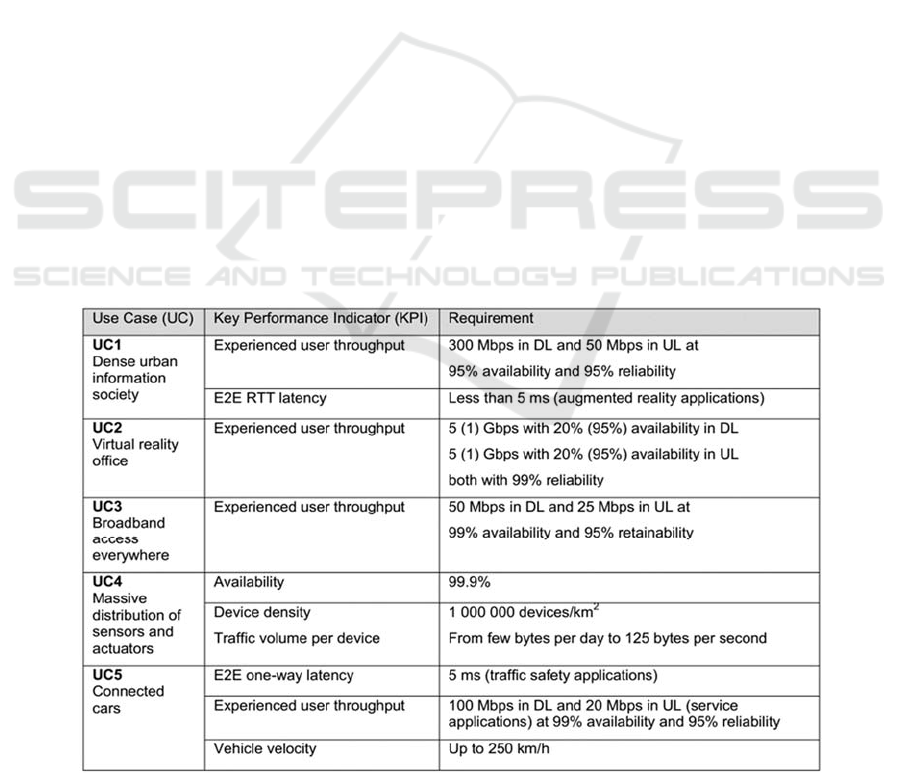
The requirements for KPIs specified in Table 2.
may be used as reference values for:
5G network services implemented,
perceived performance (experienced user
throughput),
system performance (E2E RTT latency, traffic
volume per device, E2E one way latency),
density of saturation by end user devices (device
density),
availability of the network (availability),
the ability to manage objects in motion (vehicle
velocity).
The assignment of service UC to groups of 5G
network services is shown in Figure 1.
KPI benchmarks also assess the readiness of a
given network to support a set of 5G services (ITU-
R, 2015), (
METIS-II
D1.1
,
2016
), (
METIS
D1.5,
2015
),
(METIS-II D2.3, 2017).
It makes it possible to classify every single
network in terms of the degree of their adaptation to
quantified requirements by evaluation using
statistical methods based on 5G network
measurements. Obtaining high compliance values is
a significant measure of the market position of a
network. End-users perceive such a network as
attractive in terms of service. Networks achieving
higher values of individual UCs are recognized as
more adapted to the current and future users' needs. It
may directly influence the end user's decision to
select a service provider. The assessment of the
network in terms of its QoS and QoE parameters is
dealt with by:
specialized teams of mobile network operators,
regulators of telecommunications markets,
specialized test & measurement entities with
knowledge, experience, and technical
equipment that can prepare and conduct tests in
conditions as close to reality as possible in the
environment where the services are delivered.
Operators are interested in the possibility of assessing
and comparing the quality parameters of the operated
and managed networks because they can:
1) compile the results of own measurements of
network devices and systems as well as data
from management and maintenance systems
with the results of measurements carried out by
specialized companies,
2) compare their network with the networks of
competing operators operating in the same area,
3) assess the quality of services provided to end
users,
4) use measurement data to analyze the current use
of services, plan the development of service
infrastructure,
5) use data in the form of KPIs for operational
analyzes, such as:
analysis of traffic trends,
Table 2: Summary of main KPIs and requirements for each METIS-II use case (METIS-II D1.1., 2016).
The Concept of Application of the Wroclaw Taxonomy for QoS Assessment in Mobile Networks
487
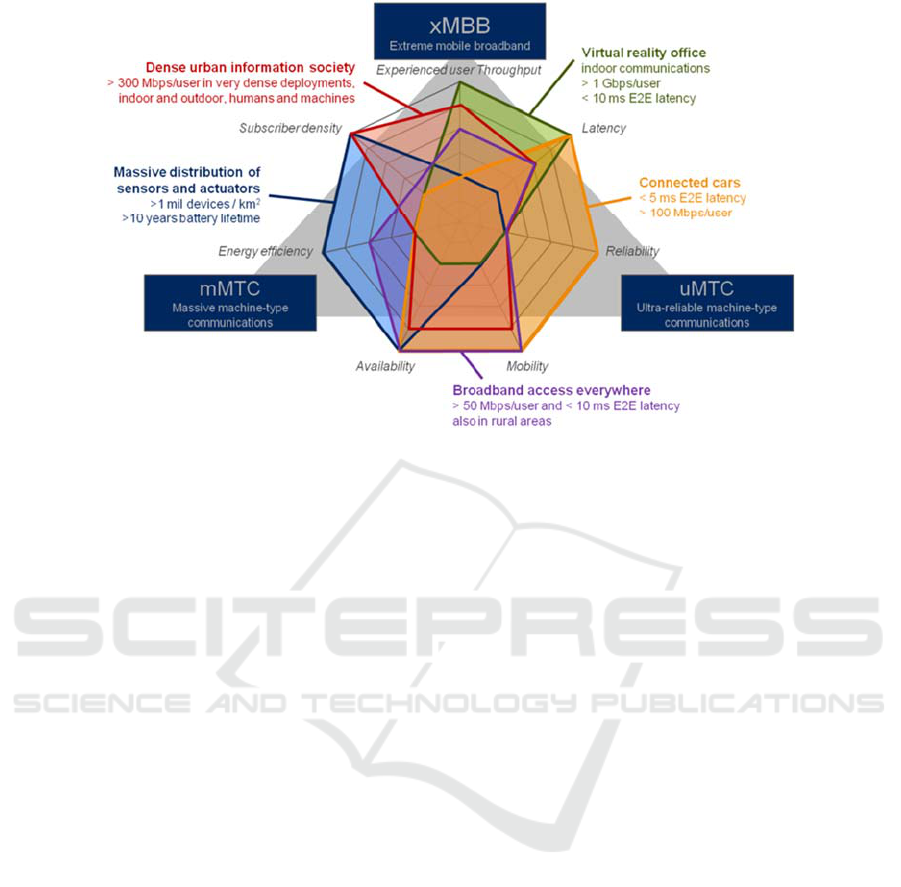
Figure 1: Mapping service use cases to the service groups of 5G network (METIS-II D1.1., 2016).
multi-profile analysis of service use,
analysis and evaluation of anomalies,
interruption of the service,
damage of the infrastructure, etc.
Regulators of telecommunications markets:
1) define the rules of operation of the
telecommunications services market in a given
country or area,
2) state the legal and technical framework for the
operation of telecommunications systems and
networks,
3) organize and manage relations between
telecommunications operator and end-user.
They are also supervising, designating,
controlling, and managing the requirements for the
minimum conditions for the provision of
telecommunications services.
Measurements, monitoring, and analysis of the
current state of telecommunications services and
assessment of their quality are major aspects of the
regulator's present and long-term activity.
Based on the results of measurements and
analysis, regulators determine:
the scale of compliance with the requirements
for operators in concession procedures,
the quality of telecommunications services,
resolves disputes regarding services and their
quality,
plans and supervises investments aimed at
improving the coverage of the country's territory
with services with the assumed minimum
efficiency and quality parameters.
Taking into account the previously mentioned
standards and recommendations, each of the above
entities measures the quality of telecommunications
services, considering "good practices" resulting from
environmental experiences and using measuring
equipment and analytical tools.
Telecommunications operators and regulators of
telecommunications markets often use the services of
specialized companies that perform QoS and QoE
measurements, which perform comparative
measurements of many networks, process and
analyze data, prepare lists of quality parameters of the
networks reviewed, and prepare conclusions and
recommendations for the networks tested.
This type of measurement is called network
benchmarking.
These diagnostic activities in the mobile network
environment are performed through "drive test"
testing.
These tests are conducted by using passive and
active network service analyzers.
The tests cover all relevant services of the mobile
network. The results are statistically processed.
Implemented mechanisms of artificial intelligence,
machine learning, and rules of selection "big data"
make data post-processing much more effectively
from time and cost perspectives. Concluding, they
allow to find patterns and dependencies and speed up
the process of selection and processing of
measurement data.
As the result of the data processing process, the
measured values of KPIs, UC values, summaries of
QQSS 2022 - Special Session on Quality of Service and Quality of Experience in Systems and Services
488
these parameters for individual measurement periods,
and various measurement conditions are obtained.
Numerical calculations are available for
estimating the output parameters as aggregated
network quality metrics.
The form of displaying processed data depends on
the purpose of the research and the selection of an
effective way to present it. Sample charts are shown
in Figures 2-3.
Employing the approach presented in (METIS-II
D1.1.,2016), based on data gained from benchmarking
measurements, you can assess how each of the tested
mobile networks operating in the same area is ready to
fulfill the requirements for 5G services.
Systemics -PAB Sp. z o.o., which has been carrying
out comparative studies of mobile operator networks
in many countries of the world for over 15 years, has
made available for research measurement data on the
preparation of the infrastructure of two mobile
network operators to support 5G services.
The measurements were carried out using the
SwissQual Diversity Smart Benchmarker and
SwissQual QualiPoc equipment (R & S., 2016)
and
the Iperf3 application (Iperf3., 2022).
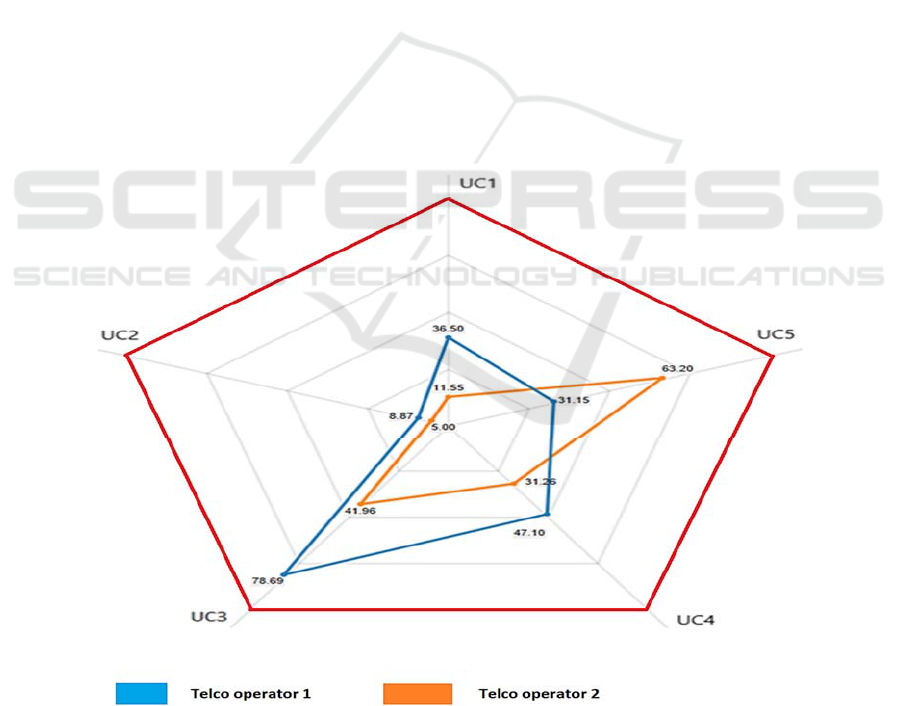
Based on the obtained data, the radar chart was
prepared, shown in Figure 2.
Each edge of the pentagram of the graph in Figure
2 represents a value from 0 (center) to 100% for each
use case. Figure 3 presents a more detailed view that
shows the percentages for each KPI included in each
UC for two compared networks.
This representation allows you to compare values
of KPI between mobile telco operators and locations.
3 CHARACTERISTICS OF THE
RESEARCH PROBLEM
Designated both values of KPI parameters and the
services UCs will allow you to evaluate the compared
mobile networks in terms of their preparation to
support the operation and features of families of 5G
services (METIS-II D1.1., 2016), (METIS-II
D2.3.,2017).
The research problem is to define a metric that
uniquely characterizes the readiness of mobile
networks to support 5G services and a method of its
enumeration. Such a metric supports a comprehensive
assessment of the readiness of a given mobile
Figure 2: Comparison of the readiness of the networks of two mobile telco operators to the implementation of 5G services
(SysPAB, 2021).
The Concept of Application of the Wroclaw Taxonomy for QoS Assessment in Mobile Networks
489
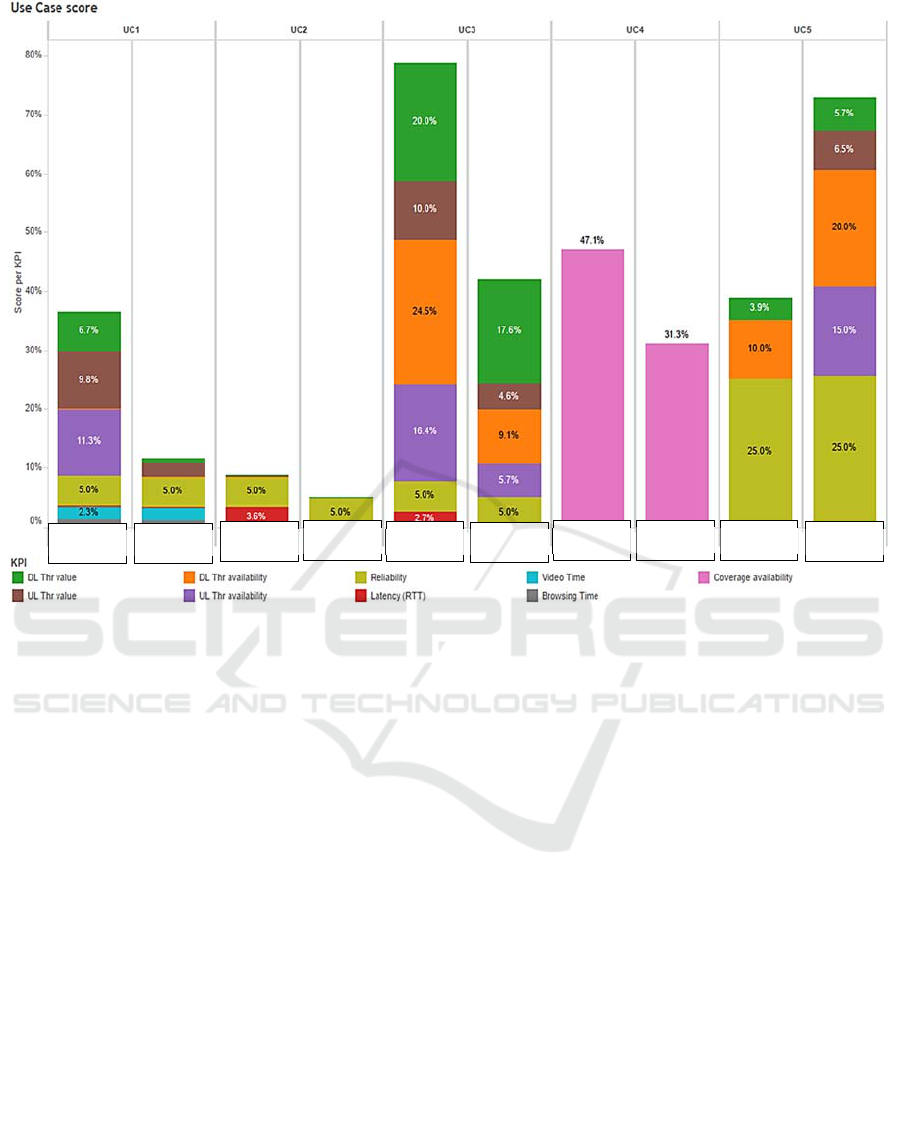
Figure 3: Values of KPI of the compared mobile networks (SysPAB, 2021).
network for the operation of the services described by
the set of services use cases:
{UC
1
,UC
2
, UC
3
, UC
4
,UC
5
}.
There are two cases of metrics to consider:
1) time related:
𝑈𝐶
𝑡,𝑈𝐶
𝑡,𝑈𝐶
𝑡,𝑈𝐶
𝑡,𝑈𝐶
𝑡 (1)
2) with a constant value over some time:
𝑈𝐶
,𝑈𝐶
,𝑈𝐶
,𝑈𝐶
,𝑈𝐶
(2)
Comparing the metrics for different networks
operating in the same area and their analysis may
simplify the decision-making processes of
telecommunications operators and market regulators
about the issues described in point 2.
Having values of services use cases UC for
territorially different places and areas of the network
will allow for the designation and development of 5G
QoS awareness maps (Skokowski, 2021).
The spectral awareness maps have become
established in the operational practice of entities
operating in the telecommunications market, so
perhaps the idea of the 5G QoS awareness maps will
be positively received and widely used in practice.
The end user of the mobile network and its
services, knowing the practical interpretation of the
designated metric values, would have a chance to
consciously evaluate the market offer before deciding
on the choice of a given network or further use of its
services.
This paper presents a proposed method for
calculating the aggregate metric of a mobile network
based on UC values obtained from benchmarking
measurements and post-processing data processing.
The concept of applying the Wroclaw taxonomy
(Perkal, 1953), (Kolenda, 2006).
for the assessment
of the QoS of mobile networks is presented in Figure
4.The input data are sets of calculated values:
𝑍
𝑡
,
𝑍
𝑡
,….𝑍
𝑡
KPI making up the service use cases
(1) for each network from the set of evaluated mobile
networks:
M=
𝑚
,𝑚
,…𝑚
, (3)
where:
𝑚
𝑖𝑛𝑑𝑖𝑐𝑎𝑡𝑖𝑜𝑛 𝑘 𝑛𝑢𝑚𝑏𝑒𝑟 𝑜𝑓 𝑚𝑜𝑏𝑖𝑙𝑒 𝑛𝑒𝑡𝑤𝑜𝑟𝑘
𝑘𝜖𝑁 𝑎𝑛𝑑 𝑁 𝑖𝑠 𝑎 𝑠𝑒𝑡 𝑜𝑓 𝑛𝑎𝑡𝑢𝑟𝑎𝑙 𝑛𝑢𝑚𝑏𝑒𝑟𝑠.
Telco
Operator1
Telco
Operator1
Telco
Operator1
Telco
Operator1
Telco
Operator1
Telco
Operator2
Telco
Operator2
Telco
Operator2
Telco
Operator2
Telco
Operator2
QQSS 2022 - Special Session on Quality of Service and Quality of Experience in Systems and Services
490
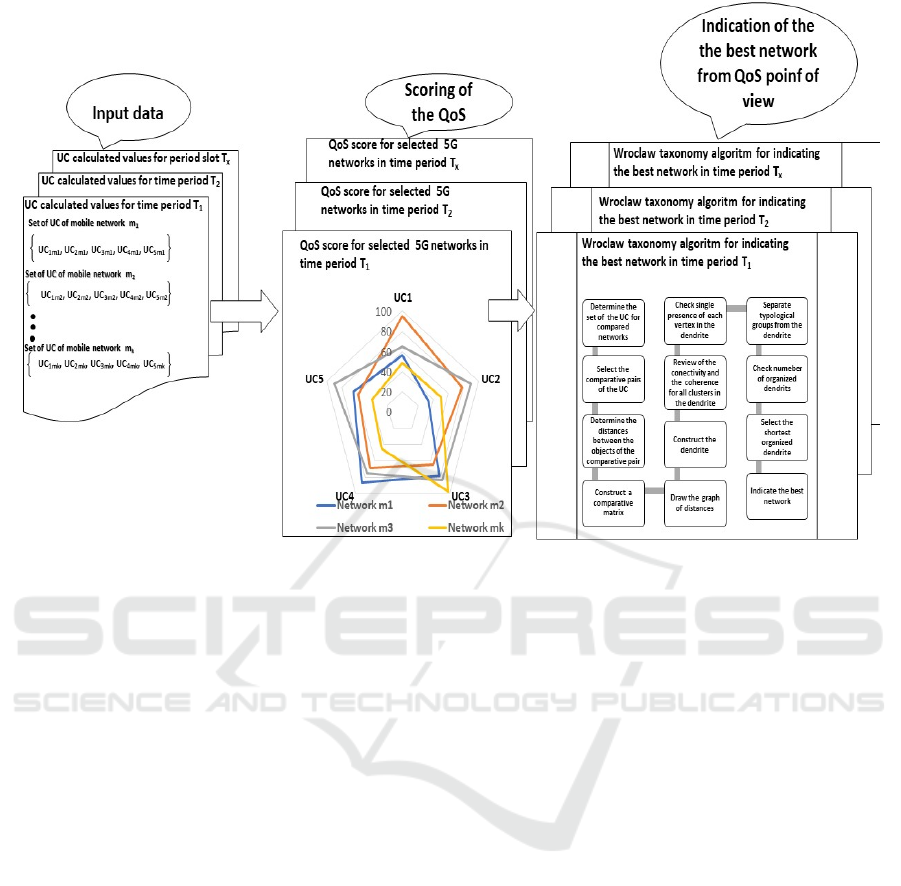
Figure 4: An idea of use of the Wroclaw taxonomy in the QoS assessment of mobile networks (own study, 2022).
For the general case, taking into account that the
values included in the sets are time-dependent, we
take the following formula:
𝑆
𝑡 𝑈𝐶
𝑡
,𝑈𝐶
𝑡
,…..,𝑈𝐶
𝑡
(4)
𝑆
𝑡 𝑈𝐶
𝑡
,𝑈𝐶
𝑡
,….,𝑈𝐶
𝑡
…
𝑆
𝑡 𝑈𝐶
𝑡
,𝑈𝐶
𝑡
,….,𝑈𝐶
𝑡
where: 𝑆
𝑡
,
𝑆
𝑡
,
𝑆
𝑘 are sets of values:
𝑈𝐶
𝑡
……
𝑈𝐶
𝑡
;
𝑡𝜖
0,∞
;
𝑈𝐶
𝑡
……𝑈𝐶
𝑡
𝜖𝑅;
𝑚
–mobile network numbered by 𝑘𝜖𝑁.
If the comparison of several mobile networks is
conducted on data determined during one
measurement campaign, which is collected
simultaneously for the measured networks, then you
can consider setting metrics for individual periods of
campaign duration. The output data sets then are
described by the formula:
𝑆
𝑈𝐶
,𝑈𝐶
,
,….,𝑈𝐶
(5)
𝑆
𝑈𝐶
,𝑈𝐶
,
,…,𝑈𝐶
….
𝑆
𝑈
,𝑈𝐶
,
,….,𝑈𝐶
where: 𝑆
,
𝑆
,
𝑆
are sets of values:
𝑈𝐶
,
->
𝑈𝐶
,
respectively in
the range of :
𝑇
,
𝑇
,𝑇
𝑈𝐶
,
…𝑈𝐶
,
𝜖𝑅;
𝑚
–mobile network numbered by 𝑘𝜖𝑁.
After calculating the values of services use cases
UCs for each of the evaluated networks, the next step
is to compare them.
It consists in plotting the determined values on the
radar diagram. It allows you to find out about the
features of the compared mobile networks. For
example, the network named Telco operator 1,
represented in blue in Figure 2, is the most adapted to
support UC 3 services, that is broadband access
everywhere, as the percentage of adaptations of this
network to support broadband access services is
78.69% concerning the value of references that
represent the value of 100%, drawn in red.
The Wroclaw taxonomy method allows for the
determination of an aggregated metric 𝑄
𝑡 that
determines the variability of the quality of QoS
services of the mobile network 𝑚
over time.
However, for the periods: 𝑇
,𝑇
,..,𝑇
in which
KPI measurements were made, it allows for
calculating the values of the metrics
𝑄
respectively.
The Concept of Application of the Wroclaw Taxonomy for QoS Assessment in Mobile Networks
491

It is possible to distinguish from the compared sets
𝑆
𝑡 of the evaluated networks 𝑚
, a set 𝑆
∗
𝑡,
which represents the highest value 𝑄
∗
𝑡
. The
considered method assumes operating on points of the
multi-dimensional space representing objects,
phenomena, and values that are classified according
to the verifiable pattern.
We assumed that such points would be the values
of the service use cases: 𝑈𝐶
𝑡
…… 𝑈𝐶
𝑡
respectively for networks :𝑚
…..𝑚
.
Therefore, the multidimensionality of the location
of these points will be determined by:
the identifier of the network,
time of the value measurement of the UC,
coordinates of the location of measurement
points.
Thanks to this, it is possible to construct a
coherent graph on the elements of sets in the
multidimensional space: 𝑆
𝑡
,𝑆
𝑡
,...,𝑆
𝑡
.
The constructed graph connects all points with
𝑛1 edges.
Each edge connects two points and has a metric
length defined by a Euclidean distance in a
multidimensional space.
The method assumes mapping all points of a
multidimensional space on a plane.
When constructing a coherent graph, it is
necessary to attach its closest neighbor to a specific
point, that is closest to it.
The mapping criterion is the arrangement of
points on the plane that the sum of the distances
between them is as small as possible. The graphic
image of such a mapping is a coherent, unclosed
graph called a dendrite (Jarocka, 2013), (Loska &
Dąbrowski, 2014), the graphic representation of a
dendrite is a broken, continuous line, which may
branch but may not contain cycles (closed)
(Ćwiąkała-Małys, 2009). Then a matrix of distances
between points is constructed. In the graph under
consideration, vertices are points represented by the
values of service use cases:
𝑈𝐶
𝑡
,𝑈𝐶
𝑡
,𝑈𝐶
𝑡
,
𝑈𝐶
𝑡
,𝑈𝐶
𝑡
of the network 𝑚
, that is the subject of evaluation,
and the edges measure the distance between them.
The method allows for computationally effective
determination of QoS metrics of the evaluated
networks and the assessment of their value
concerning the pattern.
The pattern is a representative reference value for
service use cases presented in Table 2 (METIS-II
D1.1.,2016). The metrics of the QoS of
networks:𝑚
…..𝑚
are determined by dividing the
dendrite by eliminating the longest edges in it, which
indicate the highest distances between the points of
the dendrite. This division of the dendrite into clusters
is called natural (Kolenda, 2006).
The dendrite divides the set of K service groups
of use cases 𝑆
= 𝑆
,𝑆
,….,𝑆
into typological
groups, due to the 5 selected features 𝑈𝐶
𝑙
1,2,…,5).
The algorithm for determining the QoS and
readiness of networks for 5G services is as follows
(Ćwiąkala-Małys, 2009), (Zmysłowski, 2021).
A. Determine the set of 5 parameters adopted
for the description of the service use case to
be assessed → the compared sets of
parameters 𝑈𝐶
of service use cases from the
set 𝑆
𝑡 should be clearly described in
numbers;
B. Determine the distances between the objects
of the comparative pair 𝑑
(𝑖,𝑗1,2,…,𝐾)
– the distance between the 𝑖th and 𝑗th
objects → use the Euclid metric:
𝑑
𝑍
𝑍
⁄
(6)
where 𝑍
and 𝑍
are standardized 𝑈𝐶
feature
values in 𝑆
and 𝑆
objects, respectively.
1. Construct a comparative matrix:
𝐷
0𝑑
𝑑
0
…𝑑
…𝑑
……
𝑑
𝑑
0…
…0
(7)
2. Construct dendrite via:
a) Assigning to each of the 𝐾-tested 𝑆
and 𝑆
objects most similar to it, i.e., one for which
the distance d
ij
has the smallest value;
b) Connecting the edges of the vertices
corresponding to 𝑆
and 𝑆
– obtaining 𝐾
connections of nearest units;
c) Eliminating one connection from each pair of
redundant connections;
d) Determining clusters of examined objects, i.e.,
combining connections with the same single
vertices into sets, so that each vertex occurs
only once;
e) Arranging the clusters to obtain a connected
graph.
3. Check if all the clusters of the dendrite have
been connected with each other and formed a
coherent graph.
4. Check if each vertex (i.e., tested disturbance)
is present only once in the dendrite.
QQSS 2022 - Special Session on Quality of Service and Quality of Experience in Systems and Services
492

5. Separate typological groups from the dendrite.
It is achieved by removing (i.e., cutting off)
the next longest edges of the dendrite.
6. The obtained clusters were connected with
each other according to the principle of the
smallest distance between them. As a result,
they resulted in a dendritic arrangement.
7. Assess which of the scored mobile networks
meet the 5G readiness pattern requirements.
4 CONCLUSIONS
Information is a key to being more competitive and
attractive in today's telecommunications market. The
state of art regarding QoS and QoE, as well as trends
that change their values, are important not only from
a technical but also from a business point of view.
Methods and ways of getting it are under
consideration by R&D teams, operators, and
regulators.
The paper presents how to avail the measurement
data collected along the drive test campaigns to
compare the QoS of evaluated mobile networks. The
QoS measurements were represented by the services
use cases defined in the METIS II project. We
proposed the idea of applying the Wroclaw taxonomy
for assessing and scoring the readiness of the mobile
network for operating 5G. The Wroclaw taxonomy is
widely used for comparing complex objects to find
the best pattern or select the most representative item
from the group of evaluated objects. We assumed that
5G mobile networks are also complex objects
characterized by many varied parameters, so using
this method will be justified.
The input data was obtained from benchmarking
tests collected during drive test campaigns and then
were processed following the described algorithm.
However, the applied method does not allow
calculating the aggregated QoS metric characterizing
each network.
We are going to research it deeper later on.
The article presents the theoretical assumptions of
the method and the general concept of its application,
so we plan to verify described idea practically at the
next stage of development.
It is also worth considering ways of implementing
this proposed idea in the virtual cloud to allow faster
access to post-processed data.
Shortly, the authors are planning to conduct
research of relationships between measurement
conditions and values of KPIs for every single UC of
compared networks (Zmysłowski & Kelner, 2022).
ACKNOWLEDGEMENTS
This work was financed by the Military University of
Technology under Research Project no. UGB/22-
740/2022/WAT on “Modern technologies of wireless
communication and emitter localization in various
system applications”.
The authors would like to thank the CEO of
Systemics - PAB Sp. z o.o., Mr. Paweł Biskupski for
providing the measurement data for this article.
REFERENCES
Boccardi, F. et al. (2014). Scenarios for 5G Mobile and
Wireless Communications: The Vision of the
METIS Project, IEEE Communications Magazine
doi: 10.1109/MCOM.2014.68158
Berger, J. (2019). Workshop presentation, QoS and QoE in
5G networks Evolving applications and measurements,
QSDG Workshop, Singapore
Ćwiąkała-Małys. A. (2009). Research paper, Application of
the Wroclaw taxonomy in the comparative analysis of
public academic universities, [in Polish: Zastosowanie
taksonomii wrocławskiej w analizie porównawczej
publicznych uczelni akademickich], Badania
Operacyjne i Decyzje nr1./2009
DRP. (2020). web service technical regulation – Quality of
service, Digital regulation platform https://
digitalregulation.org/technical-regulation- quality-of-
service/
Elayoubi, S. E. et al. (2016). Conference paper, 5G service
requirements and operational use cases: Analysis and
METIS II vision, European Conference on Networks
and Communications (EuCNC), pp. 158-162, doi:
10.1109/EuCNC.2016.7561024.
ETSI. (2019). Technical report, Speech and multimedia
Transmission Quality (STQ); Best practices for robust
network QoS benchmark testing and scoring. (ETSI
TR103 559 v.1.1.1). https://www.etsi.org/deliver/
etsi_tr/103500_103599/103559/01.01.01_60/tr_10355
9v010101p.pdf
ETSI. (2009). Technical report, Human Factors (HF);
Quality of Experience (QoE) requirements for real-time
communication services, (ETSI TR 102 643 V1.0.1),
https://www.etsi.org/deliver/etsi_TR/102600_102699/
102643/01.00.00_60/TR_102643v010000p.pdf
ETSI. (2011). Technical report, Speech and multimedia
Transmission Quality (STQ); QoS Parameter
Measurements based on fixed Data Transfer Times.
(ETSI TR 102 678).
ETSI. (2014). Speech and multimedia Transmission
Quality (STQ); QoS aspects for popular services in
mobile networks; Part 2: Definition of Quality of
Service parameters and their computation., (ETSI TS
102 250-2)
The Concept of Application of the Wroclaw Taxonomy for QoS Assessment in Mobile Networks
493

ETSI. (2018). Speech and multimedia Transmission
Quality (STQ); Speech samples and their use for QoS
testing, (ETSI TR 103 138)
ETSI. (2018_10). Speech and multimedia Transmission
Quality (STQ); QoS aspects of TCP-based video
services like YouTube™, (ETSI TR 101 578)
ITU-R. (2015). Draft New Recommendation, , IMT Vision
- Framework and overall objectives of the future
development of IMT for 2020 and beyond, Working
Party WP 5D (Doc. R12-SG05-C-0199) Iperf3. (2022).
https://iperf.fr/
Jarocka, M. (2013). Scentific paper, Influence of the
method of selecting diagnostic features on the result of
linear ordering on the example of ranking of Polish
universities, [in Polish: Wpływ metody doboru cech
diagnostycznych na wynik porządkowania liniowego
na przykładzie rankingu polskich uczelni], Prace
naukowe Uniwersytetu Ekonomicznego we
Wrocławiu, nr 279, p. 85-94.
Kolenda, M. (2006). The book, Numerical taxonomy:
classification, ordering and analysis of multi-feature
objects, [in Polish: Taksonomia numeryczna:
klasyfikacja, porządkowanie i analiza obiektów
wielocechowych], Wydawnictwo Akademii
Ekonomicznej im. Oskara Langego, Wrocław
Loska, A. & Dąbrowski, M. (2014). Conference paper,
Modeling of the operating policy evaluation of a
network technical system based on numerical
taxonomy methods [in Polish: Modelowanie oceny
polityki eksploatacyjnej sieciowego systemu
technicznego w oparciu o metody taksonomii
numerycznej], in: Innovations in Management and
Engineering of Production [in Polish: Innowacje w
Zarządzaniu i Inżynierii Produkcji]. pp. 700–713.
METIS. D1.1. (2013). Deliverables Scenarios,
requirements and KPIs for 5G mobile and
wireless system (ICT-317669-METIS/D1.1). https://
metis2020.com/wp-content/uploads/deliverables/METIS
_D1.1_v1.pdf
METIS. D1.5. (2015). Deliverables Updated scenarios,
requirements and KPIs for 5G mobile and wireless
system with recommendations for future
investigations (ICT-317669 METIS/D1.5) https:
//metis2020.com/wp-content/uploads/deliverables/
METIS_D1.5_v1.pdf
METIS-II. D1.1. (2016). Deliverables Refined scenarios
and requirements, consolidated use cases, and
qualitative techno-economic feasibility assessment
(ICT-671680 METIS II, Deliverable
D1.1) https://metis-ii.5g-ppp.eu/wp-content/uploads/
deliverables/METIS-II_D1.1_v1.0.pdf
METIS-II. D2.3. (2017). Deliverables Performance
evaluation results (ICT-671680 METIS-II, Deliverable
D2.3) https://metis-ii.5g-ppp.eu/wp-content/uploads/
deliverables/METIS-II_D2.3_V1.0.pdf
METIS-II. D2.4. (2017). Deliverables Final Overall 5G
RAN Design (ICT-671680 METIS-II, Deliverable
D2.4), https://metis-ii.5g-ppp.eu/wp-content/uploads/
deliverables/METIS-II_D2.4_V1.0.pdf
Falkowski-Gilski, P. & Uhl, T. (2020). Study of cellular
network quality on the eve of 5G technology on a
selected example [in Polish: Badanie jakości sieci
komórkowych w przededniu technologii 5G na
wybranym przykładzie]. Telecommunication Review
and Telecommunication News, 93(7–8), 338–341.
https://doi.org/10.15199/59.2020.7-8.45
Perkal, J. (1953). The Wroclaw taxonomy” [in Polish:
Taksonomia wrocławska]., Przegląd Antropologiczny,
t. XIX, 82-195, Poznan. https://www.academia.
edu/45647159/Perkal_J_Taksonomia_wroclawska
Skokowski, P. (2021), Building awareness of the e
electromagnetic situation in ad hoc networks with
cognitive nodes. [in Polish:Budowanie świadomości
sytuacji elektromagnetycznej w sieciach doraźnych z
węzłami kognitywnymi]. Military University of
Technology, Warsaw.
Soós, G., et al. (2020),. Practical 5G KPI measurement
results on a non-standalone architecture, NOMS 2020
2020 IEEE/IFIP Network Operations and Management
Symposium, 2020, pp. 1-5, doi: 10.1109/
NOMS47738.2020.9110457.
Mellouk, A. et al. (2013). Quality of experience vs. quality
of service: Application for a CDN Architecture, 21st
International Conference on Software,
Telecommunications and Computer Networks
(SoftCOM 2013), pp. 1-8, doi: 10.1109/SoftCOM.
2013.6671898.
R & S. (2016). Benchmarker II takes off into the Polish
telecommunications market (PD 5214.6774.32). Rohde
& Schwarz
Pierucci, L. (2015). The quality of experience perspective
toward 5G technology, IEEE Wireless
Communications, vol. 22, no. 4, pp. 10-16, doi:
10.1109/MWC.2015.7224722.
SysPAB. (2021). Internal technical report. Systemics -PAB
Zmysłowski, D. (2021). Conference paper, Application of
Wroclaw Taxonomy in Classification of GNSS
Interferences in Business Use, Proceedings of the 38th
International Business Information Management
Association (IBIMA), pp. 7468 – 7473
Zmysłowski, D. & Kelner, J. M. (2022). Conference paper,
Drive test-based correlation assessment of QoS
parameters for exemplary measurements scenario in
suburban environment, in 2022 18th International
Conference on Web Information Systems and
Technologies (WEBIST), Special Session on Quality of
Service and Quality of Experience in Systems and
Services (QQSS).
5GPPP, 5
th
Generation Public-Private-Partnership, see
http://5g- ppp.eu
3GPP, (2022): System Architecture for the 5G System,
(TS23.501 version 17.5.0 Release 17) https://
www.3gpp.org/ftp/Specs/archive/23_series/23.501/.
QQSS 2022 - Special Session on Quality of Service and Quality of Experience in Systems and Services
494
