
Drive Test-based Correlation Assessment of QoS Parameters
for Exemplary Measurements Scenario in Suburban Environment
Dariusz Zmysłowski
a
and Jan M. Kelner
b
Institute of Communications Systems, Faculty of Electronics, Military University of Technology, Warsaw, Poland
Keywords: Quality of Service (QoS), Quality of Experience (QoE), Video Mean Opinion Score (VMOS), Signal-to-
Interference-plus-Noise Ratio (SINR), Reference Signal Received Power (RSRP), Drive Test, Pearson
Correlation Coefficient.
Abstract: The development of mobile networks is directly related to developing the telecommunications services market.
Introducing new services requires adjusting methods of quality of service (QoS) assessment and management.
QoS control measurements in mobile networks are a standard practice carried out by specialized companies
for mobile network operators and regulators of the telecommunications market. In this paper, we analyze a
selected measurement scenario for a suburban environment in which QoS was evaluated for video
transmission from the YouTube service. The Systemics-PAB Group company carried out the measurements
for the Polish regulator, the Office of Electronic Communications. The obtained measurement results are the
basis for the correlation analysis between the QoS parameters. The analysis results show a strong relationship
between the selected parameters, which can be used in modeling and simulation studies.
1 INTRODUCTION
The first mobile networks only provided voice call
services. With the development of the next
generations of mobile networks, new services have
been made available to users, including short message
service (SMS), multimedia messaging service
(MMS), or broadly understood packet data
transmission (Razeghi, 2007; Lloyd-Evans, 2002).
Offering new, diverse telecommunications services in
subsequent generations of cellular networks forced
the development, implementation, and improvement
of quality management systems for the provided
services (Oodan et al., 2002). In the modern third
(3G), fourth (4G), and fifth generation (5G) mobile
networks, the concept of quality is usually analyzed
in three aspects, i.e., quality of network (QoN),
service (QoS), and experience (QoE) (Falkowski-
Gilski & Uhl, 2020). In the remainder of the paper,
we use the acronym QoS understood as quality in a
wide sense.
Correlation is one of the fundamental tools used
in the analysis and processing of data and signals,
e.g., (Schwarzinger, 2013; Ziółkowski & Kelner,
a
https://orcid.org/0000-0002-1214-1308
b
https://orcid.org/0000-0002-3902-0784
2016). Correlation analysis allows you to find
similarities and relationships between two variables,
properties, features, signals, or processes.
Correlation methods are also used in QoS research
and methods. For example, (Yu et al., 2021) proposed
a novel algorithm of approximate service
composition, which is based on QoS correlation. Its
task is to determine the optimal path of service
delivery.
The work (Li et al., 2019) proposes an innovative
approach to service selection that not only considers
QoS correlations of services but also accounts for
QoS correlations of user requirements. The proposed
solution is decentralized, which avoids a single point
of failure. The authors of (Li et al., 2019) presented
experimental results that showed the effectiveness of
the developed solution. A similar approach has been
proposed in (Chervenets et al., 2016). On the other
hand, simplified service selection methods are
described in (Wang et al., 2017; Deng et al., 2016).
The solution shown in (Wang et al., 2017) is based on
the QoS correlation of requirements. The authors of
(Deng et al., 2016) proposed the so-called
correlation-aware service pruning (CASP) method.
Zmysłowski, D. and Kelner, J.
Drive Test-based Correlation Assessment of QoS Parameters for Exemplary Measurements Scenario in Suburban Environment.
DOI: 10.5220/0011575800003318
In Proceedings of the 18th International Conference on Web Information Systems and Technologies (WEBIST 2022), pages 497-504
ISBN: 978-989-758-613-2; ISSN: 2184-3252
Copyright
c
2022 by SCITEPRESS – Science and Technology Publications, Lda. All rights reserved
497

The CASP approach is based on managing QoS
correlations by accounting for all services that may be
integrated into optimal composite services and prunes
services that are not the optimal candidate services.
The authors of (Ahmad et al., 2020) conducted a
correlation analysis between QoS metrics such as
signal strength, average delay, jitter, and average
packet loss. This analysis was performed for real-time
cellular QoS metrics data, and the authors observed a
significant correlation between several QoS
parameters. Simultaneously, they indicate that some
network emulators, e.g., NetEm (Jurgelionis et al.,
2011; Sliwinski et al., 2010), do not consider the fact
that some QoS parameters are correlated. In (Kim &
Choi, 2010; Bae et al., 2009), the correlations
between QoS/QoE metrics in the video signal were
analyzed.
In this paper, we analyze the correlation between
QoS parameters. The presented results of the analysis
are based on a drive-test (i.e., mobile measurements)
carried out in a suburban environment for two mobile
network operators (MNOs). Tests for video live-
streaming from YouTube (YouTube, 2021) were
selected for the analysis. This service was carried out
using the 3G and 4G standards, i.e., Universal Mobile
Telecommunications System (UMTS) and Long
Term Evolution (LTE), respectively.
The remainder of the paper is organized as
follows. Section 2 presents the test-bed, measurement
scenario, and analyzed QoS metrics. Section 3
contains the results of the performed correlation
analysis of QoS parameters. In the final part of the
paper, we show a summary.
2 DRIVE TEST
The correlation assessment of the QoS metrics was
carried out based on measurements in 3G (UMTS)
and 4G (LTE) mobile networks in Poland. The drive
tests were made by Systemics-PAB Group company
on behalf of the Office of Electronic Communications
(UKE), the Polish telecommunications market
regulator (Kruszewski & Malinowski, 2022). The
measurements were carried out in suburban areas,
near Warsaw in the fourth quarter of 2021. Our
analysis is based on data for the selected scenario, i.e.,
video live-streaming from the YouTube service.
Benchmarking video streaming services was
performed with a dedicated mobile application. The
following sections describe the test-bed, scenario, and
measured QoS parameters.
2.1 Measurement Test-bed
The QoS measurements were made by the Systemics-
PAB Group company using the professional Rohde &
Schwarz test-bed. The measurement system included
SwissQual Diversity Smart Benchmarker Rel. 20.3
based on measuring terminals with SwissQual
QualiPoc software (Kruszewski & Malinowski, 2022).
In tests, the Samsung Galaxy S20 + 5G
(SM-G986BDS) measuring terminals were utilized.
These terminals support the carrier aggregation
technology and all bands used by MNOs in Poland.
A passive scanner, Rohde & Schwarz TSME6,
was used for measuring the QoS metrics that
represented the quality and power of radio signals.
The scanner supports all frequency bands used in
mobile networks.
Figure 1 shows part of the test-bed mounted in the
rear trunk of the car. The measuring terminals were
placed in special housings in the roof box at a height
of about 1.8 m.
Figure 1: Test-bed mounted in the rear trunk (R&S, 2016).
2.2 Measurement Scenario
The research was conducted in the vicinity of
Piaseczno and Góra Kalwaria towns, south of
Warsaw, from November 29 to December 14, 2021.
During the measurements, tests for voice calls and
data transfers were performed. Data transfer tests
included the YouTube live-stream, Hypertext
Transfer Protocol (HTTP) browsing, and transfer. In
this paper, we only analyzed data for the YouTube
test for which three scenarios were performed:
The G1 scenario played two-minute YouTube
videos with 10-second intervals between
videos.
The G2 scenario consisted of playing a
60-second movie three times, followed by a
1-second preload ping. Then, there was a
resection pause for 10 seconds.
The G3 scenario consisted of playing a
10-second movie ten times, followed by a
2-second preload ping. Then, there was a
resection pause for 10 seconds.
QQSS 2022 - Special Session on Quality of Service and Quality of Experience in Systems and Services
498

Figure 2: Maps with measurement points (bins) in YouTube test for a) MNO no. #1 and b) MNO no. #2 (Kruszewski &
Malinowski, 2022).
It is worth emphasizing that the concept of a
measurement point (bin) used in this paper should
refer to a specific section of the measurement route
(as well as the time interval) in which a single test was
carried out for the analyzed scenario.
The tests were conducted for two MNOs
providing telecommunications services in Poland,
marked as MNO no. #1 and #2 – for formal reasons,
the data has been anonymized. In the case of MNO
no. #1, the video transmission service from YouTube
was provided using two technologies, 3G (UMTS)
and 4G (LTE). In the case of MNO no. #2, all
transmissions were made using LTE.
Figure 2 illustrates a situational map with plotted
measurement points (bins) for three scenarios (G1,
G2, and G3) and two MNOs (Kruszewski &
Malinowski, 2022). A green bin means that the test
has been qualified as correct, while other colors
indicate different errors that occurred during the test.
In our analyzes, only the results corresponding to the
green bins (‘Qualified’) were used, i.e., where the
QoS metric values were determined.
2.3 Measured QoS Metrics
During the measurements, for each measurement
point (bin), various parameters were determined
regarding the MNO, time and place of measurement,
used technology (i.e., UMTS or LTE), the average
vehicle speed (AvgSpeed), and QoS parameters,
including:
VMOS – video mean opinion score – a
subjective metric representing video quality;
the parameter value is determined in the range
from 1 to 5, with an accuracy of 0.1;
AR – average resolution of video related to the
number of pixels (p) in the film frame level –
parameter representing video quality; its value
is determined in the range from 360p to 1080p
(i.e., Full High Definition);
RSCP – reference signal code power –
parameter representing radio signal power in
dBm, designated only for UMTS technology;
EC/IO – downlink carrier-to-interference ratio
– parameter representing radio signal quality in
dB determined for UMTS technology;
RSRP – reference signal received power –
parameter representing radio signal power in
dBm, designated only for LTE technology;
SINR - signal-to-interference-plus-noise ratio –
parameter representing radio signal quality in
dB determined for LTE technology.
A description of the last two mentioned metrics is
presented in (Afroz et al., 2015). In this case, the
authors show also their measurement results in the
LTE network.
Drive Test-based Correlation Assessment of QoS Parameters for Exemplary Measurements Scenario in Suburban Environment
499
3 CORRELATION ASSESSMENT
3.1 Correlation Metrics
In our analyzes, we use the Pearson correlation
coefficient (PCC) defined as
E
,
XY
XY
XY
PCC X Y
,
(1)
where
i
X
x
and
i
Yy
represent sets of two
analyzed parameters,
E
is the expectation
operator,
X
,
Y
,
X
, and
Y
represent mean
values and standard deviations of
X
and
Y
,
respectively, i.e.,
E
X
X
,
2
E
XX
X
,
E
Y
Y
,
2
E
YY
Y
.
(2)
PCC is used to assess the correlation between two
QoS metrics or the correlation of the average vehicle
speed (AvgSpeed) with the selected QoS parameter.
In the case of parameters for which PCC > 0.5, the
linear regression using the least squares method and
the deviation of the measurement results in relation to
the obtained line were determined.
3.2 Preparation of Measurement Data
In the YouTube tests performed by Systemics-PAB
Group, total bins (i.e., measurement points) were
equal to 5566 and 6060 bins for MNOs no. #1 and #2,
respectively. In the case of MNO no. #1, video
transmissions using the UMTS and LTE technologies
were performed for 339 (6.1%) and 5227 bins
(93.9%), respectively. For further analysis, only the
data with the ‘Qualified’ status were used, which
means that the test was successful, and the values of
all analyzed metrics were determined. In the case of
MNO no. #1, video transmission tests were successful
with UMTS and LTE for 60.2% and 89.4%,
respectively. In the case of MNO no. #2, video
transmission tests were finished successfully in LTE
technology for 93.3%.
Correlation analyzes were carried out for three
data sets, i.e., MNO#1-UMTS, MNO#1-LTE, and
MNO#2-LTE.
3.3 Correlation between QoS
Parameters
Using the prepared data from tests in UMTS
technology, the PCCs between the four QoS metrics
described in Section 2.3 were determined. For the
MNO#1-UMTS dataset, RSCP, EC/IO, AR, and
VMOS were used. The determined PCC values are
included in Table 1.
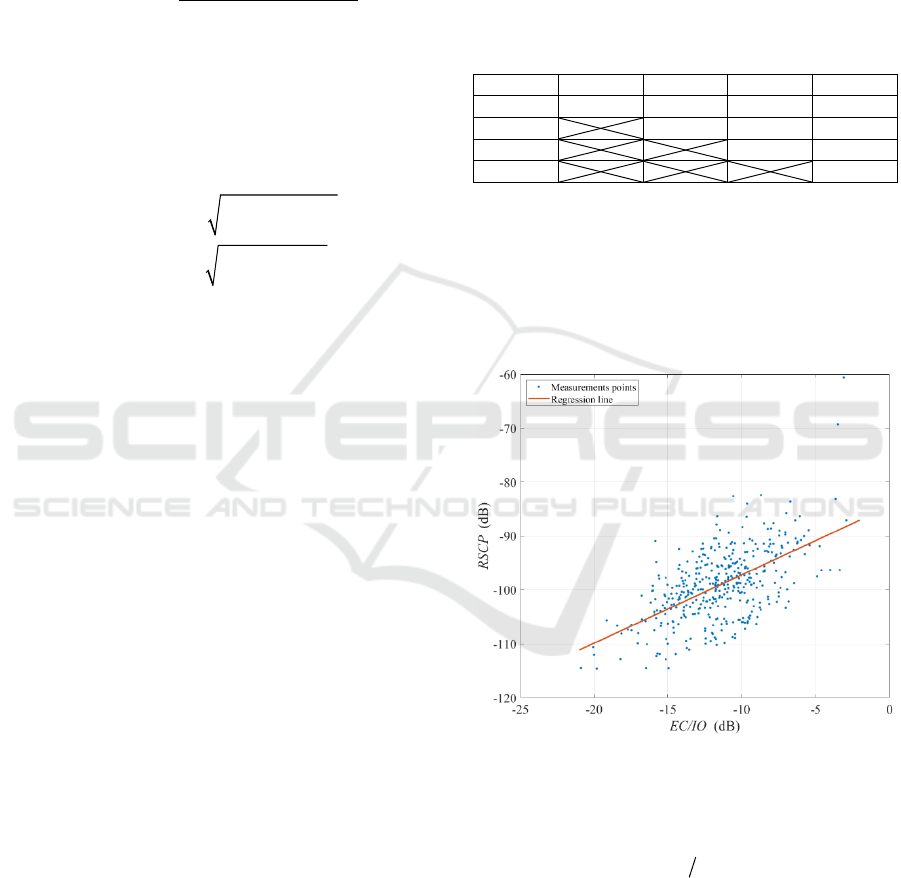
Table 1: PCCs between QoS metrics for MNO#1-UMTS.
Metric RSCP EC/IO AR VMOS
RSCP 1.000 0.580 0.242 0.148
EC/IO 1.000 0.395 0.243
AR 1.000 0.546
VMOS 1.000
The obtained results show a significant
correlation between RSCP and EC/IO (PCC = 0.58)
and also between VMOS and AR (PCC = 0.546). For
these parameter pairs, the measurement results are
illustrated in the graphs in Figures 3 and 4,
respectively. In addition, linear regressions have been
determined, which are marked in red.
Figure 3: RSCP versus EC/IO for MNO#1-UMTS.
The following equation describes regression line
between RSCP and EC/IO:
dB 1.267 dB 84.5 dBRSCP EC IO
(3
)
The spread of the empirical RSCP values in
relation to the value determined by the line is defined
by the standard deviation, which is
5.4 dB
RSCP
.
QQSS 2022 - Special Session on Quality of Service and Quality of Experience in Systems and Services
500
Figure 4: VMOS versus AR for MNO#1-UMTS.
In the case of the relationship between VMOS and
AR for MNO#1-UMTS, the regression line
is defined as
0.0017 p 2.5VMOS AR
.
(4)
In this case, the deviation of the VMOS results is
equal to
0.5
VMOS
.
Table 2 shows the results of the correlation
analysis for MNO#1-LTE. In the case of LTE
technology, RSRP and SINR were determined
instead of the RSCP and EC/IO metrics, respectively.
Table 2: PCCs between QoS metrics for MNO#1-LTE.
Metric RSRP SINR AR VMOS
RSRP 1.000 0.647 0.369 0.269
SINR 1.000 0.405 0.298
AR 1.000 0.637
VMOS 1.000
The obtained results show that for MNO#1-LTE,
analogously to MNO#1-UMTS, signal parameters
(i.e., quality – SINR and power – RSRP) and quality
video (i.e., AR and VMOS) are correlated with each
other (i.e., PCC > 0.5). These parameters are
illustrated in Figures 5 and 6, respectively.
The regression line between RSRP and SINR for
MNO#1-LTE is given by the equation:
dB 0.776 dB 106.5 dBRSRP SINR
(5)
In this case, the standard deviation of RSRP
relative to the regression line is
7.0 dB
RSRP
.
Figure 5: RSRP versus SINR for MNO#1-LTE.
Figure 6: VMOS versus AR for MNO#1-LTE.
The regression line for AR and VMOS metrics
and MNO#1-LTE is as follows:
0.0017 p 2.5VMOS AR
(6)
and the deviation of VMOS is equal to 0.4
VMOS
.
An analogous analysis of measurement data was
performed for the MNO#2-LTE set. PCCs are shown
in Table 3 and in Figures 7 and 8 for RSRP(SINR)
and VMOS(AR), respectively.
The obtained results indicate the correlation
between SINR and RSRP parameters and a slightly
lower correlation between AR and VMOS (i.e., PCC
= 0.446) than in the case of MNO#1-LTE.
Drive Test-based Correlation Assessment of QoS Parameters for Exemplary Measurements Scenario in Suburban Environment
501
Table 3: PCCs between QoS metrics for MNO#2-LTE.
Metric RSRP SINR AR VMOS
RSRP 1.000 0.657 0.228 0.157
SINR 1.000 0.246 0.156
AR 1.000 0.446
VMOS 1.000
Figure 7: RSRP versus SINR for MNO#2-LTE.
Figure 8: VMOS versus AR for MNO#2-LTE.
The regression line between RSRP and SINR for
MNO#2-LTE is as follows:
dB 0.728 dB 105.0 dBRSRP SINR
(7)
and the RSRP deviation is 6.5 dB
RSRP
.
For MNO#2-LTE, the regression line between
VMOS and AR is described by the formula:
0.0012 p 3.0VMOS AR
.
(8)
In this case, the standard deviation of VMOS is
0.3
VMOS
.
Based on the obtained results, we can see that the
signal parameters represent power (i.e., RSCP and
RSRP for UMTS and LTE, respectively) and quality
(i.e., EC/IO and SINR for UMTS and LTE,
respectively) are strongly correlated with each other.
For the three analyzed data sets, there are PCC > 0.5.
Therefore, regression lines could be derived for these
QoS metrics. It is worth noting that the deviation of
the results of the parameter representing the signal
strength (i.e., RSCP or RSRP) is about 10% of its
variability range, e.g., for MNO#1-LTE,
7.0 dB
RSRP
, while the RSRP varied from
128.6 dBm
to
58.6 dBm
, which gives a change
range of
70 dB
. Thus, the regression line describes
the relationship between these QoS metrics relatively
well. The obtained equations can be used to determine
the power parameter based on the signal quality
parameter using the normal distribution with an
appropriate standard deviation.
For the video quality parameters, PCC > 0.5 is for
the two sets, i.e., MNO#1-UMTS and MNO#1-LTE,
while for MNO#2-LTE, PCC was slightly below 0.5.
In these cases, the regression lines were also
determined. For MNO#1-UMST and MNO#1-LTE,
line equations are described with identical
coefficients. The difference is for the VMOS standard
deviation values – for UMTS, it is slightly greater
than for LTE. In the case of MNO#2-LTE, the
regression line coefficients are slightly different to
MNO#1-LTE, while VMOS deviation is the smallest.
The obtained regression lines make it possible to
determine the approximate or model VMOS value
based on the average resolution adjusted to the
current link throughput in the radio channel.
Moreover, the results obtained in the tables show
a specific correlation between AR and the radio signal
parameters at the level of 0.22 < PCC < 0.41.
Therefore, the regression lines for such cases may
allow the estimation of AR values based on the signal
parameter (e.g., SINR or RSRP) measurements or
vice versa, which may find practical application.
3.4 Impact of Velocity on QoS
Parameters
Figure 9 shows the velocity distribution for the three
analyzed data sets. We can see that measurements in
suburban areas were usually carried out at speeds
below 40 km/h, while driving at speeds above 50
km/h took place outside the built-up area.
QQSS 2022 - Special Session on Quality of Service and Quality of Experience in Systems and Services
502
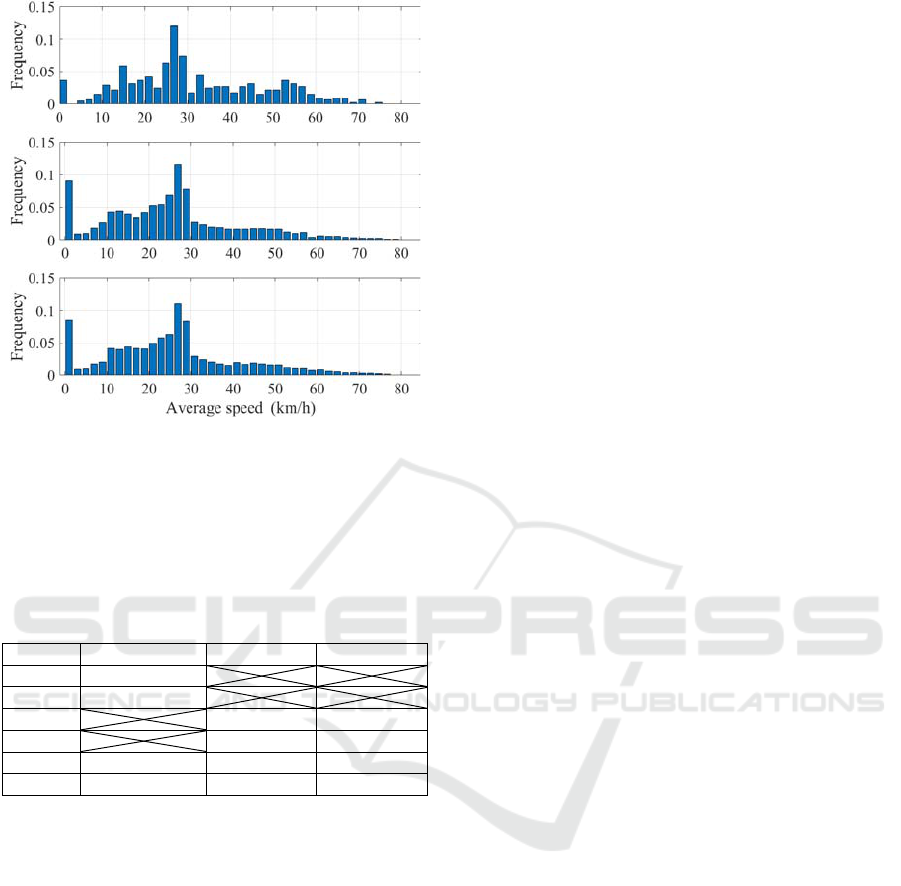
Figure 9: Average speed distribution for (a) MNO#1-
UMTS, (b) MNO#1-LTE, and (c) MNO#2-LTE.
In the conducted analysis, we decided to check
whether there is a correlation between the average
vehicle speed and the QoS metrics. The determined
PCCs are included in Table 4.
Table 4: PCCs between QoS metrics and average speed.
Metrics
MNO#1-UMTS MNO#1-LTE MNO#2-LTE
RSCP 0.014
EC/IO 0.031
RSRP 0.069
–
0.004
SINR
–
0.001 0.018
AR 0.046
–
0.021
–
0.039
VMOS 0.068
–
0.026
–
0.030
The obtained results indicate a negligible influence of
speed on the analyzed QoS metrics. The practice of
using data transmission in mobile networks while
traveling by vehicles (e.g., car, train, etc.) shows that
at high speeds, the use of this service type is
problematic. On the other hand, the obtained results
do not indicate a significant impact of speed on the
QoS. Thus, we conclude that the vehicle speed may
have a more substantial effect on session breakup
during video transmission or reconnection between
the mobile terminal and base station. In this paper, we
do not analyze the dataset that was qualified as
‘Failed’ (only ‘Qualified’ data was analyzed).
4 CONCLUSIONS
In this paper, we have presented a correlation analysis
of QoS metrics determined in the measurement
campaign near Warsaw for two MNOs. The study
considered a scenario with the YouTube live-stream
service. The determined PCCs for the parameter pairs
indicated a strong relationship between the signal
parameters – radio signal power and quality, and
between the video quality metrics, i.e., AR and
VMOS. Regression lines for these pairs and metrics
deviations were determined. We also assessed the
impact of car speed on the QoS metrics. In this case,
the obtained PCC values do not show a strong
correlation between them.
It is worth noting that the percentage of
measurements considered for analysis for LTE was
about 90%, while for UMTS is only about 60% (see
Section 3.2). In the UMTS case, the rejection of a
significant amount of data may result from the fact
that older generation solutions (UMTS) cope worse
than LTE technology with user mobility (i.e., Doppler
effect mitigation), ensuring continuity of broadband
transmission, especially when user handover between
the next base stations. Hence, the trend, noticeable in
numerous MNOs, consisting of the 3G technology
abandonment and the use of its spectral resources in
favor of efficient 4G and 5G seems to be justified. On
the other hand, the smaller number of measurement
data used for the UMTS correlation analysis should
insignificantly affect the reliability of the obtained
results, which are close to the LTE results.
In the near future, the authors are planning to
analyze other scenarios carried out in the
measurement campaign and assess the possible
influence of vehicle speed on session interruption.
The obtained results of the analysis will be used in the
method of assessing mobile networks in terms of
QoS/QoE performance assessment developed by the
authors (Zmysłowski & Kelner, 2022).
ACKNOWLEDGEMENTS
This work was financed by the Military University of
Technology under Research Project no. UGB/22-
740/2022/WAT on “Modern technologies of wireless
communication and emitter localization in various
system applications”.
The authors would like to thank the President of
UKE, Dr. Jacek Oko, for providing the measurement
data made by the Systemics-PAB Group company,
which implemented QoS assessment campaigns in
mobile networks on behalf of UKE.
Drive Test-based Correlation Assessment of QoS Parameters for Exemplary Measurements Scenario in Suburban Environment
503

REFERENCES
Afroz, F., Subramanian, R., Heidary, R., Sandrasegaran, K.,
& Ahmed, S. (2015). SINR, RSRP, RSSI and RSRQ
measurements in long term evolution networks.
International Journal of Wireless & Mobile Networks,
7(4), 113–123.
Ahmad, N., Wahab, A., & Schormans, J. (2020).
Importance of cross-correlation of QoS metrics in
network emulators to evaluate QoE of video streaming
applications. In 2020 11th International Conference on
Network of the Future (NoF), 43–47. https://doi.org/
10.1109/NoF50125.2020.9249129
Bae, J., Park, H.-S., Chin, Y. M., & Park, H.-C. (2009). An
identification of correlation between network QoS and
video quality index for IPTV service. In 2009 11th
International Conference on Advanced Communication
Technology (ICACT), 02, 1399–1402.
Chervenets, V., Romanchuk, V., Beshley, H., & Khudyy,
A. (2016). QoS/QoE correlation modified model for
QoE evaluation on video service. In 2016 13th
International Conference on Modern Problems of
Radio Engineering, Telecommunications and
Computer Science (TCSET), 664–666. https://doi.org/
10.1109/TCSET.2016.7452146
Deng, S., Wu, H., Hu, D., & Leon Zhao, J. (2016). Service
selection for composition with QoS correlations. IEEE
Transactions on Services Computing, 9(2), 291–303.
https://doi.org/10.1109/TSC.2014.2361138
Falkowski-Gilski, P., & Uhl, T. (2020). Study of cellular
network quality on the eve of 5G technology on a
selected example [in Polish: Badanie jakości sieci
komórkowych w przededniu technologii 5G na
wybranym przykładzie]. Telecommunication Review
and Telecommunication News, 93(7–8), 338–341.
https://doi.org/10.15199/59.2020.7-8.45
Jurgelionis, A., Laulajainen, J.-P., Hirvonen, M., & Wang,
A. I. (2011). An empirical study of NetEm network
emulation functionalities. In 2011 20th International
Conference on Computer Communications and
Networks (ICCCN), 1–6. https://doi.org/10.1109/
ICCCN.2011.6005933
Kim, H. J., & Choi, S. G. (2010). A study on a QoS/QoE
correlation model for QoE evaluation on IPTV service.
In 2010 12th International Conference on Advanced
Communication Technology (ICACT), 2, 1377–1382.
Kruszewski, R., & Malinowski, J. (2022). UKE Poland
measurement specification (1.7). Systemics-PAB Sp. z
o.o. for Office of Electronic Communications.
Li, D., Ye, D., Gao, N., & Wang, S. (2019). Service
selection with QoS correlations in distributed service-
based systems. IEEE Access, 7, 88718–88732.
https://doi.org/10.1109/ACCESS.2019.2926127
Lloyd-Evans, R. (2002). QoS in integrated 3G networks.
Artech House Publishers.
Oodan, A., Ward, K., Savolaine, C., Daneshmand, M., &
Hoath, P. (2002). Telecommunications quality of
service management: From legacy to emerging
services. The Institution of Engineering and
Technology.
Razeghi, M. (2007). End-to-end quality of service over
cellular networks: Data services performance
optimization in 2G/3G (G. Gomez & R. Sanchez, Eds.).
John Wiley & Sons.
R&S. (2016). Benchmarker II takes off into the Polish
telecommunications market (PD 5214.6774.32). Rohde
& Schwarz.
Schwarzinger, A. (2013). Digital signal processing in
modern communication systems. Andreas Schwarzinger.
Sliwinski, J., Beben, A., & Krawiec, P. (2010). EmPath:
Tool to emulate packet transfer characteristics in IP
network. In F. Ricciato, M. Mellia, & E. Biersack
(Eds.), In 2010 International Workshop on Traffic
Monitoring and Analysis (TMA) (pp. 46–58). Springer.
https://doi.org/10.1007/978-3-642-12365-8_4
Wang, Y., He, Q., Ye, D., & Yang, Y. (2017). Service
selection based on correlated QoS requirements. In
2017 IEEE International Conference on Services
Computing (SCC), 241–248. https://doi.org/10.1109/
SCC.2017.38
YouTube. (2021). https://www.youtube.com/
Yu, J., Lin, Z., Yu, Q., & Xiao, X. (2021). QoS correlation-
based service composition algorithm for multi-
constraint optimal path. In 2021 11th International
Conference on Information Technology in Medicine
and Education (ITME), 117–121. https://doi.org/
10.1109/ITME53901.2021.00034
Ziółkowski, C., & Kelner, J. M. (2016). Influence of
receiver/transmitter motion direction on the
correlational and spectral signal properties. In 2016
10th European Conference on Antennas and
Propagation (EuCAP), 1–4. https://doi.org/10.1109/
EuCAP.2016.7481225
Zmysłowski, D., & Kelner J. M. (2022) The concept of
application of the Wroclaw taxonomy for QoS
assessment in mobile networks. In 2022 18th
International Conference on Web Information Systems
and Technologies (WEBIST), Special Session on
Quality of Service and Quality of Experience in Systems
and Services (QQSS).
QQSS 2022 - Special Session on Quality of Service and Quality of Experience in Systems and Services
504
