
Remote Assessment of Soil Temperature on the Example of a Carbon
Landfill Site of the Republic of Bashkortostan (Yangan-Tau
Geopark)
Ekaterina Bogdan
1,2 a
, Alexander Volkov
1,3 b
, Larisa Belan
1,2 c
,
Rita Kamalova
1,2 d
and Iren Tuktarova
1e
1
Ufa State Petroleum Technological University, Ufa, Russia
2
Bashkir State University, Ufa, Russia
3
Vector LLC, Ufa, Russia
Keywords: Soil temperature, thermodynamic temperature, data loggers, Landsat, Semi-automatic classification plugin,
Yangan-Tau Geopark.
Abstract: The article discusses approaches to remote assessment of the Earth's surface temperature (on the example of
the territory of the Yangan-Tau geopark, Republic of Bashkortostan, Russia). The relevance of remote
assessment of soil temperature is confirmed by studies demonstrating the high ecosystem role of this indicator.
The comparison of mathematical calculations of thermodynamic temperature and data generated by the Semi-
automatic classification plugin module of the Q-GIS program is carried out. The interrelations between the
results of ground-based studies of soil temperature obtained using data loggers and data from the thermal
channels of the Landsat 8 satellite are evaluated. The absence of a relationship between data loggers and
satellite imagery data in winter is determined, which is explained by the presence of snow cover. The greatest
correlation was found in the autumn period. A regression analysis was carried out, on the basis of which a
model of the relationship between data from Landsat 8 satellite images and the results of measurements by
data loggers of soil temperature was formed.
1 INTRODUCTION
Many studies show a significant influence of soil
temperature on ecosystem processes. In particular,
the impact of extreme soil temperature events can
affect the levels of biological organization (Jentsch,
Beierkuhnlein, 2008; Larjavaara et al., 2021) and
interact with other driving climatic variables,
changing the range and stability of many ecosystems
(Thuiller et al., 2008). The influence of temperature
on microbiological activity, nutrient mineralization
and soil respiration is noted (Yuste et al., 2007;
Hamdi et al., 2013), including short-term (12 hours)
near-surface extremes of soil temperature - 30-35°C
(Yuste et al., 2007), as well as soil warming from 15
a
https://orcid.org/0000-0003-0566-2639
b
https://orcid.org/0000-0001-5691-6438
c
https://orcid.org/0000-0003-3098-7881
d
https://orcid.org/0000-0002-8964-7622
e
https://orcid.org/0000-0003-4731-1394
up to 25°C (Kravchenko et al., 2019) significantly
reduce microbial activity and soil respiration in
ecosystems.
Thus, monitoring the temperature regime of the
soil cover is one of the necessary conditions for
measures to adapt to climate change and prepare
forecasts of the dynamics of vegetation productivity.
Convenience and efficiency are demonstrated by
remote methods for estimating the temperature of the
Earth's surface using Landsat satellite data. In their
study (El Garouani et al., 2021) showed that the
surface temperature has a high correlation with the air
temperature and differs only by a few degrees. In the
work (Mamash et al., 2021) for the city of
Novosibirsk, data obtained at meteorological stations
and from Landsat satellites were compared. The
Bogdan, E., Volkov, A., Belan, L., Kamalova, R. and Tuktarova, I.
Remote Assessment of Soil Temperature on the Example of a Carbon Landfill Site of the Republic of Bashkortostan (Yangan-Tau Geopark).
DOI: 10.5220/0011568800003524
In Proceedings of the 1st International Conference on Methods, Models, Technologies for Sustainable Development (MMTGE 2022) - Agroclimatic Projects and Carbon Neutrality, pages
215-221
ISBN: 978-989-758-608-8
Copyright
c
2023 by SCITEPRESS – Science and Technology Publications, Lda. Under CC license (CC BY-NC-ND 4.0)
215
standard deviation between the temperature values
ranged from 0.5 to 1.9°C. For the Republic of Tyva,
according to the Landsat 8 satellite, in the winter of
2014-2017, the value of the surface temperature
differs from the air temperature by an average of – 1.9
°C (Kuular, 2018).
2 MATERIALS AND METHODS
The research is carried out on the territory of the
Yangan-Tau UNESCO global geopark. One of the
key positions in the geopark's activities is the
implementation of Sustainable Development Goal
No. 13 "Taking urgent measures to combat climate
change and its consequences". In 2021, the geopark
entered the program of the carbon landfill of the
Republic of Bashkortostan, as one of the sites.
To identify current climatic trends occurring in
the territory of the Yangan-Tau Geopark, we
analyzed data from long-term observations of the
Duvan meteorological station in the period 1966-
2019. The basic characteristics of climatic values
were calculated: average (climatic norms of 1966-
2019 and 1981-2010), standard deviation for
temperature and coefficient of variation for
precipitation, anomalies of values (the basic norm of
the period 1981-2010 was used in the calculations).
The assessment of regional climate changes was
obtained using trend analysis. The angular coefficient
of the slope of the trend line is characterized by the
rate of change of the value, and the positive sign of
the coefficient indicates an increase in the value of a
quantity, the negative sign indicates its decrease. The
value of the determination coefficient was used to
assess the contribution of the linear trend to the
overall variability of the indicator and its statistical
significance (Kamalova et al., 2021).
A time analysis of the thermal regime revealed
that in almost all months there is an increase in air
temperature. Statistically significant trends were
found in January, October and for the year, as well as
in March of the period 1981-2010.
The increase in air temperature also confirms the
long-term course of its anomalies. Their distribution
shows that the frequency of warm years has been
increasing since the early 2000s. Changes are
observed not only in the thermal regime of the air, but
also in the moisture regime. Trend analysis shows that
the annual precipitation tends to increase in the period
1966-2019 (12 mm/10 years). At the same time,
considering the period of the basic norm of 1981-
2010, the opposite trend is found – a decrease in the
amount of precipitation at a rate of -11.6 mm/10
years. In general, the greatest contribution to this
trend is made by the trendline slope coefficient of the
amount of precipitation of the warm period (-24.6
mm/10 years). The amount of precipitation during the
cold period has positive statistically significant trends
(21.6 mm/10 years). The revealed trends of the main
climatic indicators collectively affect changes in the
hydrothermal conditions of the geopark territory. One
of the widely used indicators is the aridity index of D.
A. Pedya (Perevedentsev et al., 2011). In the work
(Kamalova et al., 2021), it was found that the long-
term dynamics of the aridity index shows a tendency
to increase (0.26 units/10 years). Thus, summer
conditions shift towards greater aridity, which, in
turn, affects the hydrothermal conditions of the soil.
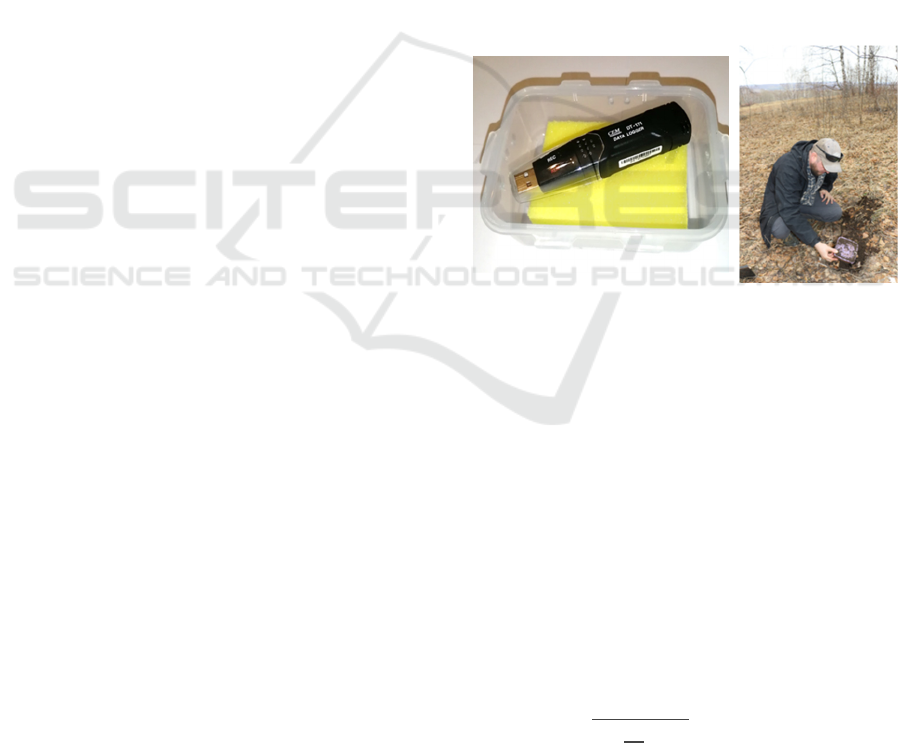
Ground-based studies were conducted using
CEM-DT-171, Testo and VerigoPod temperature and
humidity data loggers. Packed in a container, the data
logger got into the soil to a depth of 15-20 cm (Figure
1).
Figure 1: Placement of data loggers at the research site in
the Yangan-Tau UNESCO global Geopark.
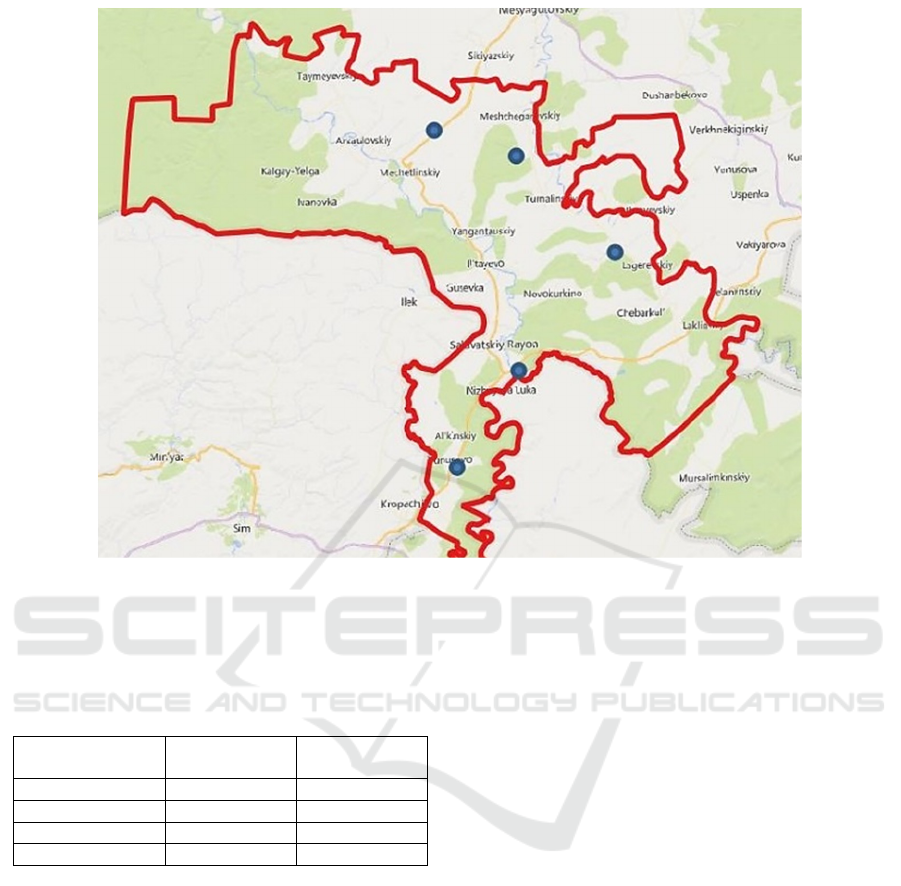
5 sites were selected on the territory of the
geopark, where data loggers were placed (Figure 2).
2 data loggers of different brands were placed on
each site to adjust the results. Studies have not shown
significant discrepancies in the measurement results
of data loggers from different manufacturers. The
study began in November 2020. Every six months,
data is read from data loggers and batteries are
replaced.
Remote methods. The basis for remote analysis
was Landsat 8 images, including thermal channels
B10 (10.60-11.19 microns) and B11 (11.50-12.51
microns). To obtain data on the thermodynamic
temperature, Formula 1 was used:
𝑇=
𝐾
𝑙𝑛
𝐾
𝑅
+1
273,15
(1)
MMTGE 2022 - I International Conference "Methods, models, technologies for sustainable development: agroclimatic projects and carbon
neutrality", Kadyrov Chechen State University Chechen Republic, Grozny, st. Sher
216
where T is the thermodynamic temperature, ˚C; K
1
and K
2
are calibration constants, the values of which
are presented in Table 1.
Table 1: Calibration coefficients for Landsat 8 images.
Calibration
coefficient
Channel B10 Channel B11
K
1
774.9 480.9
K
2
1321.1 1201.1
M
R
3,3420E-0,4 3,3420E-0,4
A
R
0.1 0.1
Further, according to the Formula (2), the R –
intensity of the radiation of the object is calculated:
𝑅=𝑀
∗𝑄+
𝐴
(2)
where M
R
and A
R
are the calibration coefficients, the
value of which is shown in Table 1; Q is the discrete
calibrated pixel value.
The value of the calibration coefficients is
presented in a meta-data file named "*_mtl.txt ",
included in the snapshot archive.
16 cloudless images were selected for analysis in
the period from November 2020 to November 2021.
For the pixels corresponding to the location of the
data loggers, the thermodynamic temperature values
were calculated based on the formulas presented
above. At the same time, the Q-GIS program has a
module for semi-automatic classification of the
Earth's surface (Semi-Automatic Classification
Plugin), which automatically recalculates the
thermodynamic temperature. A comparison of the
results obtained by calculation and the results
obtained using the semi-automatic classification
module showed their identity (Figure 3).
The correlation coefficient R for both channels
was 0.99, R
2
was 0.99, and the standard error was
0.55.
The temperature values determined by channels
B10 and B11 (they differ in the covered intervals of
the thermal range) of Landsat 8 differ from each other
by 1.5-3 °C. In a number of publications, they are
offered to average
(Silkin, 2015).
3 RESULTS AND DISCUSSION
A regression analysis was carried out based on the
data obtained from the images and data loggers. Both
the entire range of annual results and seasonal results
are analyzed. As can be seen in Figure 4 and Table 2,
a correlation is observed during the year between the
results obtained by ground measurements and data
from Landsat 8 images.
Figure 2: Locations of data loggers on the territory of the Yangan-Tau UNESCO global Geopark.
Remote Assessment of Soil Temperature on the Example of a Carbon Landfill Site of the Republic of Bashkortostan (Yangan-Tau Geopark)
217
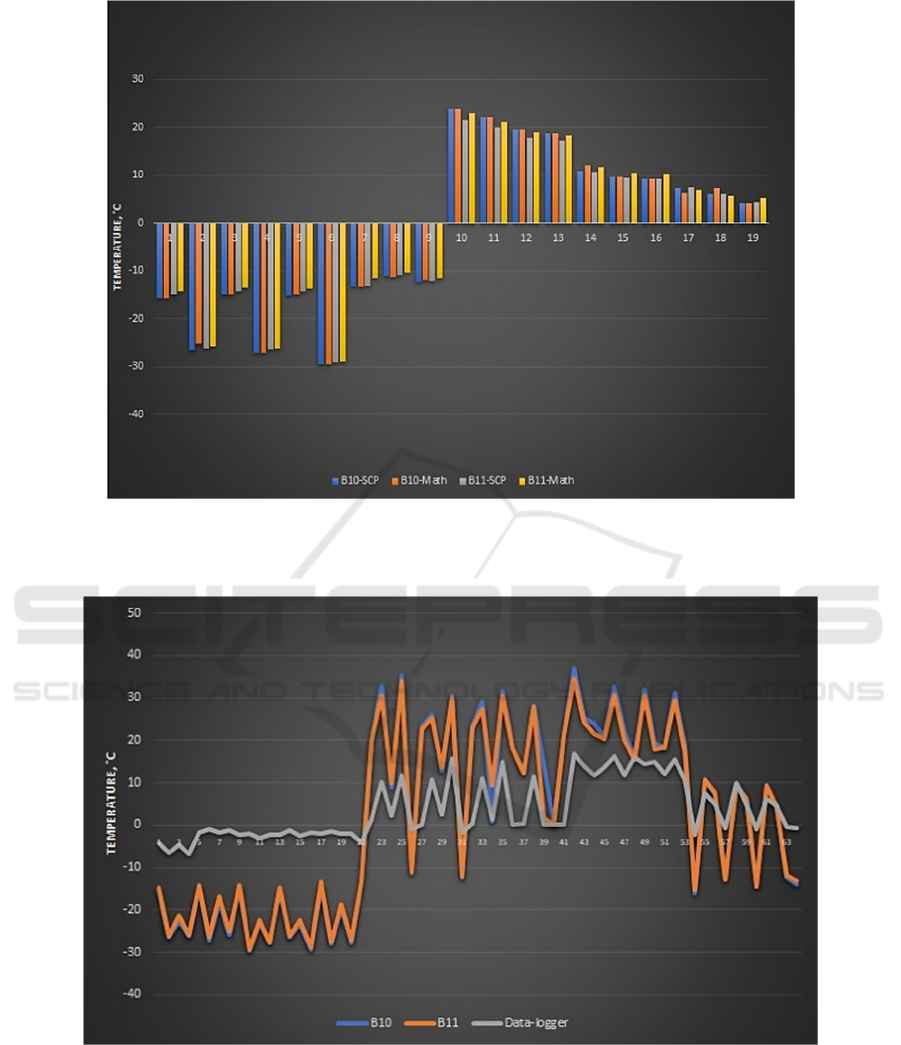
Figure 3: Comparison of calculation results and processing data in the Semi-Automatic Classification Plugin module, where
B10-SCP and B11SCP are data obtained by processing in the Semi-Automatic Classification Plugin module for channels B10
and B11; B10-Math and B11-Math are data obtained by mathematical calculations.
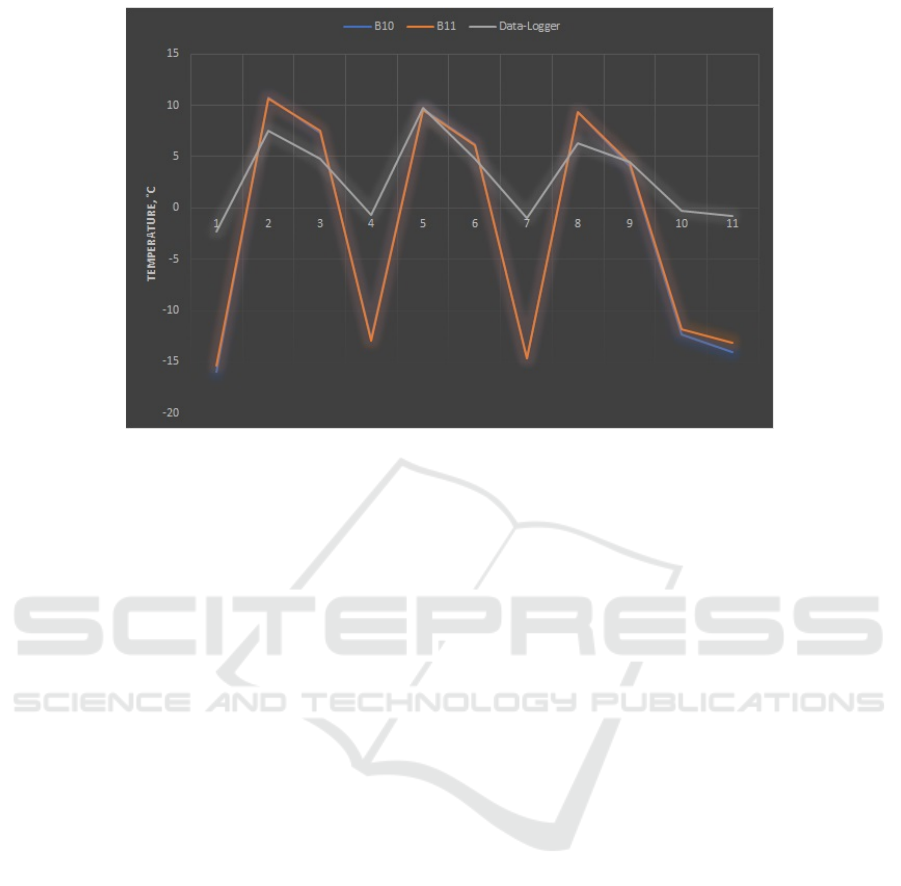
Figure 4: Temperature values from data loggers and Landsat 8 images.
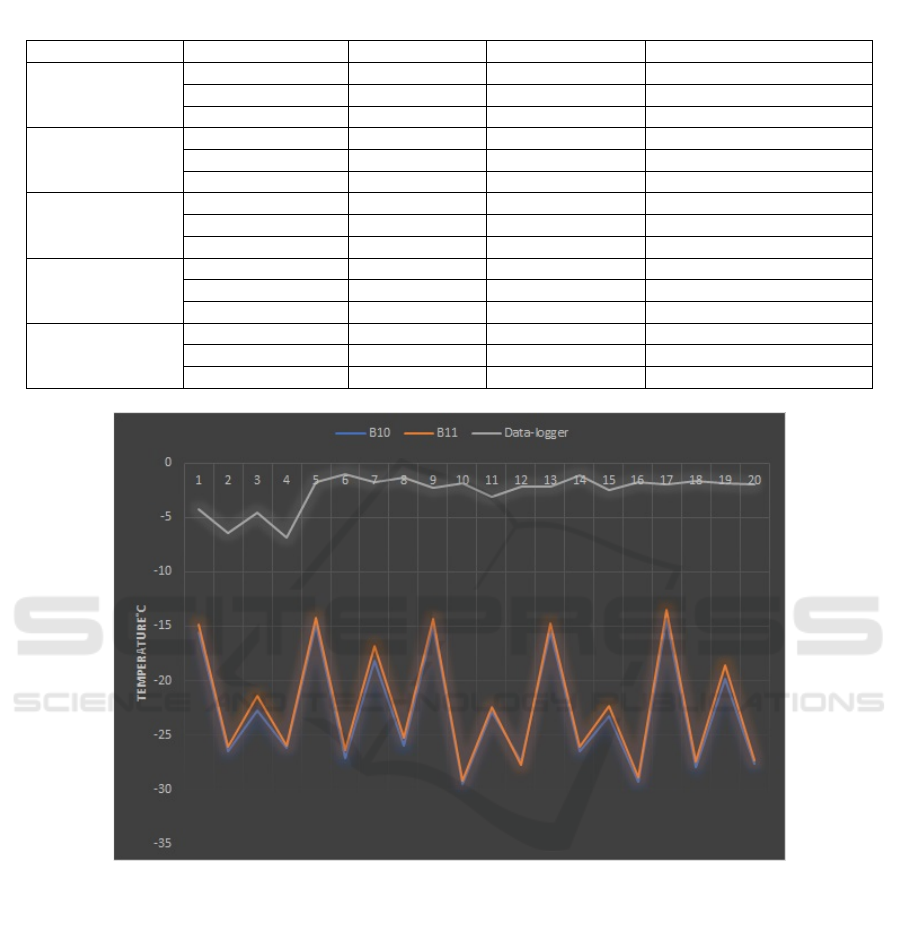
At the same time, the analysis of seasonal data
showed that there is no relationship between logger
data and winter images (Figure 5), which is explained
by the presence of snow cover (Table 2). The greatest
correlation was observed in the autumn period
(Figure 6).
As can be seen from Table 2, there are no
significant differences in the correlation relationships
between the results of ground measurements and the
data of channels B10, B11 and their average values.
In further studies, we used the average value of these
channels B10 and B11.
MMTGE 2022 - I International Conference "Methods, models, technologies for sustainable development: agroclimatic projects and carbon
neutrality", Kadyrov Chechen State University Chechen Republic, Grozny, st. Sher
218
Based on the data obtained, a linear predictive
model of the relationship between data from Landsat
8 satellite images and the results of measurements by
data loggers of soil temperature (Formula 3) is
formulated:
𝑇
= 3,06 + 0,28𝑇
(3)
where T
soil
is the soil temperature; T
image
is the value
of the thermodynamic temperature obtained from
Landsat 8 images.
More accurate values can be obtained in the
autumn period using other values of correction
coefficients (Formula 4):
𝑇
= 3,60 + 0,35𝑇
(4)
4 CONCLUSIONS
1. To obtain the values of the thermodynamic
surface temperature, you can use the Semi-
automatic classification plugin of the QGIS
program.
2. The use of satellite data for the winter period to
assess soil temperature is not advisable,
because snow cover has a significant impact on
the temperature regime of the soil.
3. The greatest correlation between the satellite
survey data and the results of ground
Table 2: Relationships between ground-based research results and satellite data.
Perio
d
Indicato
r
R R
2
Standard erro
r
Year
B10 0.84 0.71 3.80
B11 0.84 0.70 3.80
AVG 0.84 0.71 3.80
Winter
B10 0.02 4,00E-04 1.68
B11 0.02 4,00E-04 1.68
AVG 0.02 4,00E-04 1.68
Spring
B10 0.76 0.58 4.10
B11 0.77 0.59 4.00
AVG 0.77 0.59 4.00
Summer
B10 0.55 0.31 1.77
B11 0.57 0.33 1.75
AVG 0.57 0.32 1.76
Autumn
B10 0.96 0.93 1.15
B11 0.96 0.92 1.18
AVG 0.96 0.93 1.16
Figure 5: Temperature values from data loggers and Landsat 8 images in winter.
Remote Assessment of Soil Temperature on the Example of a Carbon Landfill Site of the Republic of Bashkortostan (Yangan-Tau Geopark)
219
measurements is observed in the autumn
period.
4. Remote data can be obtained as a result of
processing channels B10, B11 or their average
value. There are no differences in the
relationship with ground data.
ACKNOWLEDGEMENTS
The research was started with the assistance of the
Russian Geographical Society, continued with the
support of a grant from the Republic of
Bashkortostan, the internal cipher of the scientific
topic is ENOC–GVU-01-22.
REFERENCES
Jentsch, A., Beierkuhnlein, C., 2008. Research frontiers in
climate change: Effects of extreme meteorological
events on ecosystems. Geoscience. 340. 9-10. pp. 621-
628.
Larjavaara, M., Lu, X., Chen, X., Vastaranta, M., 2021.
Impact of rising temperatures on the biomass of humid
old ‑ growth forests of the world. Carbon Balance and
Management. Springer International Publishing. 31, 16.
pp. 1-9.
Thuiller, W. Albert, C., Araujo, M., Berry, P., Cabeza, M.,
Guisan, A., Hickler, T., Midgely, G., Paterson, J.,
Schurr, F., Sykes, M., Zimmermann, N., 2008.
Predicting global change impacts on plant species’
distributions: future challenges. Perspectives in Plant
Ecology, Evolution and Systematics. 9, 3-4. pp. 137-
152.
Yuste, J., Baldocchi, D., Gershenson, A., Goldstein, A.,
Misson, L., Wong, S., 2007. Microbial soil respiration
and its dependency on carbon inputs, soil temperature
and moisture. Global Change Biology. 13. pp. 2018-
2035.
Hamdi, S., Moyano, F., Sall, S., Bernoux, M., Chevallier,
T., 2013. Synthesis analysis of the temperature
sensitivity of soil respiration from laboratory studies in
relation to incubation methods and soil conditions. Soil
Biology and Biochemistry. 58. pp. 115-126.
Kravchenko, I. K., Tikhonova, E. N., Ulanova, R. V.,
Menko, E. V., Sukhacheva, M. V., 2019. Effect of
temperature on litter decomposition, soil microbial
community structure and biomass in a mixed-wood
forest in European Russia. Current Science. 116, 5. pp.
765-772.
El Garouani, M., Amyay, Mh., Lahrach, A., Oulidi, H. J.,
2021. Land Surface Temperature in Response to Land
Use/Cover Change Based on Remote Sensing Data and
GIS Techniques: Application to Saïss Plain, Morocco.
Journal of Ecological Engineering. 22, 7. pp. 100-112.
Mamash, E. A., Pestunov, I. A., Chubarov, D. L., 2021.
Construction of temperature maps of the city of
Novosibirsk based on Landsat 8 satellite data. Interexpo
Geo-Siberia. 4, 1. pp. 52-59.
Kuular, H. B., 2018. The temperature of the landscape
surface of the Republic of Tyva according to the
Landsat-8 satellite in winter 2014-2017. Modern
problems of remote sensing of the Earth from space. 15.
7. pp. 67-77.
Kamalova, R. G., Belan, L. N., Bogdan, E. A., 2021. The
climate of the Yangan-Tau Geopark and its modern
changes. Dynamics and interaction of the Earth's
geospheres. II. pp. 134-137.
Figure 6: Temperature values from data loggers and Landsat 8 images in autumn.
MMTGE 2022 - I International Conference "Methods, models, technologies for sustainable development: agroclimatic projects and carbon
neutrality", Kadyrov Chechen State University Chechen Republic, Grozny, st. Sher
220

Perevedentsev, Yu. P., Vereshchagin, M. A., Shantalinsky,
K. M., Naumov, E. P., Khabutdinov, Yu. G., 2011.
Changes in climatic conditions and resources of the
Middle Volga region: a textbook on regional
climatology. p. 296.
Silkin, K., 2015. Correction of Landsat materials. p. 5
https://gis-lab.info/qa/landsat-data-correction.html.
Remote Assessment of Soil Temperature on the Example of a Carbon Landfill Site of the Republic of Bashkortostan (Yangan-Tau Geopark)
221
