
Assessment of Innovation Activity in the Field of Environmental
Protection in Russia and the EU Countries
B. A. Demilkhanova
Chechen State University Named After A.A. Kadyrov, Grozny, Russia
Keywords: Responsible investments, sustainable assets, environmental innovations, indicator, innovation activity,
assessment, correlation.
Abstract: The ecological component of technological innovations is the subject of the article. The purpose of the article
was to assess innovation activity in the field of environmental protection in Russia and the EU countries and
to establish a close correlation between indicators of innovation activity in production and implementation
activities and the use of financial potential for environmental innovations and a generalizing indicator
reflecting the level of activity in the implementation of environmental innovations by industrial companies.
This assessment is limited by the lack of a sufficient array of comparable statistical data in the country context
and in the context of industries. As a result of the conducted research, those countries that are characterized
by a pronounced correlation between the considered factor indicators have been identified. The level of
innovation activity in all countries is close to the average level, relative to which there is either a moderate
increase or a moderate decrease in innovation activity. A more specific assessment is possible provided that
there are comparable data from Russian and international statistics on the sources of financing environmental
innovations in various industries, special costs associated with environmental innovations and the results of
joint innovation activities in this area between countries.
1 INTRODUCTION
On a global scale, the developing modern industry
and human life have faced the same global problems
associated with the unreasonable use, exploitation
and overloading of the nature around us: the growth
of waste requiring disposal, emissions of harmful
substances into the atmosphere, immeasurable
consumption of energy and resources, and much
more. Modern challenges put forward great demands
for responsible business conduct (Alexandrov, 2020;
ESG Investment Market in Russia, www.rshb.ru/).
The urgent need for further development of society
based on reasonable production and consumption is
reflected in the global objectives for its sustainable
development, which are set in strategic documents,
programs, agreements at the international and
national levels. The whole world recognizes and
supports investment projects of states and individual
corporations aimed at obtaining, first of all, social and
environmental benefits, and gradually refuses to
invest in productions, industries or sectors of the
economy that do not comply with the norms
(standards) of responsible business. With the current
conjuncture of financial markets and the active
transformation of business models, the influence of
ESG factors will only increase (Khutorova, 2021).
Technological progress, the spread of digital
technologies, the expansion of industrial and
agricultural production cannot be regarded as positive
phenomena if they do not organically fit into the
multidimensional space of our and future societies.
Each new stage of society's progress should develop
simultaneously with the development of methods,
tools and ways of environmental protection for the
future society, ensuring environmental safety,
prevention and control of environmental pollution
(Annenskaya, 2020). Inevitably, in the current
century, technological innovations will take the
leading positions, in which there will be an
environmental component. In other words, the
development of the world economy cannot be
imagined without the introduction of environmental
protection mechanisms into production processes,
without the development and implementation (use) of
environmental innovations. Economic growth should
be balanced with environmental goals: innovation,
environment of innovation, ecological agenda and
198
Demilkhanova, B.
Assessment of Innovation Activity in the Field of Environmental Protection in Russia and the EU Countries.
DOI: 10.5220/0011568500003524
In Proceedings of the 1st International Conference on Methods, Models, Technologies for Sustainable Development (MMTGE 2022) - Agroclimatic Projects and Carbon Neutrality, pages
198-203
ISBN: 978-989-758-608-8
Copyright
c
2023 by SCITEPRESS – Science and Technology Publications, Lda. Under CC license (CC BY-NC-ND 4.0)

social progress should be closely intertwined and
support each other (Kondrashov, 2020; The New
Economy, www.oecd.org).
2 MAIN PART
The modern investment policy of both the state and
large financial and non-financial organizations is
characterized by a decrease in the volume of
investments in unsustainable and carbon-intensive
industries, in particular in the coal and oil and gas
industries, and an increase in investments in projects
aimed at preventing resource depletion, establishing
reasonable environmental management, eliminating
the toxicity of production by modifying harmful
industries, and much more. (Table 1). So, in 2020, the
volume of sustainable investment assets reached $35
trillion.
The total increase in the global volume of
sustainable investment assets amounted to USD
4.618 billion in 2018-2020. The structure of
responsible investment has changed towards a
decrease in the share of European assets from 45.9%
to 34.0%, an increase in the share of the United States
from 39.1% to 48.4% and a similar increase in the
share of Canada, Australia and Japan in the global
volume of responsible investment assets (Fig. 1, 2).
The decrease in the share of European assets by 12%
is explained by the revision of the methodology for
their assessment in 2020 in accordance with EU
legislation (Global sustainable investment review
2020, www.gsi-alliance.org/).
Private sustainable investments reached USD
13.8 trillion in 2020 (ESG Investment Market in
Russia: present and future, www.rshb.ru) and
accounted for 25% of the total global volume, 75%
accounted for assets owned by institutional investors
(Fig. 3, 4). The growth of the share of private
sustainable investments is observed on all continents:
North and South America, Western Europe, East and
Central Asia, Australia, Japan, etc.
Many studies by Russian and foreign authors have
been devoted to the interrelationships between the
factors of sustainable development and the
environmental component of technological
innovations. Based on their results, the
interrelationships between ESG issues,
environmental innovations, corporate sustainability
indicators and Sustainable Development Goals
(SDGs) have been established. In particular, it is
Table 1: Global trends in responsible investment
Organizations Measures, methods, tools, directions of ESG investments
Insurance organizations, pension funds,
private companies, major banks,
institutional investors, international
financial organizations
Investing in assets of companies with responsible business conduct;
Termination of investments in non-ecological companies (coal industry,
etc.);
reduction of the share of assets in portfolio investments that do not meet
ESG principles (reduction of the share of "brown" assets in the investment
portfolio to a certain level by the set date);
taking into account ESG factors when making investment decisions;
ESG integration: joint participation in ensuring compliance with the
business culture of companies, the introduction of technologies that
comply with the principles of responsible business conduct;
The largest banks
Creation of financial products (debt instruments, stocks, derivatives,
loans, etc.)
Refusal to lend to projects that have a negative impact on the environment
Central banks (France, the Netherlands,
etc.)
Large investments in "green" bonds, funds;
Application of financial technologies for:
1) promoting sustainable development goals and stimulating the
green finance market;
2) the exchange of reports on "green" loans between banks and
regulators;
3) facilitating investors' access to the sustainable financing market;
4) verification of data on emission reduction, verification of
greenhouse gas absorption projects, etc.;
5) ensuring disclosure of information about ESG factors in
companies' financial statements;
Assessment of Innovation Activity in the Field of Environmental Protection in Russia and the EU Countries
199
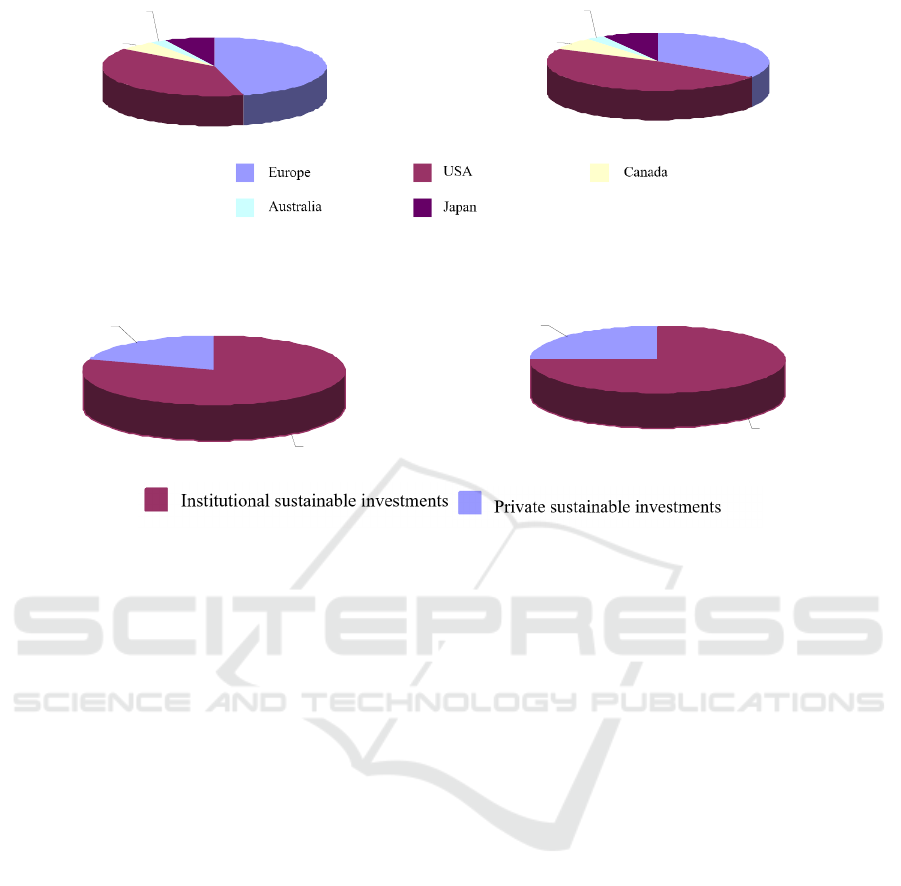
Figure 1: Structure of the global volume of sustainable
investment assets in 2018.
Figure 2: Structure of the global volume of sustainable
investment assets in 2020.
Figure 3: Structure of the global volume of sustainable
investment assets in 2016 by private and institutional
investors.
Figure 4: Structure of the global volume of sustainable
investment assets in 2018 and 2020 by private an
d
institutional investors.
concluded that an environmentally sustainable
approach to economic growth and industrial
development is provided by:
− innovations in "clean" innovations and their
spread in industries (Cheng, 2021; Stern,
2021);
− entrepreneurship at the micro level,
entrepreneurial ecosystems at the meso level
and state support for entrepreneurship at the
macro level (Shlichter, 2020; Andreas
Kuckerz, 2020);
− implementation of "green" innovations related
to a wide range of SDGs by the largest
companies (Khaled, 2021; Thijssens, 2021);
− state financing of research and development in
the field of environmental innovations, as well
as the participation of institutional investors in
financing sustainable assets through
investments in stocks and bonds of companies
that conduct responsible business (Polzin,
2021);
− by investing venture capital in environmentally
friendly companies, considered as a "... long-
term strategic tool ..." for investments in these
companies (Dong, 2021).
Meanwhile, the scientific literature does not
sufficiently cover the issues of factors that have a
direct, downright impact on the activity of industrial
companies in the implementation of environmental
innovations, which, in the framework of the article, is
understood as a created new business process (new
product) that significantly reduces the degree of
environmental pollution (air, water and land
resources, etc.).
In order to study the relationship between the
indicators of innovation activity characterizing the
scale of implementation of environmental
innovations and the volume of their financing, a
representative group of EU countries has been
identified, which in recent years have a high level of
environmental expenditures in GDP (from 0.7 to
1.7% of GDP) (in Russia – 0.9% in 2020). As
indicators of innovation activity, the following
indicators are used:
1) indicators of production and
implementation activities (PIA) (Table 2):
1.1. the share of manufacturing companies
that have achieved a reduction in environmental
pollution (Manufacturing companies that have
created a new business process - MC
b-pr.
);
1.2. the share of manufacturing companies
that have created an innovative product that has
played a significant role in improving
environmental safety when used by the consumer
45,9
39,1
5,5
2,4
7,1
34
48,4
6,9
2,6
8,1
20
80
25
75
MMTGE 2022 - I International Conference "Methods, models, technologies for sustainable development: agroclimatic projects and carbon
neutrality", Kadyrov Chechen State University Chechen Republic, Grozny, st. Sher
200

(Manufacturing companies that have created the
product - MC
pr.
).
2) the indicator of the use of the financial
potential (FP) of innovation activity in the field of
improving environmental safety is the amount of
environmental protection costs.
Based on the author's methodology described in
(Demilkhanova, 2013) and data from Russian and
foreign statistics (Indicators of innovation activity:
2015-2020, www.hse.ru; Eurostat, ec.europa.eu), the
level of innovation activity in the field of
environmental protection in Russia and the EU
countries is estimated (Table. 3) and the closeness of
the correlation between the indicators of innovation
activity in production and implementation activities
(InA
PIA
) and the use of financial potential for
environmental innovation (InA
FinP
) and a generalizing
indicator reflecting the level of activity in the
implementation of environmental innovations (InA
EnI
) (Table 4).
3 CONCLUSION
The production and implementation innovation
activity of industrial companies for the
implementation of environmental innovations in the
studied countries in 2019-2020 is characterized by a
moderate increase, with the exception of Russia,
where the level of innovation activity remained at
0.479, which means a moderate decrease relative to
the average level. The level of innovation activity on
the use of financial potential for the implementation
of environmental innovations is characterized by a
moderate increase in all countries relative to the
average value.
The study of the closeness of the correlation
between the level of innovation activity in production
and innovation activities, innovation activity in the
use of the financial potential of environmental
innovation and the generalizing indicator of
innovation activity in the field of environmental
protection shows that there is a pronounced
relationship between (Table 4):
− InA
PIA
and InA
EnI
(Russia, Malta and Czech
Republic);
− InA
FinP
and InA
EnI
(Bulgaria, Greece, Malta).
Table 2: Assessment of innovation activity in Russia and the EU countries on production and implementation activities in the
field of environmental protection in 2015-2020.
Years
16/15 17/16 18/17 19/18 20/19
Russia
MC
b-pr.
0.290 0.250* 0.211 0.250 0.229
MC
pr.
0.250 0.250 0.195 0.250 0.250
InA
PIA
0.540 0.500* 0.406 0.500 0.479
Bulgaria
MC
b-pr.
0.192 0.250 0.294 0.250 0.250
MC
pr.
0.250 0.250 0.229 0.250 0.250
InA
PIA
0.442 0.500 0.523 0.520 0.511
Greece
MC
b-pr.
0.305 0.250 0.269 0.250 0.250
MC
pr.
0.268 0.250 0.233 0.250 0.250
InA
PIA
0.573 0.500 0.501 0.512 0.507
Ital
y
MC
b-pr.
0.280 0.250 0.309 0.250 0.250
MC
pr.
0.301 0.250 0.214 0.250 0.250
InA
PIA
0.581 0.500 0.524 0.502 0.514
Malta
MC
b-pr.
0.284 0.250 0.263 0.250 0.250
MC
pr.
0.291 0.250 0.129 0.250 0.250
InA
PIA
0.574 0.500 0.392 0.503 0.505
Czech Republic
MC
b-pr.
0.300 0.250 0.299 0.250 0.250
MC
pr.
0.274 0.250 0.248 0.250 0.250
InA
PIA
0.573 0.500 0.546 0.514 0.509
Note: *values of 0.250 and 0.500 mean that the level of innovation activity has not changed;InA – innovative activity.
Assessment of Innovation Activity in the Field of Environmental Protection in Russia and the EU Countries
201
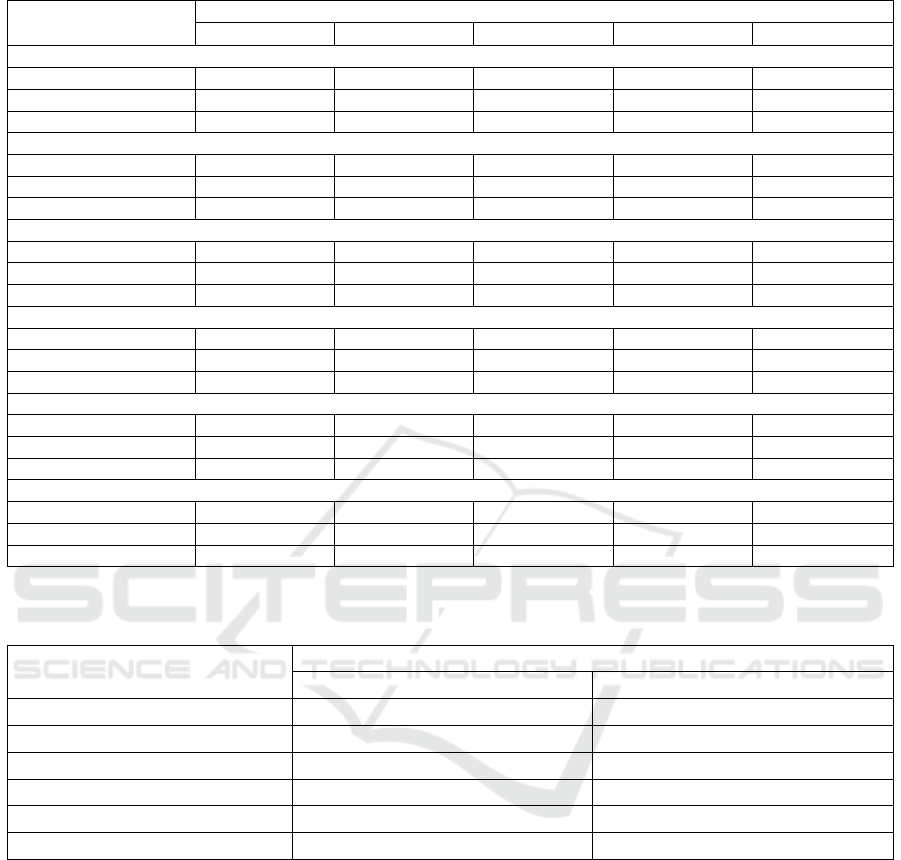
Table 3: Assessment of innovation activity in Russia and the EU countries to improve environmental safety in 2015-2020.
Years
16/15 17/16 18/17 19/18 20/19
Russia
InA
PIA
0.540 0.500 0.406 0.500 0.479
InA
FinP
0.590 0.505 0.537 0.531 0.564
InA
EnI
0.564 0.503 0.467 0.515 0.520
Bul
g
aria
InA
PIA
0.442 0.500 0.523 0.520 0.511
InA
FinP
0.570 0.461 0.358 0.549 0.478
InA
EnI
0.502 0.480 0.432 0.524 0.489
Greece
InA
PIA
0.573 0.500 0.501 0.512 0.507
InA
FinP
0.549 0.485 0.443 0.496 0.523
InA
EnI
0.560 0.492 0.471 0.498 0.512
Ital
y
InA
PIA
0.581 0.500 0.524 0.502 0.514
InA
FinP
0.489 0.517 0.537 0.507 0.508
InA
EnI
0.532 0.508 0.530 0.504 0.503
Malta
InA
PIA
0.574 0.500 0.392 0.503 0.505
InA
FinP
0.554 0.611 0.384 0.517 0.532
InA
EnI
0.564 0.553 0.388 0.508 0.516
Czech Republic
InA
PIA
0.573 0.500 0.546 0.500 0.500
InA
FinP
0.556 0.520 0.507 0.535 0.532
InA
EnI
0.573 0.500 0.546 0.500 0.500
Table 4: Correlation coefficients between indicators of activity in the implementation of environmental innovations in Russia
and individual EU countries for 2015-2020.
Correlation between InA
EnI
and:
InA
PIA
InA
FinP
Russia 0.9111 0.6966
Bulgaria -0.5314 0.9417
Greece 0.8913 0.9416
Italy 0.8392 0.0525
Malta 0.9354 0.9551
Czech Republic 0.9164 0.6867
Thus, the assessment of the innovation activity of
industrial enterprises in the field of environmental
protection in Russia and the EU countries shows that
its level is close to the average level, relative to which
there is either a moderate increase or a moderate
decrease in innovation activity. The number of
countries according to the degree of factor influence
on the change in innovation activity was equally
distributed:
1) Russia, Malta and the Czech Republic are
characterized by a pronounced relationship
between the processes of creation and use of
innovative technologies and a generalizing
indicator of innovation activity in the field of
environmental innovation;
2) Bulgaria, Greece, Malta are characterized by a
pronounced relationship between the volume
of financing of environmental protection
expenditures and the generalizing indicator of
innovation activity in the field of
environmental innovation.
The assessment of innovation activity in the
environmental sphere is limited by a set of
comparable statistical data in the country context and
in the context of industries. A more specific
assessment is possible provided that there are
comparable data from Russian and international
statistics on the sources of financing environmental
innovations in various industries, special costs
associated with environmental innovations, the
MMTGE 2022 - I International Conference "Methods, models, technologies for sustainable development: agroclimatic projects and carbon
neutrality", Kadyrov Chechen State University Chechen Republic, Grozny, st. Sher
202

results of joint innovation activities in this area
between countries, etc.
REFERENCES
Alexandrov, A. V., 2020. Responsible Investments (ESG)
as a business standard of the XXI century. Banking. 8.
pp. 13-17.
ESG Investment Market in Russia: present and future.
https://www.rshb.ru/download-file/472115.
Khutorova, N. A., Khutorov, A. O., 2021. Development of
socially responsible investment practice in the context
of economic security of the state. Economic analysis:
theory and practice. 10(20). pp. 1914-1932.
Annenskaya, N. E., Nazariants, A. A., 2020. Responsible
investing is a growing trend in the Russian financial
market. Digest – Finance. 4(25). pp. 462-479.
Kondrashov, O., Lapko, B., 2020. Innovation environment
in the system of economic development. Science and
innovation. 12(214). pp. 38-44.
The New Economy: Beyond the Hype. Final Report on the
OECD Growth Project. OECD.
https://www.oecd.org/economy/growth/2380634.pdf.
Global sustainable investment review 2020. Global
Sustainable Investment Alliance 2021. http://www.gsi-
alliance.org/wp-content/uploads/2021/08/GSIR-
20201.pdf.
ESG Investment Market in Russia: present and future.
https://www.rshb.ru/download-file/472115.
Cheng, M., Yang, S., Wen, Z., 2021. The effect of
technological factors on industrial energy intensity in
China: New evidence from the technological
diversification. Sustainable Production and
Consumption. 28.
Stern, N., Valero, A., 2021. Innovation, Growth and the
Transition to Zero Emissions. Policy Research. 50(9).
Shlichter, A. S., 2020. Business strategies of companies in
the context of the concept of sustainable development.
World Economy and International Relations. 4(64). pp.
37-44.
Andreas Kuckerz, A., SK Berger, E., Brendle, L., 2020.
Entrepreneurship and sustainable transformation of the
bioeconomy. Ecological innovations and social
transformations. 37. pp. 332-344.
Khaled, R., Ali, H., Mohamed, K. A., 2021. Echab.
Sustainable Development Goals and Indicators of
Corporate Sustainability: Comparison, Degree and
Determinants. Journal of Clean Production. 311.
Thijssens, T., Maas, K., 2021. The innovative contribution
of multinational enterprises to the Sustainable
Development Goals. Journal of Cleaner Production.
285.
Polzin, F., Sanders, M., Serebriakova, A., 2021. Finance in
global transition scenarios: Mapping investments by
technology into finance needs by source. Energy
Economics. 99.
Dong, W., Li, Y., Yu, C., 2021. How does venture capital
spur the innovation of environmentally friendly firms?
Evidence from China. Energy Economics. 103.
Demilkhanova, B. A., 2013. Methodology for assessing the
innovation activity of the industrial complex. Economic
analysis: theory and practice. 19(322). pp.17-26.
Indicators of innovation activity: 2015-2020: statistical
collections. State University – Higher School of
Economics. HSE. https://www.hse.ru.
Eurostat (Eurostat Science, Technology and Innovation).
http://ec.europa.eu/eurostat/portal/page/portal/statistics
/search_database.
Assessment of Innovation Activity in the Field of Environmental Protection in Russia and the EU Countries
203
