
Interaction Lab: Web User Interaction Tracking and Analysis Tool
Daniel Fernández-Lanvin
1a
, Javier de Andrés
2b
, Martín González-Rodríguez
1c
and Pelayo García Torre
1
1
Department of Computer Science, University of Oviedo, Spain
2
Department of Accounting, University of Oviedo, Spain
Keywords: Web Interaction Tool, HCI, User Profiling.
Abstract: Web interaction is a complex process that involves a series of gestures, patterns and determining factors.
The degree to which these factors influence the user experience in any of its facets (performance,
satisfaction, etc.) is a critical aspect since it can mean the success or failure of a website. This influence can
be measured through experiments and is an important area of research in Human-Computer Interaction. This
paper presents a web tool designed to support this type of experiments, providing a semi-automated way to
instrument web applications, collect the interaction data of the subjects and analyse it once the experiment is
finished.
a
https://orcid.org/0000-0002-5666-9809
b
https://orcid.org/0000-0001-6887-4087
c
https://orcid.org/0000-0002-9695-3919
1 INTRODUCTION
The goal of this work is the design and development
of a web tool to give support to the tracking and
analysis of anonymous user’s low-level interaction
features in web applications. Many tools already
analyze web user’s behavior during the interaction
with a web site. However, they are designed under
the marketing analysis and search engine
optimization (SEO) approaches. Thus, they allow
designers to get heat maps, provide support for A/B
test implementation or access mouse movements
recording, among other aspects of user interaction.
Even though these kinds of metrics are very useful
while trying to evaluate the effectiveness of a design
(or comparing two possible designs), the data
provided in most of the cases lack the level of
accuracy needed when the low-level aspects of the
interaction are under analysis. Useful features like
the speed of the mouse, precision over the target,
acceleration, number of corrections, reflection time,
convexity of the trajectory, or simply the raw data
gathered during the interaction are not considered in
most of these alternatives. So, when we want to give
answers to questions like “how certain aspects of the
design determine the way we move the mouse
according to our age or gender?”; “do elder people
need more time to start interacting after loading the
page?”; or “does the user’s gender have any
influence in the performance of basic interaction
tasks?”, we cannot lean on these tools. The
application presented in this work pretends to
provide support to these needs, facilitating the
transparent instrumentalization of web applications
in a non-intrusive way, and providing an extensible
set of analysis strategies that can help Human
Computer-Interaction (HCI) researchers to observe
and analyze user’s interaction.
The remainder of the paper is structured as
follows: Section 1. discusses some third-party
proposals related to the topic. Section 3 describes
our approach. In section 4 we summarize the results
of the test ran over the system. Section 5contains the
conclusions, and finally in section 6 we highlight the
limitations of the tool in its current state and the next
steps to take.
2 RELATED TOOLS
As stated in section 1, there are several tools (most
of them professional industry oriented) available in
152
Fernández-Lanvin, D., de Andrés, J., González-Rodríguez, M. and Torre, P.
Interaction Lab: Web User Interaction Tracking and Analysis Tool.
DOI: 10.5220/0011567100003318
In Proceedings of the 18th International Conference on Web Information Systems and Technologies (WEBIST 2022), pages 152-158
ISBN: 978-989-758-613-2; ISSN: 2184-3252
Copyright
c
2022 by SCITEPRESS – Science and Technology Publications, Lda. All rights reserved
the Web that are, somehow, close to this approach.
Contentsquare (Contentsquare n.d.), for example,
provides mechanisms for user interaction tracking,
site search tracking, recording and analyzing user
behavior and getting heat maps of mouse
movements, clicks, scrolls, etc., among other
functionalities. Woorank (WooRank n.d.) is another
similar tool, but more oriented to increase the
usability of the site. It offers a list of tips and
recommendations about the analyzed web sites.
Hotjar (Hotjar n.d.), a very popular one, provides
similar functionalities: heat maps showing the places
on the web where users click or move the mouse,
and which pages of the site are the most visited; user
behavior analysis in forms; recordings of user
navigation and contextual surveys to obtain the level
of user satisfaction, among others. Finally,
Smartlook (Smartlook n.d.) offers similar
alternatives of recording and analysis. These are just
four of the most popular professional tools focused
on the analysis of user interaction. Besides that,
there is of course Google Analytics (Google n.d.),
the very well-known tool provided by Google.
Even though all these tools are powerful
alternatives for the context and scenarios they were
designed for, they are not so suitable when the goal
is to analyze low-level details of user interaction.
Besides, they focus their analysis on group behavior,
and lack the possibility of gathering user specific
data, like, for example, age, gender, laterality, ethnic
group, or any other personal aspect that could be
determining in one or another way of the way the
user interacts with the application. These facts,
among others, are the reason why they do not suit
with projects in which the main goal is not the
evaluation of the improvement of the design from
the usability or marketing point of view. We have an
evidence of these limitations in the experience of
Dragos et al., who reported that Google Analytics is
not suitable to educational web sites due to the
different way users interact with such kind of sites
(Dragoş 2011).
3 OUR PROPOSAL
The main difference of this proposal with the
available alternatives described in section 2 comes
from the fact that this is a HCI research-oriented
tool. Any sensitive data that can be potentially
gathered from the client is delivered to the server
and stored in the database for future evaluation. That
involves mouse events (movements, clicks, double
clicks, scrolls, etc.), but also any information
provided by the browser and readable through the
instrumentalization code (screen resolution,
dimensions, etc.). Researchers will simply have to
(i) design the experiment in the platform, (ii)
download the customized instrumentalization code
(Data Tracker subsystem) and (iii) integrate it in the
prototype they want to analyze. The specific
treatment and analysis of these data is subsequently
performed by an extensible set of feature-extractors.
The experiment designer will decide which of these
feature-extractors are convenient for the specific
analysis. Nevertheless, the original data will never
be altered. Thus, there is always the chance to
perform a new and deeper analysis based on new
extractors in the future, or either to extract the raw
data for further post-processing using different
analysis tools.
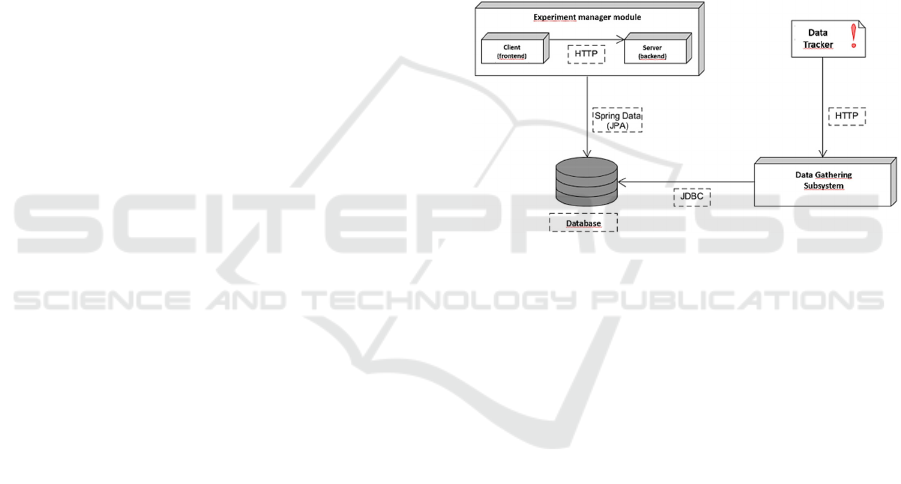
Figure 1: Architecture of the system.
The application is organized into the following
modules: (a) Experiment manager subsystem, (b)
Data Tracker subsystem and (c) Data gathering
subsystem.
3.1 Experiment Manager Subsystem
This is the front-end of the tool, and allows users to
create researcher accounts and experiments. Each
experiment can be shared with other researchers than
can participate as full-researchers or collaborators
(with limited access to the experiment). During the
creation of the experiment, the researcher must
provide title and description, but also any subject’s
parameters they need to include in the sample. That
is, the researcher can determine that, for a specific
experiment, the system must register parameters like
age, gender, country of residence, or any other
parameter (See Figure 2). The number of parameters
is unlimited, but the type are restricted to number,
String or Date.
Interaction Lab: Web User Interaction Tracking and Analysis Tool
153
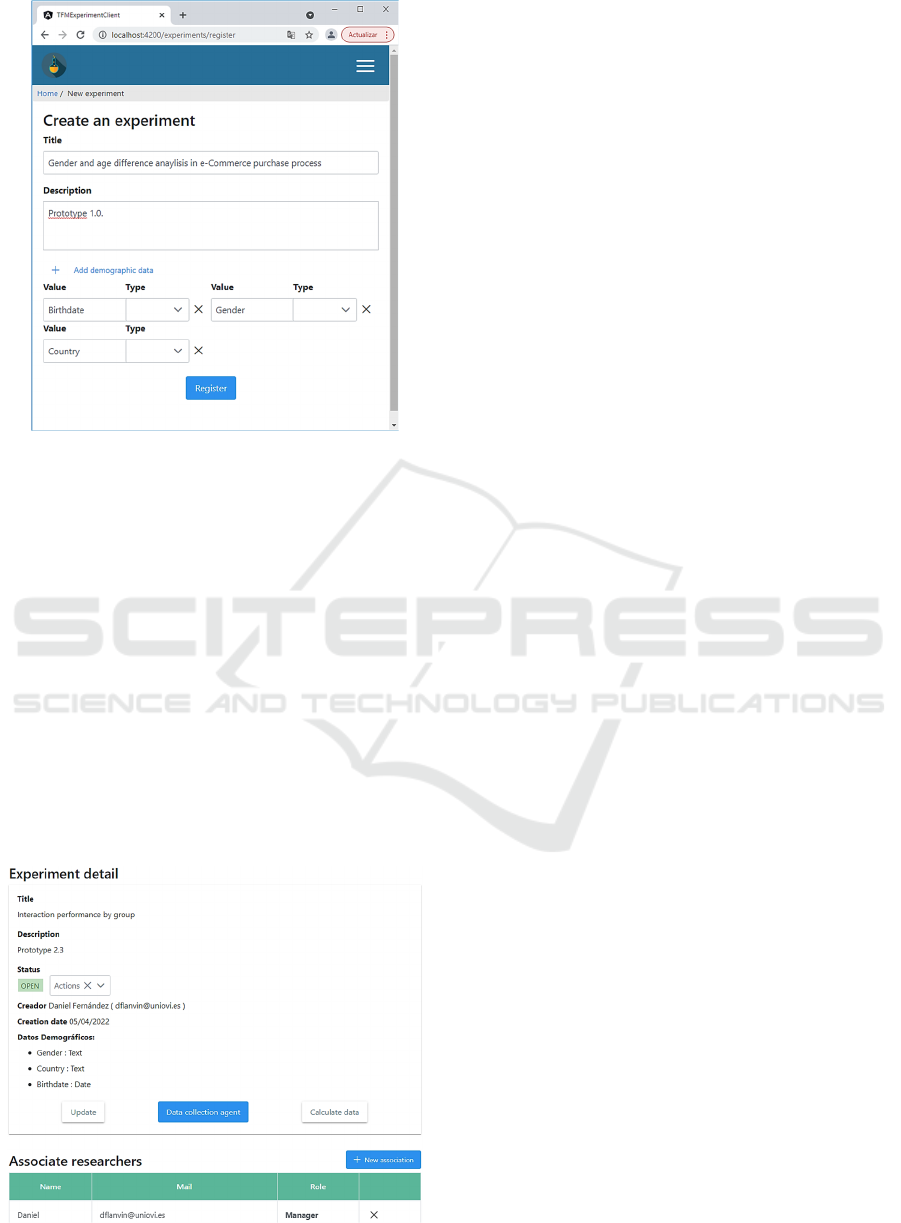
Figure 2: Experiment designer dashboard view.
For each of the parameters associated to the
experiment there will be an automatically generated
method in the Data Tracker Subsystem API that
registers the information for each subject,
associating it to their interaction data. Thus,
researchers can include a previous custom form in
their prototype to gather this information from
subjects, and deliver these data through the Data
Tracker Subsystem that will have a sendAge,
sendGender or sendCountry methods. Although this
mechanism was initially designed to gather
demographic data, it can collect any kind of
parameter needed for the experiment design (for
example, if it is needed to ask for the level of studies
or the number of hours the user spends using
computers per week).
Figure 3: Open experiment view.
Once the experiment is designed, researchers can
activate it. From this moment on, researchers can
download the Data Collection Agent (Data
Gathering System) and integrate it into the prototype
(See Figure 3). During the period that the
experiment is open, the system will gather any data
coming from the prototype through this agent.
When the experiment data gathering phase
finishes, the researcher will “close” the experiment
and proceed with the analysis. It consists of two
stages: a filtering process to clean wrong or
uncompleted data and a feature-extraction process to
calculate the different features needed for the study.
The former is done using an extensible set of Data
Filters, the latter using the feature-extractors.
3.2 Data Filters
Researchers can apply one or more filters to the
sample. Data filters are designed to facilitate the data
preparation for extracting the features or exporting the
information to a CSV file. Two filters are already
implemented in the tool, although the application is
prepared to be extended with new ones:
• Full-scene Filter: it discards every subject data
from a scene that is unfinished by the subject.
Uncompleted scenes (due to, for example,
subjects leaving before finishing the task) can
contaminate the sample with unreal feature
values, invalidating the results. This way, the
researchers can automatically discard any
uncompleted scene.
• Complete Subject’s Parameters Filter: It
discards any subject’s data when they did not
provide all the parameters requested in the
experiment.
3.2.1 Feature-Extractors
The tool implements several feature-extractors that
are designed to calculate some of the elemental
parameters that describe the interaction of the user.
They are implemented following the Strategy
Design Pattern (Gamma 1995). Because of that,
adding new feature-extractors to the tool does not
require any source code modification and can be
done in run-time. The following list summarizes the
feature-extractors currently available in the tool:
• Total Scene or Sub-scene Time: Represents
the total time the user spends in the specified
scene.
• Reaction Time: Represents the total time that
passes from when the scene is loaded until the
user produces the first event.
WEBIST 2022 - 18th International Conference on Web Information Systems and Technologies
154
• Selected Component Reaction Time:
Represents the time that passes from when the
component is loaded until the user reacts with
it.
• Number of Options Offered by the
Component: Represents the total number of
options offered for components that have
multiple selections.
• Decision Time between the Number of
Options: Represents the time it takes to the
user to choose an option in a multiple-choice
component (combo boxes, lists, etc.) divided
by the number of options offered.
• Number of Times the User Changed His/Her
Mind: In selection components such as radio
buttons or checkboxes, it represents the number
of times the user selected an option.
• Number of Edited Characters Per Second in
a Text Field: Represents the total number of
typed characters divided by the time converted
to seconds.
• Words Edited Per Second in a Text Field:
Represents the total number of words typed
divided by the time converted to seconds.
• Number of Characters Deleted in a Text
Field: Represents the total number of
characters deleted.
• Total Number of Times the Left and Right
Scroll Arrows Have Been Pressed:
Represents the total number of times the left
and right scroll arrows have been pressed.
• Ideal Distance with Respect to a
Component: Represents the length of the line
that joins the points of the user's initial position
and the center of the component.
• Real Distance with Respect to a Component:
Represents the distance traveled by the user's
mouse from the initial point to the click
position on the component.
• Difference between the Real and Ideal
Distances: Deviation from the ideal path:
Represents whether the path followed by the
mouse from the initial point to the end point is
above or below the straight line that joins both
points.
• Mouse Movement Time: Represents the total
mouse movement time from the initial event to
the interaction event with the component.
• Mouse Speed Considering Ideal Distance:
Calculates the ideal distance between the initial
event and the interaction event with the
component divided by the time of the mouse
movement.
• Mouse Speed Considering Actual Distance:
Calculates the actual distance between the
initial event and the component interaction
event divided by the mouse movement time.
• Mouse Corrections: Represents the total
number of deviations produced with respect to
the ideal line between the first event and the
interaction event with the component.
•
Mouse Precision in Pixels: Represents the
distance between the coordinates where the
mouse was clicked and the centre of the
component.
• Mouse Precision in Percentage: Represents
the distance in percentage with regard to the
size of the component between the coordinates
where the mouse was clicked and the centre of
the target component.
• Erroneous Clicks: Number of clicks produced
outside the component dimensions.
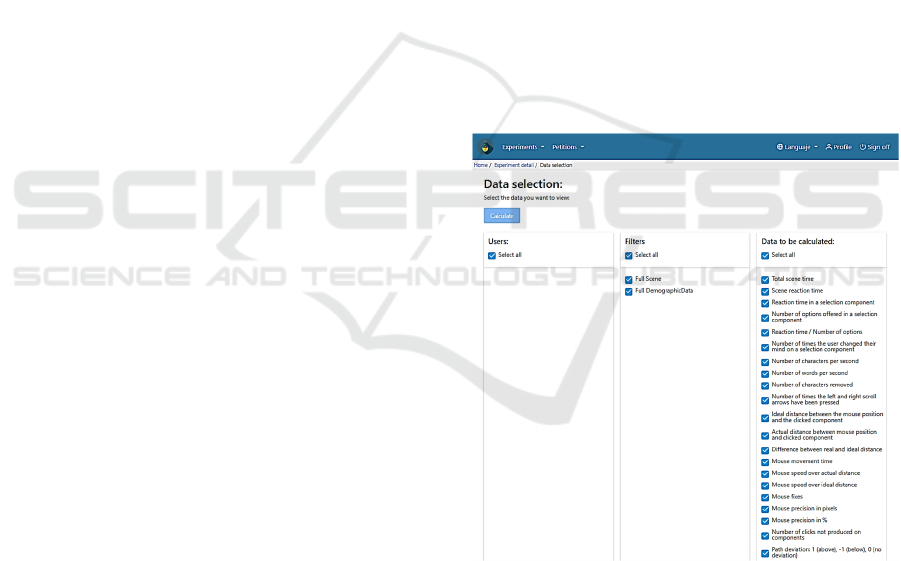
All these calculated features can be exported to a
CSV file from the researchers view (Figure 4).
Besides that, researchers can always download the
RAW data of the experiment, also in CSV. Format
Figure 4: Analysis view of the experiment dashboard.
3.3 Data Tracker Subsystem
It is implemented as a Javascript API, the Data
Collection Agent. Its main functionality is to capture
all the events produced in the human-machine
interaction, as well as the interaction with the
specific components of each page (buttons, links,
dropdowns, etc.), the user's navigation data (browser
data, screen, etc.) and the subject’s parameters
Interaction Lab: Web User Interaction Tracking and Analysis Tool
155
associated to the experiment by the researcher. This
information is sent to the Data Gathering web
service through HTTP requests. The customized
version of the API is available for download from
the experiment dashboard in the application, once
the researcher has finished the design of the
experiment. Thus, in will include one method per
subject parameter declared in the experiment. The
researcher will decide how the prototype will ask for
this information to the subject, and will use these
methods to deliver the information to the experiment
manager.
3.3.1 Scenes and Subscenes
Each experiment can have one or more scenes, and
each one at the time, can involve many sub-scenes.
For each scene, the prototype must call the
corresponding methods for opening it, declare the
components that must be traced, and close it. To
avoid any real time delay in the user experience due
to the delivery of the data to the server, all the
information gathered is kept in the browser until the
scene is closed. This approach works with
independent scenes in which the time required to
deliver the data will not determine the user
experience
4
. For example, this delay is acceptable in
any scenario where the user has added some
products to the shopping cart (scene 1), and want to
proceed to checkout (scene 2). However, some other
scenarios require being more fluent between scenes,
since any delay would allow the user, for example,
to move the mouse to a different location in the
screen, biasing the results. If what we want to
evaluate is the reaction time and precision of the
user clicking the different targets that appear
sequentially in different coordinates of the screen,
we cannot afford any delay between the different
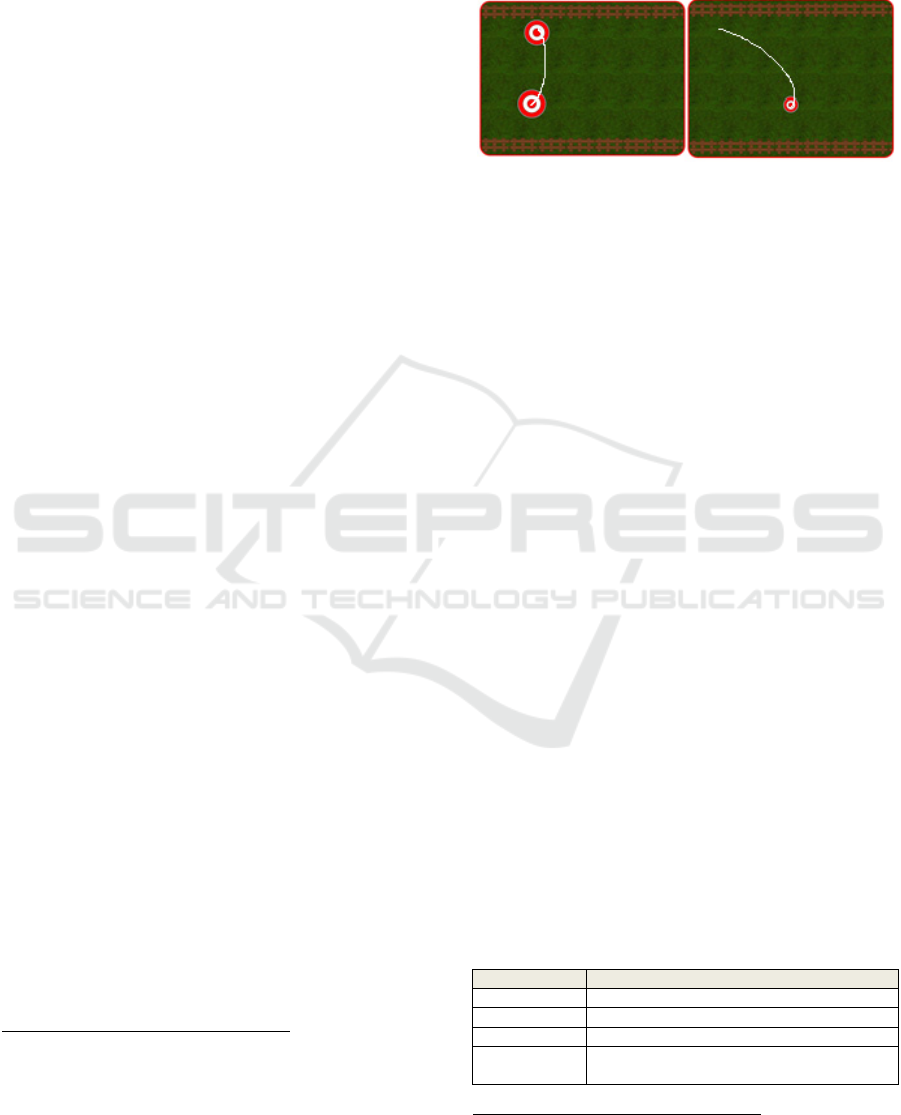
scenes. For example, Figure 5 shows a snapshot of
an experiment driven to evaluate the influence of
Fitt’s law (Guiard, Olafsdottir, and Perrault 2011) in
elder people where, at the start of the second view,
the mouse must be exactly where the user hit the
previous target. In these scenarios, we can use sub-
scenes. The main difference with the scenes is that
the data will not be delivered at the end of the sub-
scene, but once the surrounding scene is closed.
4
Notice that a long scene can involve a considering
amount of interaction data about mouse movements and
clicks. The delivery of these data can require an
excessive time to be delivered without determining the
behaviour of the application.
This strategy involves a fluent transition between
sub-scenes, avoiding any influence in the user
experience and, therefore, in the results of the
experiment.
Figure 5: Example of two subscenes of a Fitt's law
evaluation experiment tracked by the proposed tool.
3.4 Data Gathering System
The Data gathering system consist in a set of Web
Services that are consumed by the Data Tracker
Subsystem API to deliver the data. Subject’s
information is identified by an auto generated unique
id that is delivered in each request to the server.
4 EVALUATION
In any software project, availability is a critical
issue. However, in the experiments that this specific
tool is oriented to provide support to, it is even more
important. A failure of the system in the middle of
the session that could lead the subject to repeat the
experiment would drastically introduce a bias in the
sampling process. A second attempt of the subject
involves a learning effect that, in most of the
scenarios, will adulterate the results (although this,
of course, strongly depends on the kind of prototype
and interaction under analysis). This section presents
the results of the load tests ran in the testing phase of
the project. These tests have been developed using
Gatling
5
. This tool is a free and open source web
application that allows the testing process by
recording the HTTP requests made. Tests have been
executed on our integration server, described in
Table 1.
Table 1: Integration server configuration.
Feature
V
alue
OS Windows Server 2016 Datacente
r
Version 1607
RAM 7,99GB
Processor Intel® Xeon® Silver 4110 CPU @ 2.10
GHz 2.10 GHz (2 processors)
5
https://gatling.io/
WEBIST 2022 - 18th International Conference on Web Information Systems and Technologies
156
Tests have been ran separately for the Experiment
manager subsystem and the Data gathering and
tracking subsystems (since these two work together).
Table 2 and Figure 6 summarize the results of the
Experiment Manager subsystem. As can be seen,
with the current configuration of the integration
server, the system can afford up to 50 simultaneous
users.
Table 2: Response times for the Experiment Manager
Subsystem.
Users
Total
requests
OK
KO
T<800
800 ms < t
<1.200 ms
t > 1.200 ms
Max t resp
ms.
10 950 950 0 888 12 50 25.107
25 2.375 2.375 0 2.030 96 249 25.198
50 4.750 4.750 0 3.022 397 1.331 42.106
150 14.176 13.920 256 4.646 1.070 8.204 60.015
250 17.237 12.654 4.583 1.574 274 10.806 68.514
500 42.712 31.701 11.011 4.087 1.758 25.856 119.999
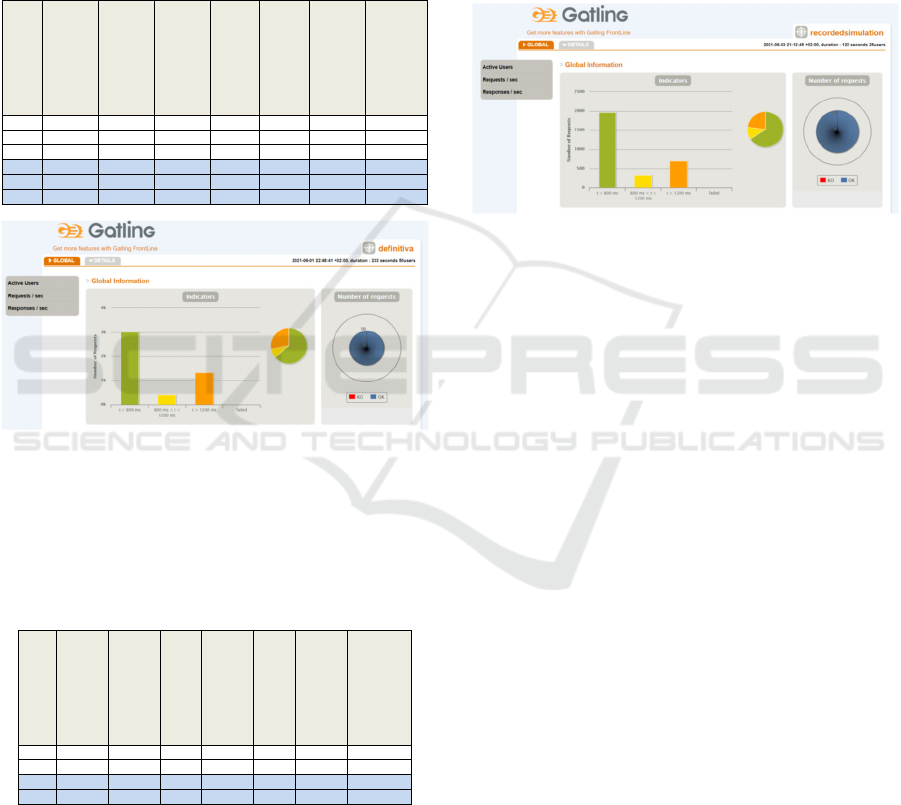
Figure 6: Gatling report for the capacity test of the
Experiment Manager Subsystem and 50 users.
The results of the Data Gathering and Tracking
subsystems are shown in Table 3.
Table 3: Response times for the Data Gathering and
Tracking subsystems.
Users
Total
requests
OK
KO
T<800
800 ms < t
<1.200 ms
t > 1.200 ms
Max t resp
ms.
10 1.200 1.200 0 922 13 265 5.372
25 3.000 1.969 0 327 96 704 19.459
50 3.390 3.124 266 1.701 179 1.244 60.016
75 4.229 3.423 806 2.083 229 1.111 118.039
As can be appreciated, these Data Gathering and
Tracking subsystems saturate sooner than the
Experiment manager subsystem, starting to loose
requests with around 50 simultaneous simulated
users. This is acceptable, considering the intense
network traffic activity involved in the delivery of
all the events generated by a subject along a scene.
Even though 25 users could seem to be a low
threshold for such a critical process, it should be also
considered that 25 simultaneous deliveries will
hardly happen in any realistic scenario (25 subjects
should finish the scene exactly at the same time, as
the Gatling robot did during the tests), and that these
tests have been developed using an integration
server. Finally, the behaviour of the response times
suggests that there is no bottle neck in the process,
so the capacity of the system could be scaled up with
a more powerful server configuration.
Figure 7: Gatling report for the capacity test of the Data
Gathering and Tracking Subsystems and 25 users.
5 CONCLUSIONS
The prototype presented in this work pretends to
provide support to HCI researchers, so they can
conduct their experiments in a reliable and
transparent way. Researchers just need to
instrumentalize their prototype with the customized
script provided by the tool in the experiment
dashboard. This task is simple, and non-intrusive
with regard to the normal behaviour of the target
prototype. The Data Collection Agent will send the
data transparently and automatically to the server,
and store them in the experiment data set. Once the
data-gathering phase of the experiment finishes, the
tool provides an extensible set of filters and feature
extractors to process the data according to the
researcher needs. Furthermore, in case the researcher
needed any additional processing, it is possible to
download the raw data, so it can still be analysed
using third-party external tools.
6 LIMITATIONS AND FUTURE
WORK
Once of the main limitations this first prototype
presents is that the set of filters and feature-
extractors is limited. The main goal to improve the
Interaction Lab: Web User Interaction Tracking and Analysis Tool
157

versatility of the tool before publishing it online is to
enable the possibility of hot-deploying third-party
custom filters and feature-extractors. That way,
researchers could extend the default set of these data
processors with their own specific implementations,
preventing them from the need of exporting the raw
data and implementing the analysis from scratch
with any external analysis tool.
ACKNOWLEDGEMENTS
This work was funded by the Department of
Science, Innovation and Universities (Spain) under
the National Program for Research, Development
and Innovation (Project RTI2018-099235-B-I00).
REFERENCES
Contentsquare. n.d. “Contentsquare | Digital Experience
Analytics - DXP Analytics.” Retrieved January 13,
2022 (https://contentsquare.com/).
Dragoş, Sanda Maria. 2011. “Why Google Analytics
Cannot Be Used for Educational Web Content.”
Proceedings of the 2011 7th International Conference
on Next Generation Web Services Practices, NWeSP
2011 113–18. doi: 10.1109/NWESP.2011.6088162.
Gamma, Erich. 1995. Design Patterns: Elements of
Reusable Object-Oriented Software. Addison-Wesley.
Google. n.d. “Analytics.” Retrieved January 13, 2022
(https://analytics.google.com/analytics/web/#/report-
home/a165041490w230774285p217066939).
Guiard, Yves, Halla B. Olafsdottir, and Simon T. Perrault.
2011. “Fitt’s Law as an Explicit Time/Error Trade-
Off.” P. 1619 in Proceedings of the 2011 annual
conference on Human factors in computing systems -
CHI ’11. New York, New York, USA: ACM Press.
Hotjar. n.d. “Hotjar: Website Heatmaps & Behavior
Analytics Tools.” Retrieved January 13, 2022
(https://www.hotjar.com/).
Smartlook. n.d. “Smartlook.” Retrieved January 13, 2022
(https://www.smartlook.com/).
WooRank. n.d. “Website Optimization and Digital
Agency Sales Tools | WooRank.” Retrieved January
13, 2022 (https://www.woorank.com/).
WEBIST 2022 - 18th International Conference on Web Information Systems and Technologies
158
