
Monitoring Mood in a Stream of Self-reflections
Eduard Hoenkamp
1,2 a
and Andrew Gibson
1 b
1
Queensland University of Technology, Brisbane, Australia
2
Radboud University, Nijmegen, The Netherlands
Keywords:
Self-reflection, Document Space Model, Foreground Detection, Affective Meaning, Burnout Prevention.
Abstract:
Burnout and job stress are tragic events that unfortunately occur in many professions. In the teaching pro-
fession, however, it affects not just the individual, but also several concomitant parties: students, school, and
parents. This has lead to the widespread problem of teacher attrition, where the challenge has become not so
much to attract teachers, but to retain them. The present research is based on the reflective writing of early
career teachers (ECTs). These ECTs volunteered to write short weekly reflections during a period of about
half a year. Spotting potential wellbeing problems in these series of reflections, however, calls for careful
reading and studying of such large amounts of texts that manual processing became impracticable. Hence,
we developed an algorithm which transforms such a stream of reflections into a 3-D visualization of mood
changes, in which times of stress and potential for burnout can be detected more easily. This in turns makes it
possible to notice points of concern when there is still time to intervene.
1 INTRODUCTION
This paper looks at the potential for tracking mood of
early career teachers through the computational anal-
ysis of their reflective writing.
Previous work (Crosswell et al., 2018) has shown
the value of using reflective writing to gain greater in-
sights into the experiences of Early Career Teachers
(ECTs). This work involved the collection of regular
(usually every week or fortnight) personal reflections
for a period of 6 months or more using a web applica-
tion called “GoingOK” (Gibson, 2020).
It has been estimated that up to 25% of ECTs leave
the profession within the first 5 years. Compounding
the problems associated with attrition is the lack of
understanding of why it is occurring and consequently
the lack of action in addressing it. Personal well-
being of ECTs has been identified as a significant in-
dicator of how ECTs are personally coping with their
transition to teaching. Significantly, the process of re-
flective writing has been shown to both be effective
in capturing aspects of well-being, but also a way of
helping the writer come to terms with problematic cir-
cumstances.
Previous studies have demonstrated the value of
doing this but they have tended to be small. Hence,
a
https://orcid.org/0000-0002-7882-6916
b
https://orcid.org/0000-0003-4619-6515
the reflective writing is now being collected and an-
alyzed on a much greater scale. They are part of the
growing data set we just mentioned and which we will
refer to as the GoingOK corpus.
Manually analyzing this corpus, however, is not
practicable for several reasons a priori. First, and
most obvious, there is the sheer number of reflec-
tions to be read (for the current data set in the or-
der of tens of thousands). Second, reading the reflec-
tions requires attention at a different levels of detail,
from passages to phrases, as especially for this mate-
rial, participants may be uncomfortable with detailed
self-disclosure. And third, it requires close reading, to
not overlook the subtle changes in mood that could be
important to notice. In short, performing this type of
analysis on large numbers of ECTs is impracticable.
The solution we propose here is to use computational
rather than human analysis. Such an approach may
also allow factors of well-being to be discovered in
data patterns that are too subtle or diffuse to be visi-
ble to the human analyst. Further, any links between
data patterns and factors of well-being could be used
predictively to provide early warning of impending is-
sues associated with well-being and ultimately risk of
departing the profession.
A feature of this type of writing is that charac-
teristics with analytical value are rarely stated explic-
itly in the writing. For example, it is more likely that
292
Hoenkamp, E. and Gibson, A.
Monitoring Mood in a Stream of Self-reflections.
DOI: 10.5220/0011559700003335
In Proceedings of the 14th International Joint Conference on Knowledge Discovery, Knowledge Engineering and Knowledge Management (IC3K 2022) - Volume 1: KDIR, pages 292-299
ISBN: 978-989-758-614-9; ISSN: 2184-3228
Copyright
c
2022 by SCITEPRESS – Science and Technology Publications, Lda. All rights reserved

Table 1: Part of a stream of reflections from the ‘Going OK’ corpus.
08/02/2013 60.0 Am still feeling stressed about the workload, so am not ‘soaring.’ Overall a good week though.
13/02/2013 27.0
Need to revisit explicit teaching strategies. Beh man is difficult with 1 student. Tried all strats! Intro-
duced ‘Thinking Space.’
13/02/2013 33.0
Finding behaviour management difficult at the moment for 1 student. Am running very behind on my
lessons... but will hopefully catch up soon!
20/02/2013 18.0
Lots of reflecting to do... lots of changing/adapting of my strategies... Behavior management is still a
little challenging but getting better. So many of my really planned lessons haven
˜
Ot gone right... and
the ones i haven
˜
Ot planned that much have gone really well! How does that happen?
07/03/2013 67.0
Am feeling exhausted... but am feeling like this week is going better. Behaviour management is getting
easier... am trying some new strategies. Still need to work on extending and challenging students.
writing exhibit a depressive tone with use of words
like ‘struggling’ and ‘frustrated’ than it include lan-
guage like ‘I am depressed’. Further, reflections can
include negative recollections of problematic events
together with optimistic characterizations of how a
similar event might be handled in future.
This paper describes how a stream of reflec-
tions can be transformed into a graphical represen-
tation that quickly and easily locates important turn-
ing points in the stream of reflections. These are usu-
ally accompanied by a change in mood, in the APA
(American Psychological Association) definition of
“any short-lived emotional state, usually of low inten-
sity” (VandenBos and American Psychological Asso-
ciation, 2015). Hence this work makes it possible to
monitor mood without the need or necessity to read
all reflections individually or in their entirety. This
obviates the otherwise prohibitive task of manually
processing thousands of reflections created continu-
ally in short periods of time.
2 AUTOMATIC PROCESSING OF
REFLECTIONS
Reflections are snippets of text in which participants
share how they feel they are going, and write about
why they feel that way. Since participants write re-
flections on a regular basis, we refer to this as a stream
of reflections. Let us start with the example of a
stream of reflections from the GoingOK site (Gib-
son, 2020), as depicted in Table 1. It shows just a
sample of a ‘Going OK’ corpus with scores that we
will explain later in this article. Using the terms used
in Information Retrieval (IR), the corpus in the cur-
rent context consists of around two dozen reflections.
They were anonymized, and the recurring example in
this article was taken from (Gibson, 2017) where it
was referred to as rulguz. Initial text processing fol-
lows the IR bag-of-words approach, paying no heed
to word order or grammar.
2.1 Preprocessing the ‘bag-of-words’
The first step is as usual, to remove stopwords from
the text. This already puts more emphasis on the
words that are relevant to the domain. The next rou-
tine step is tf-idf
1
term weighting. This helps distin-
guishing reflections from one another, which in turn
helps in studying reflections over time. After the pre-
processing, the weighted frequencies are recorded as
entries into a table with a column for each word and a
row for each reflection, the word-by-document matrix.
Figure 1 shows this matrix for rulguz.
0 50 100 150 200 250 300 350 400 450
Words
0
5
10
15
20
25
30
Reflections
WxD after preprocessing (nonzeros = 908)
Figure 1: The word-by-document matrix for the rulguz re-
flections, after linguistic preprocessing. The size of the cir-
cles represent the weighted word frequencies (tf-idf ).
Two decades ago the first author proposed to in-
terpret the entries of the word-by-document matrix
as grey-scale pixels in an image (Hoenkamp, 2003).
Henceforth algorithms for dimension reduction in IR
could be replaced by more efficient image processing
algorithms. The current work extends that approach.
Two things can be noted (1) the matrix is sparse,
i.e. the majority of the entries are zero. This is to be
expected, as documents contain far fewer words than
the total present in the corpus. And (2) although the
1
Term frequency - inverse document frequency.
Monitoring Mood in a Stream of Self-reflections
293

words have to be ordered to construct the table (or
matrix), the order assigned to words is irrelevant
2
.
Usually in IR, the corpus is an unordered set of
documents. But the present case is more like a book
and its pages, where the order of the pages makes all
the difference. It is obvious that the time direction
distinguishes whether mood improves or worsens in
the stream. It is like a book, where the mood de-
veloping over time forms the storyline. In what fol-
lows we therefore pursue the approach proposed in
(Hoenkamp, 2019) to reconstruct a storyline from the
experiences of early career teachers (ECTs).
2.2 The Role of ‘outliers’
Many things happen in the lives of early career teach-
ers (ECT) and the reflections are just a small sample
of those events. What we would like to accomplish,
is to separate the important events and experiences re-
ported in the reflections from the more quotidian ones
that are also mentioned. This has an analogy in data
analysis where we want to separate outliers from the
general trend. Outliers therefore usually receive spe-
cial treatment in data analysis, sometimes by explain-
ing them away, or by removing them from consider-
ation. In the last decade an effective approach to the
problem of locating outliers has been proposed in the
form of Robust PCA, which has been developed in
the area of Compressive Sensing (CS). In section 2.3
we will see how this technique is useful to detect a
‘foreground’ in reflections, representing the important
events in ECT’s life that stand out against a ‘back-
ground’ of mundane experiences.
One of the areas where Compressive Sensing has
been remarkably effective, is the processing of video
surveillance data: Unless something eventful hap-
pens, such as an intruder entering the premises, each
video frame consists of thousands of pixels highly
correlated with the next frame. Consequently, these
data form a low dimensional subspace of the high di-
mensional space of all possible pixel combinations.
The static background therefore is the low dimen-
sional highly correlated space. In video surveillance
one wants to isolate a moving foreground that stands
out from a low dimensional background. Similarly,
in the case of reflections we want to isolate the im-
portant events that stand out from the less interesting
surrounding text, as we will see next.
2
For example, one could choose to order the words al-
phabetically. Or, as we did here, choose to number them in
the order of appearance in the stream of reflections. As a
result, a word that appears for the first time in a later reflec-
tion will have a higher number. This explains the illusion of
the ‘diagonal’ that appears in figure 1.
2.3 ‘Foreground Detection’ as
Metaphor
The way video data are processed can be used as
a metaphor for understanding the way we processed
the reflections for this article. This metaphor is so
apt that we first wrote a program that can transform
the (bag-of-words) representation of reflections into
a video stream, without changing the data proper-
ties as far as Robust PCA is concerned. That way
we could start experimenting with a plethora of open
source programs written for video processing, but ap-
plied to reflections. That in turn allowed us to find
out what underlying algorithms would be most appro-
priate to support automatic processing of the reflec-
tions. Recall that a series of reflections is represented
2 4 6 8 10 12 14 16 18 20 22
2
4
6
8
10
12
14
16
18
20
0
0.5
1
1.5
2
2.5
3
3.5
4
4.5
5
(a)
2 4 6 8 10 12 14 16 18 20 22
2
4
6
8
10
12
14
16
18
20
0
0.5
1
1.5
2
2.5
3
3.5
4
(b)
Figure 2: The sequence of reflections is transformed into a
video clip. For example, the last reflection which is the top
row in figure 1) is rolled up into the frame in (a). Figure (b)
shows the same reflection after RPCA.
as a word-by-document matrix, where the corpus is
formed by the reflections. Let us denote the series
of reflections by M, the lackluster, repetitive (hence
highly correlated and dense) part of the reflections by
L, and the important events that seem to spring off the
page by S. So to find the important events — in other
words the outliers — we used Robust PCA to solve
the equation M = L +S given the restrictions of which
we just spoke. The equation is underdetermined ob-
viously (since any L and S that add up to M would be
a solution) but from the video processing domain we
chose the optimization problem:
minimize ||L||
∗
+ λ||S||
1
subject to L + S = M
where ||.||
∗
and ||.||
1
are the nuclear and Manhat-
tan norm respectively. There are many approaches
to solve the equation, each with its own benefits and
drawbacks (Bouwmans et al., 2018). From the do-
main of video processing we focused on algorithms
for motion detection (see e.g. (Goyette et al., 2012)),
which we will, in the spirit of our metaphor, apply to
detect change of mood.
Note that we already completed the first step in the
KDIR 2022 - 14th International Conference on Knowledge Discovery and Information Retrieval
294

0 50 100 150 200 250 300 350 400 450
Words
0
5
10
15
20
25
30
Reflections
WxD after RPCA (nonzeros = 408)
Figure 3: Step 2. Robust principle component analysis
(RPCA) is used to subtract the ‘background’ from the re-
flection data in figure 1, resulting in a sparser word-by-
document matrix.
processing of reflections which for the rulguz corpus
resulted in figure 1. In the current section we present
the tools for the second step, namely to compute the
‘foreground’ of the reflections.
To accomplish this, reflections are turned into pic-
ture frames, as per the example in figure 2: For each
row in the matrix the tf-idf values are turned into gray-
scale pixel and then the row is rolled into a (rectan-
gular) video frame. The sequence of all frames can
then be processed as if it were a video clip, processed
with RPCA
3
, and unrolled back into the new word-
by-document matrix of figure 3. This way RPCA is
used to separate foreground from background (which
is discarded) for further processing. So figure 3 shows
the word-by-document matrix of figure 1 after remov-
ing the background. Once the foreground of the re-
flections has been isolated, i.e. the points that stand
out according to the algorithm, we can compute af-
fective values for these points, as we will show in the
next section.
3 AFFECT DETECTION AFTER
BACKGROUND SUBTRACTION
Many publications
4
, shed light on how to detect af-
fect for different media, such as facial expressions,
voice, and brain signals. We recommend (Calvo
and D’Mello, 2010) for an early but comprehensive
overview. Of course for the current paper the rele-
3
For our running example we computed RPCA using
‘bilateral random projections’ for which the Matlab code is
available on-line (Zhou and Tao, 2011).
4
IEEE Trans. on Affective Computing
vant medium is language (section 6.3 in (Calvo and
D’Mello, 2010)). The earliest systematic work in de-
tecting affect in language use is Osgood et al.’s (Os-
good et al., 1976) ‘atlas of affective meaning.’ It is an
elaborate study into the relationships between emo-
tion and language universals, and one of the earlier
successes in psycholinguistics. The present article
studies the relationship between narrative text and the
mood it expresses, applied to the ‘going OK’ collec-
tion mentioned earlier (Gibson, 2020). Researchers
have studied this relationship for various reasons. For
example (Pennebaker and Francis, 1996) studied if
writing about emotions can have a positive influence
on mental health. Another (Hasan et al., 2019) wanted
to detect emotion bursts in live text streams (Twit-
ter). These and other studies need some way to relate
text to affect or mood. What they have in common
is that they work with individual pieces of text, such
as reports in (Pennebaker and Francis, 1996) (on be-
coming a student) or separate tweets in (Hasan et al.,
2019). What sets our current presentation apart from
these studies is that we study series of subsequent re-
flections. In other words we study change in mood
and affect over time. So, next we will present how we
did this in case of the Going OK corpus.
3.1 Detecting Positive and Negative
Mood
Recall that table 1 is only a small sample of the data
collected from one participant. All participants re-
ceived the same instruction, which was played as a
youtube clip (Gibson, 2019). The instruction asked
the participants to express their mood in two modal-
ities. The first was to position a slider between two
extremes marked as ‘distressed’ on one end and ‘soar-
ing’ on the other, with a midpoint marked ’going OK.’
Obviously, the farther participants move the slider
towards ‘soaring’ the more positive we expect their
mood to be, and the farther towards ’distressed’ the
more negative. The second modality recorded right
after having set the slider, was to write a free form de-
scription of their mood. Both modalities presumably
express the same underlying affect, and we will show
how the affect in the first modality can be computed
given the second.
We assume that typically the mood of the partici-
pants is parallelled in the text they subsequently type
in. But instead of working with the original text, as
in the publications by other researchers, we start from
text where the ’background’ has been removed. Now
for each reflection we have a value for the slider posi-
tion modality, and a value for the text modality. The
slider modality is shown in column R (recorded) in
Monitoring Mood in a Stream of Self-reflections
295

Table 2: Positive and negative words remaining after background subtraction. Column R shows the slide position and column
C is the tf-idf weighted sum of positive and negative words.
# Negatives Positives R C
1 stress confident helping calm amazingly help-
ful love
48 52
2 difficulty enjoying 30 37
3 50 12
4 frustrated 14 6
5 17 12
6 frustrating missed sorry exhausted
overwhelming stressful
ready enjoying 15 38
7 exhausted desperate break 22 24
8 50 50
9 break worried enjoying 50 45
10 67 50
11 scared helped clear 50 51
12 38 50
13 frustrated poor nervous friendly excited 50 44
14 50 50
15 poor stressed issues angry top enjoying 33 43
16 tired freaking slow issue unsure excuse 36 40
17 50 50
18 worried worse annoying silly rude 50 34
19 positive easier 40 46
20 worried bad cold struggling suffering wise 35 39
21 tiring stressed worry 50 43
22 missed hard bad impossible hate dis-
heartening refusal draining
decent motivated 32 30
23 anxious hate draining depressing com-
plained dislike
fun happy progress interesting pretty
nice smile comforting
31 47
24 nervous negative worst crazy improve fun 32 43
25 stress tiring difficult issues miss waste happy helped 50 50
26 50 50
27 stressful hard bullying sick negative pretty nice lucky supportive 37 42
28 worried loose negative happy improve 42 43
Table 2. For the text modality, we used the tf-idf
weighted sum of positive and negative words, which
is shown in column C of Table 2. To more easily
compare these columns, they are summarized as (5-
degree) spline interpolations in Figure 4. The figure
shows the relationship between both recording modal-
ities is as we expected.
0 5 10 15 20 25 30
20
30
40
50
Slider modality
Text modality
Figure 4: Comparing the slider modality and text modality
by comparing the splines for the values in column R and C
of table 2, showing strong correlation r(26) = .94, p < .001.
Given that we can compute the slider modality
from the text modality, would it then not be redun-
dant to ask participants to position the slider? This
raises two issues: First, if all we wanted to know was
a self-assessment of the participant’s well-being on an
ordinal scale, then it seems redundant. But second,
this would beg the question, as you can only know
that the assessment is redundant after you have done
the assessment. But interestingly, and perhaps sur-
prisingly, we can use the assessment to compute emo-
tional dimensions that go beyond the slider setting, as
we will see in a moment. We used crowdsourced data
to feed the exact same algorithms that derived pos-
itive/negative values from the text modality to com-
pute other emotional dimensions.
KDIR 2022 - 14th International Conference on Knowledge Discovery and Information Retrieval
296
3.2 Computing Dimensions of Emotion
The most prominent dimensions for emotion words
found by Osgood et al. have reappeared in the lit-
erature, but varying in name, number, and detail.
Agreement remains, however, by and large over the
positive/negative (or pleasure/displeasure) dimension,
which we already used. We could introduce a sec-
ond dimension, but “the world of emotions is not two-
dimensional,” as the title of (Fontaine et al., 2007) al-
ready contends. Instead we will use three dimensions
that continue to be studied, namely valence which is
closely related to the positive/negative scale, arousal
comparable to a scale from active to inert, and dom-
inance positioned on a scale from powerful to weak.
The ratings for these dimensions, compiled for around
20.000 words, can be obtained from (Mohammad,
2018a). It includes an attractive interface to interact
with the tables to find for each word the values on
each of the three dimensions (Mohammad, 2018b).
The step from one dimension (positive/negative)
to three dimensions is almost trivial. We will use the
same example (rulguz) from the GoingOK corpus, do
the same linguistic preprocessing and Robust PCA,
and hence arrive at the same word-by-reflection ma-
trix. For every word we have the values on each emo-
tional dimension. The result of the computation using
the tables from (Mohammad, 2018a) is depicted in
figure 5.
0 5 10 15 20 25 30
20
25
30
35
40
45
50
55
Valence
Dominance
Arousal
Figure 5: Three emotional dimensions computed from the
reflections (on the horizontal axis). The correlations with
the slider positions (cf table 2) are for valence r(26) =
.95, p < .001, dominance r(26) = .41, p < .03, and arousal
r(26) = .89, p < .001.
3.3 Enriching the Data through
Dimension ‘Expansion’
In 3.1 we already found a strong (.94) correlation be-
tween the values for the slider and text modalities, and
wondered if that would not make the slider values dis-
posable. But here is an interesting twist. The par-
ticipants were forced to fit the emotions which they
could freely express in their verbal accounts, into the
procrustes bed of a one-dimensional slider. In other
words, the value they chose on the one-dimensional
(bi-polar) scale had to be some weighted sum of the
values on the three dimension that would have been
sufficient had they been given the choice. So what
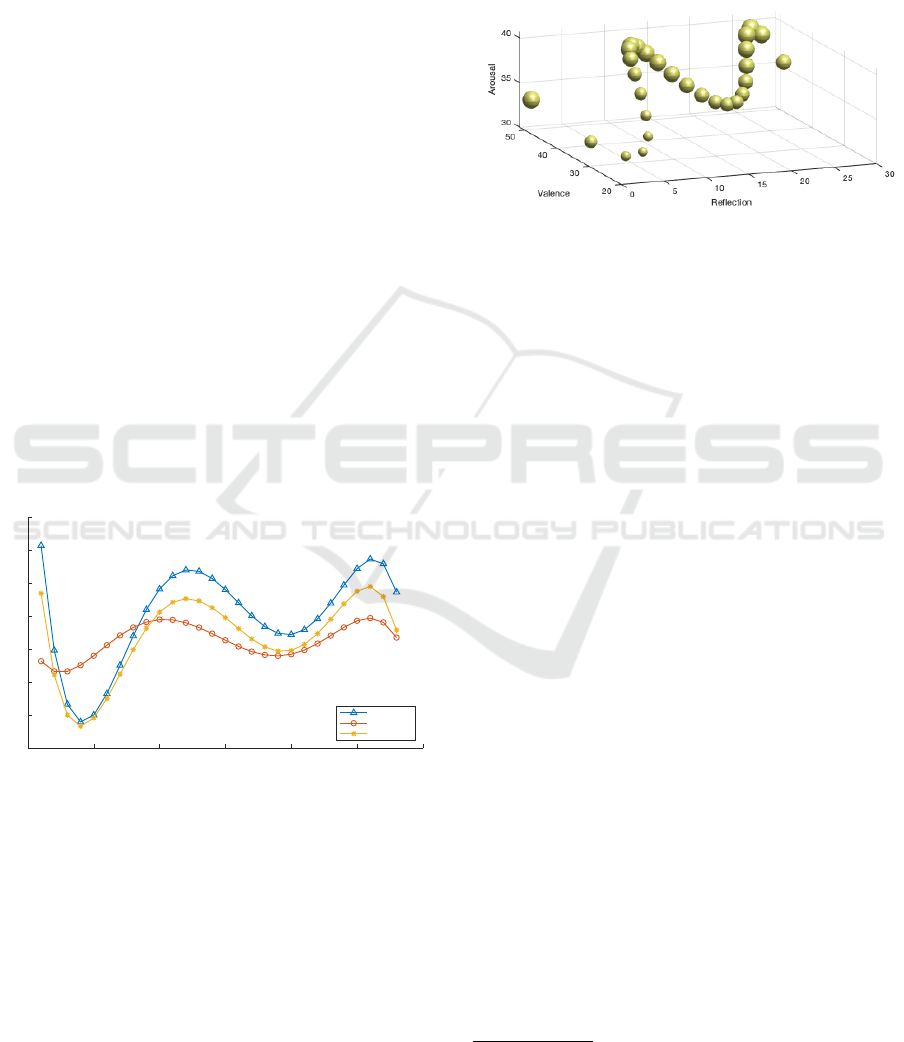
Figure 6: The emotional dimensions of figure 5 rendered in
3-D. Dominance is represented by the size of the spheres.
The figure shows how reflections 13 and 27 stand out, scor-
ing high on all three dimensions.
we have is (1) the values computed on each of the
dimensions, and (2) the weighted sum. From these
two we can compute the weights themselves as fol-
lows: Let A
vad
be a matrix of emotional values by
the number of refections. So each row contains the
three emotional values computed per reflection. We
also have the slider values, let’s call them ~r after col-
umn R of Table 2, and denote the weight vector as ~w.
That participants had to compress their emotions from
a higher dimensional representation (underlying their
texts) onto a one-dimensional (bi-polar) scale can be
expressed as:
A
vad
·~w =~r
The weights can thus be approximated by a least
squares solution of the equation above
5
. So in essence
we have ‘expanded’ the 1-dimensional history of
slider values to a more informative 3-dimensional his-
tory of the participant’s mood. Applied to our running
example it means that the one dimensional spline for
the slider modality in figure 4 will be expanded to the
three dimensional representation of Figure 6.
3.4 Monitoring Mood in 3-D
The ECT reflections in the GoingOK corpus are be-
ing collected in the wider context of teacher attrition
in Australia. As the literature review (Yarrow et al.,
1999) shows, the main issue is not so much in attract-
ing teachers, but to retain them. As teacher attrition
5
In MATLAB
®
code: w=A\r which in the case of figure
6 solves for w=[1.51,0.06,-0.62].
Monitoring Mood in a Stream of Self-reflections
297

is a recurring problem in many other countries, stud-
ies have tried to find conditions under which teach-
ers stay or leave. As an example (Howard and John-
son, 2004) studied the role of ‘resilience’ in stress
and burnout. Such studies are important to improve
the conditions under which teachers stay in their jobs,
but it is perhaps even more important to react in time
when they are prone to leave. In the overview of
Figure 7: Monitoring the mood of an early career teacher.
After arousal has been building up for a while, around re-
flection 20 the valence suddenly drops quickly. Around that
point, the teacher’s written reflections show that her mood
starts to go south when she struggles with unwanted atten-
tion from a parent who she has to communicate with pro-
fessionally.
(Yarrow et al., 1999) on page 406, the authors lay
out six stressors that the system we present here may
monitor for. From these six we select two examples
for which the reflections have been published already,
so we can avoid privacy issues with the participants’
self disclosures in unpublished material. One such
a stressor is “need to take leave to deal with work-
related stress” and figure 7
6
explains an example of
it So instead of carefully reading all reflections from
beginning to end, the picture suggests to start around
reflection 20 to discover the incident that causes the
mood swing. This promises an ability to process the
reflection data for which a manual approach is pro-
hibitive in principle. But it opens an additional av-
enue, as we will see in a moment.
3.5 Intervention
Recall that our approach to monitoring mood was in-
spired by the approach to video surveillance, as elab-
orated in section 2.3. In that domain it is valuable to
have recordings after an intruder entered the premises.
But would it not be more valuable to be able to catch
6
We have changed the point of view for the 3-D figures
to optimize the visibility of data points.
the intruder red-handed and prevent the theft? The
available algorithms in principle allow for such inter-
vention, witness the growing interest in warning sys-
tems based on ‘visual object tracking’ (see e.g. (Li
et al., 2013) for an overview). Once the trajectory of
an object can be predicted from a video stream, this
may allow e.g. a self-driving car to prevent an im-
minent collision. In a similar way one might want to
extrapolate a change of mood in order to detect grow-
ing dissatisfaction of a beginning teacher, or possibly
prevent an imminent burn out. Such a change in mood
can readily be observed from the visible representa-
tion, as in figures 7. Obviously, when mood goes in
a negative direction, it is important to pay attention.
The program could easily issue a notification when
the derivative of the plot line goes negative.
In the case of video surveillance, some systems
apply Newton’s laws of motion to extrapolate a tra-
jectory of moving objects to calculate where they will
be next (see e.g. (Rudenko et al., 2020) for human
motion detection) . So it would be wonderful if we
could extend the metaphor from the visual domain in
the domain of affection. In our case that would mean
trying to find psychological laws that apply to mood
changes. Such laws might look like K
¨
ubler-Ross’s
five stages of loss (K
¨
ubler-Ross and Kessler, 2005),
but such laws are very rare in the psychological liter-
ature. And unfortunately, the few that we found, such
as the five stages model just mentioned, turned out
to lack sound empirical evidence (Maciejewski et al.,
2007). Absent such theories we leave a further elabo-
ration in that direction for future work.
4 CONCLUSION
The motivation for this article is found in the problem
of teacher attrition. The latter forms a challenge in
many parts of the world, a situation which over and
again seems difficult to mitigate. In Australia espe-
cially, programs have been developed for pre-service
preparation of teachers for rural and remote teaching
positions. These are followed up with mentorship and
internship programs. This is the context in which a
growing data base is being built from teachers who
volunteered to reflect and report on their well-being
early in their career. The result is a treasure trove of
information.
Unfortunately processing this data manually by
reading and studying the teachers’ reflections is not
practicable. In contrast to manual processing, this ar-
ticle presented an algorithm that transforms a stream
of reflections into a 3-D visualization, in which possi-
ble points of concern can easily be located. This trans-
KDIR 2022 - 14th International Conference on Knowledge Discovery and Information Retrieval
298

formation can be performed in real-time (typically
in the order of milliseconds), so that an up-to-date
graphical summary is always available, in which po-
tential points of concern stand out, allowing for timely
intervention. More generally, we can see how the
method could also be used in other contexts, as in cor-
porations with a high incidence of burnout. Note how-
ever, that the application of Robust PCA described in
this paper is novel in language processing.
For the time being we want to stay focused on
early career teachers. These teachers usually start
out as idealists with a sense of calling and a life-
time before them. Yet often in a matter of years, they
leave the profession they love, disillusioned and dis-
appointed. We consider it a success if even for a frac-
tion of these teachers the approach outlined above can
help to intervene when there is still time to prevent
this from happening.
REFERENCES
Bouwmans, T., Javed, S., Zhang, H., Lin, Z., and Otazo,
R. (2018). On the applications of Robust PCA in
image and video processing. Proc. of the IEEE,
106(8):1427–1457.
Calvo, R. A. and D’Mello, S. (2010). Affect detection:
An interdisciplinary review of models, methods, and
their applications. IEEE Trans. Affective Computing,
1(1):18–37.
Crosswell, L., Willis, J., Morrison, C., Gibson, A., and
Ryan, M. (2018). Early career teachers in rural
schools: Plotlines of resilience. In Resilience in ed-
ucation, pages 131–146. Springer.
Fontaine, J. R., Scherer, K. R., Roesch, E. B., and Ellsworth,
P. C. (2007). The world of emotions is not two-
dimensional. Psychological Science, 18(12):1050–
1057.
Gibson, A. (2017). Reflective writing analytics and
transepistemic abduction. PhD thesis, Queensland
University of Technology.
Gibson, A. (2019). Going OK instructions. [Online; ac-
cessed 13-July-2022].
Gibson, A. (2020). GoingkOK. http://www.goingok.org.
[Online; accessed 13-July-2022].
Goyette, N., Jodoin, P.-M., Porikli, F., Konrad, J., and Ish-
war, P. (2012). Changedetection.net: A new change
detection benchmark dataset. In 2012 IEEE Computer
Society Conference on Computer Vision and Pattern
Recognition Workshops, pages 1–8.
Hasan, M., Rundensteiner, E., and Agu, E. (2019). Auto-
matic emotion detection in text streams by analyzing
twitter data. International Journal of Data Science
and Analytics, 7(1):35–51.
Hoenkamp, E. (2003). Unitary operators on the document
space. Journal of the American Society for Informa-
tion Science and Technology, 54(4):314–320.
Hoenkamp, E. (2019). Discovering the geometry of narra-
tives and their embedded storylines. In Fred, A. and
Filipe, J., editors, Proceedings of the 11th Int. J. Conf.
IC3K, volume 1, pages 483–490. SciTePress.
Howard, S. and Johnson, B. (2004). Resilient teachers: re-
sisting stress and burnout. Social Psychology of Edu-
cation, 7(4):399–420.
K
¨
ubler-Ross, E. and Kessler, D. (2005). On Grief and
Grieving: Finding the Meaning of Grief Through the
Five Stages of Loss. Scribner.
Li, X., Hu, W., Shen, C., Zhang, Z., Dick, A., and Hengel,
A. V. D. (2013). A survey of appearance models in vi-
sual object tracking. ACM Trans. Intell. Syst. Technol.,
4(4).
Maciejewski, P. K., Zhang, B., Block, S. D., and Prigerson,
H. G. (2007). An empirical examination of the stage
theory of grief. JAMA, 297(7):716–723.
Mohammad, S. (2018a). The NRC Valence, Arousal,
and Dominance (NRC-VAD) Lexicon. http://
saifmohammad.com/WebPages/nrc-vad.html. [On-
line; accessed 6 december 2020].
Mohammad, S. M. (2018b). Obtaining reliable human rat-
ings of valence, arousal, and dominance for 20,000
english words. In Proceedings of The Annual Confer-
ence of the Association for Computational Linguistics
(ACL), Melbourne, Australia.
Osgood, C., May, W. H., and Miron, M. (1976). Cross-
cultural Universals of Affective Meaning: An Intro-
ductory Atlas of Affective Meanings. University of
Illinois Press.
Pennebaker, J. W. and Francis, M. E. (1996). Cognitive,
emotional, and language processes in disclosure. Cog-
nition and Emotion, 10(6):601–626.
Rudenko, A., Palmieri, L., Herman, M., Kitani, K. M.,
Gavrila, D. M., and Arras, K. O. (2020). Human mo-
tion trajectory prediction: a survey. The International
Journal of Robotics Research, 39(8):895–935.
VandenBos, G. R. and American Psychological Association
(2015). APA dictionary of psychology.
Yarrow, A., Ballantyne, R., Hansford, B., Herschell, P., and
Millwater, J. (1999). Teaching in rural and remote
schools: a literature review. Teaching and Teacher
Education, 15(1):1 – 13.
Zhou, T. and Tao, D. (2011). Godec: Randomized low-
rank & sparse matrix decomposition in noisy case. In
Getoor, L. and Scheffer, T., editors, Proc. 28th Int.
Conf. on Machine Learning (ICML-11), ICML ’11,
pages 33–40, New York, NY, USA. ACM.
Monitoring Mood in a Stream of Self-reflections
299
