
A Multi-stage Multi-group Classification Model: Applications
to Knowledge Discovery for Evidence-based Patient-centered Care
Eva K. Lee
1,2 a
and Brent Egan
3,4 b
1
Center for Operations Research in Medicine and Healthcare, The Data and Analytic Innovation Institute, Atlanta, U.S.A.
2
Georgia Institute of Technology, Atlanta, U.S.A.
3
American Medical Association, Chicago, U.S.A.
4
Medical University of South Carolina, U.S.A.
Keywords: Multi-stage Classification, Multi-group Classification, Imbalanced Data, Discriminant Analysis via Mixed
Integer Program, Cardiovascular Disease, Multi-Site Knowledge Discovery, Best Practice, Alzheimer’s
Disease, Mild Cognitive Impairment, Early Diagnosis of Dementia, Machine Learning for Evidence-based
Practice, Branch-and-Bound.
Abstract: We present a multi-stage, multi-group classification framework that incorporates discriminant analysis via
mixed integer programming (DAMIP) with an exact combinatorial branch-and-bound (BB) algorithm and a
fast particle swarm optimization (PSO) for feature selection for classification. By utilizing a reserved
judgment region, DAMIP allows the classifier to delay making decisions on ‘difficult-to-classify’
observations and develop new classification rules in a later stage. Such a design works well for mixed (poorly
separated) data that are difficult to classify without committing a high percentage of misclassification errors.
We also establish variant DAMIP models that enable problem-specific fine tuning to establish proper
misclassification limits and reserved judgement levels that facilitate efficient management of imbalanced
groups. This ensures that minority groups with relatively few entities are treated equally as the majority
groups. We apply the framework to two real-life medical problems: (a) multi-site treatment outcome
prediction for best practice discovery in cardiovascular disease, and (b) early disease diagnosis in predicting
subjects into normal cognition, mild cognitive impairment, and Alzheimer’s disease groups using
neuropsychological tests and blood plasma biomarkers. Both problems involve poorly separated data and
imbalanced groups in which traditional classifiers yield low prediction accuracy. The multi-stage BB-
PSO/DAMIP manages the poorly separable imbalanced data well and returns interpretable predictive results
with over 80% blind prediction accuracy. Mathematically, DAMIP is NP-complete with its classifier proven
to be universally strongly consistent. Hence, DAMIP has desirable solution characteristics for machine
learning purposes. Computationally, DAMIP is the first multi-group, multi-stage classification model that
simultaneously includes a reserved judgment capability and the ability to constrain misclassification rates
within a single model. The formulation includes constraints that transform the features from their original
space to the group space, serving as a dimension reduction mechanism.
1 INTRODUCTION
Machine learning, using existing electronic medical
records (EMRs) (Lee et al., 2016; Rose, 2018) and
prospectively-collected population health data from
research programs, can identify patterns that predict
outcomes and potentially inform and improve clinical
care. However, most of these strategies must
compromise on data quality (e.g., the amount of
a
https://orcid.org/0000-0003-0415-4640
b
https://orcid.org/0000-0002-1470-5875
missing data from frontline workers and their
imputation by analysts) or breadth (the number of
examined parameters with acceptable missingness)
(Marlin et al., 2011; McDermott et al., 2018; Mohan
et al., 2013). While practice variances may occur
when and if tests are given to patients, missing data
may also reflect access and societal bias (Rajkomar et
al., 2018). Hence, understanding missingness and
certain actions and decisions and their dependencies
Lee, E. and Egan, B.
A Multi-stage Multi-group Classification Model: Applications to Knowledge Discovery for Evidence-based Patient-centered Care.
DOI: 10.5220/0011557200003335
In Proceedings of the 14th International Joint Conference on Knowledge Discovery, Knowledge Engineering and Knowledge Management (IC3K 2022) - Volume 1: KDIR, pages 95-108
ISBN: 978-989-758-614-9; ISSN: 2184-3228
Copyright
c
2022 by SCITEPRESS – Science and Technology Publications, Lda. All rights reserved
95

are critical. Since outcome can be defined and
interpreted differently among stakeholders, objective
outcome discovery is essential. Advances must be
made to accommodate heterogeneous data sources as
it facilitates the creation of a reliable outcome profile
(Lee et al., 2016, 2019; Lee, Yuan, et al., 2012;
Suresh et al., 2017).
Temporal data mining of longitudinal health data
cannot currently be achieved through statistically and
computationally efficient methodologies and is still
under-explored (Lee et al., 2019, 2021). This is a
particularly important issue when analyzing outcome,
health equity, and health conditions for patients with
chronic disease. To accommodate evolving data and
outcome trends, models must also be dynamic and
adaptable. Google Flu Trends’ overestimate
demonstrates this key modeling weakness (Lazer et
al., 2014). To ensure a model is robust, reliable, and
generalizable, independent multiple data sources
should be used to both train the model and to
independently validate its results (Ghassemi et al.,
2020). The model must also be able to be interpreted
by a diverse group of stakeholders for feedback and
refinement purposes.
We present a multi-stage, multi-group
classification framework that incorporates
discriminant analysis via mixed integer programming
(DAMIP) with an exact combinatorial branch-and-
bound (BB) algorithm and a fast particle swarm
optimization (PSO) for feature selection for
classification. By utilizing a reserved judgment
region, DAMIP allows the classifier to delay making
decisions on ‘difficult-to-classify’ observations and
develop new classification rules in a later stage. Such
a design works well for mixed (poorly separated) data
that are difficult to classify without committing a high
percentage of misclassification errors. We also
establish variant DAMIP models that enable
problem-specific fine tuning to establish proper
misclassification limits and reserved judgement
levels that facilitate efficient management of
imbalanced groups. This ensures that minority groups
with relatively few entities are treated equally as the
majority groups.
We apply the framework to two real-life
medical problems: (a) multi-site treatment outcome
prediction for best practice discovery in
cardiovascular disease and (b) early disease diagnosis
in predicting subjects into normal cognition, mild
cognitive impairment, and Alzheimer’s disease
groups using neuropsychological tests and blood
plasma biomarkers. Both medical problems involve
poorly separated data and imbalanced groups in
which traditional classifiers yield low prediction
accuracy. The multi-stage, BB-PSO/DAMIP
manages the poorly separable imbalanced data well
and returns interpretable predictive results with over
80% blind prediction accuracy.
Mathematically, DAMIP is 𝒩𝒫 − 𝑐𝑜𝑚𝑝𝑙𝑒𝑡𝑒
with its classifier proven to be universally strongly
consistent. Hence DAMIP has desirable solution
characteristics for machine learning purposes.
Computationally, DAMIP is the first multi-group
multi-stage classification model that simultaneously
includes a reserved judgment capability and the
ability to constrain misclassification rates within a
single model. The formulation includes constraints
that transform the features from their original space
to the group space, serving as a dimension reduction
mechanism.
2 DESIGN OF CLASSIFICATION
MODELS
Classification is a fundamental machine learning
problem of identifying the group status of new
observations, based on a set of observations of which
the group memberships are known. This technology
has wide-spread applications including marketing
and consumer sectors, agriculture, energy, finance,
psychology and behaviour science, social science,
criminology, electronics, internet-of-things, biology,
and healthcare, etc. (Cui et al., 2018; Dixon et al.,
2020; Hayward & Maas, 2021; Lei et al., 2020;
Myszczynska et al., 2020; Narciso & Martins, 2020;
Qu et al., 2019; Yarkoni & Westfall, 2017; Zhao et
al., 2021).
2.1 Multi-stage Multi-group
Classification Model
2.1.1 Discriminant Analysis via Mixed
Integer Program (DAMIP)
Let 𝜋
be the prior probability of group 𝑔 and 𝑓
(𝒙)
be the conditional probability density function of
group 𝑔, 𝑔∈ 𝒢 for the data point 𝒙∈ℝ
. Let 𝒪
denote the set of observations in group g, and 𝑛
denote the number of observations in group g ∈𝒢.
Let 𝛼
∈ (0, 1) , h, 𝑔∈𝒢 , ℎ≠𝑔 be the
predetermined limit on the misclassifications where
the observations of group 𝑔 are classified to group h.
The group assignment decisions of observations that
are classified into a reserved judgment region are
denoted by group g = 0. Let 𝑢
represent the binary
variable that indicates whether observation i in group
g is classified to group h, ℎ∈
0
∪𝒢. Thus, 𝑢
=
KDIR 2022 - 14th International Conference on Knowledge Discovery and Information Retrieval
96

1 denotes a correct classification for observation i in
group g. The multi-group model with a reserved
judgement region is formulated as:
max 𝑢
∈𝒪
∈ 𝒢
subject to
𝐿
= 𝜋
𝑓
𝒙
−
∑
𝜆
𝑓
𝒙
∈𝒢,
, ∀ ℎ,𝑔 ∈ 𝒢,𝑗 ∈ 𝒪
(1)
𝑦
−𝐿
≤𝑀1−𝑢
, ∀ ℎ, 𝑔 ∈ 𝒢, 𝑗 ∈ 𝒪
(2)
𝑦
≤𝑀1−𝑢
, ∀ 𝑔 ∈ 𝒢, 𝑗 ∈ 𝒪
(3)
𝑦
−𝐿
≥𝜀1−𝑢
, ∀ ℎ, 𝑔 ∈ 𝒢, 𝑗 ∈ 𝒪
(4)
𝑦
≥𝜀 𝑢
,
∀ ℎ,𝑔 ∈ 𝒢, 𝑗 ∈ 𝒪
(5)
∑
𝑢
∈
∪𝒢
= 1, ∀ 𝑔 ∈ 𝒢, 𝑗 ∈ 𝒪
(6)
∑
𝑢
∈𝒪
≤𝛼
𝑛
, ∀ ℎ,𝑔 ∈ 𝒢,𝑔 ≠ ℎ (7)
𝑢
∈
0,1
∀ ℎ ∈
0
∪𝒢,𝑔∈𝒢,𝑗∈𝒪
(8)
𝑦
≥ 0, ∀ ℎ,𝑔 ∈ 𝒢, 𝑗 ∈ 𝒪
(9)
𝜆
≥ 0 ∀ ℎ, 𝑔 ∈ 𝒢,𝑔 ≠ ℎ (10)
Constraints (1) define the loss functions,
constraints (2)-(6) guarantee an observation is
uniquely assigned to the group with the maximum
value of 𝐿
(
𝒙
)
among all groups, and constraints (7)
set the misclassification limits. With the reserved
judgment region in place, the mathematical system
ensures that a solution that satisfies the preset errors
always exists.
2.1.2 Feature Selection via Particle Swarm
Optimization
Feature selection removes redundancy and selects
discriminatory features that can predict group status.
It can (a) improve the prediction performance, (b)
reduce over-fitting, (c) provide a faster predictor, and
(d) improve model interpretability.
There are three main categories of feature
selection algorithms: wrappers, filters, and embedded
methods. Wrapper methods use a search algorithm to
search through the space of features and evaluate the
subsets by running the classification models on them.
Filter methods are similar to wrapper methods, but
instead of evaluating by the classification models, a
simple filter that is independent of the classification
models is evaluated. Many filter methods provide a
feature ranking rather than the best subsets, where top
ranking features can be used in classification models.
Embedded feature selection algorithms (e.g., Lasso
and LAR (Efron et al., 2004; Tibshirani, 2011)) are
built in the classifier during the model construction.
Combinatorically, feature selection is intrinsically
𝒩𝒫 − ℎ𝑎𝑟𝑑 as there are exponential choices to
select among a given set of features. Numerous
algorithms and some of the earliest work including
branch-and-bound (Hocking & Leslie, 1967;
Tibshirani, 2011), greedy procedure and sequential
search (Pudil et al., 1994; Silva & Stam, 1994), and
random search (Siedlecki & Sklansky, 1989) have
been widely studied.
PSO (both continuous and binary) was originally
proposed by Kennedy and Eberhart (Kennedy &
Eberhart, 1997). Because of its computational speed,
numerous variant PSO-based algorithms have been
proposed for feature selection (Agrafiotis & Cedeño,
2002; Correa et al., 2006; Y. Hu et al., 2021; Jain et
al., 2018; Monteiro & Kosugi, 2007).
A Fast Modified PSO: We design a modified
PSO algorithm to solve the feature selection
algorithm where the number of selected features is
determined. We implement a PSO/DAMIP
framework that uses the modified PSO algorithm for
feature selection and the DAMIP model for
classification. For particle i, let 𝒗
denote the velocity
and 𝒙
represent a binary vector of length m, where m
is the number of features. Let 𝑥
denote whether the
jth feature is selected in particle i. In each iteration of
the modified PSO algorithm, a DAMIP model is
solved using the selected features in each particle.
Particle i records the current selected features 𝒙
and
the best achieved objective function value of DAMIP
thus far is denoted by 𝑦
. Then 𝒗
and 𝒙
in the next
iteration is determined by a random combination of
𝒗
, 𝒙
, 𝒑
, and 𝒑
(
)
in the current iteration where
𝑛
(
𝑖
)
is the set of particles in the neighbourhood of
particle i and 𝒑
is the best position of particle i thus
far. The von Neumann neighbourhood topology was
adopted to construct the particles.
A Combinatorial Exact BB Algorithm: To
compare the performance of the feature selection
heuristics, we also implemented the state-of-the-art
BB solver within DAMIP with an additional
constraint to limit the number of features that will be
selected during the solution process. We use this to
contrast the performance of the modified PSO
heuristics.
2.1.3 The Multi-Stage Classification Model
The multi-stage classification model aims to improve
the performance of the BB-PSO/DAMIP framework
by utilizing the reserved judgment region in DAMIP.
A DAMIP model bisects the data set into an ‘easy–
to-classify’ subset that it classifies to specific groups,
and a ‘difficult-to-classify’ subset that it classifies to
a reserved judgment region. It delays making a group
assignment decision to subjects that are difficult to
classify by the DAMIP with the selected features. In
the multi-stage model we propose, those subjects are
moved to the next stage where a new feature set is
selected and a new DAMIP classifier is developed. In
A Multi-stage Multi-group Classification Model: Applications to Knowledge Discovery for Evidence-based Patient-centered Care
97

this way, the multi-stage framework constructs a
chain of successive classifiers using different subsets
of features. The classifier at the ith stage, denoted by
𝑓
, can be represented by a discriminant function
𝑓
(
𝒙
,𝝀
𝒊
)
, which is determined by the feature subset
𝒙
, and the decision variables 𝝀
𝒊
in DAMIP. More
stages do not necessarily produce a better model. At
each stage, the framework selects the better of two
models: a single-stage model that solves a DAMIP
model without a reserved judgment region and a
multi-stage model that solves a DAMIP model with a
reserved judgment region. The algorithm naturally
terminates when there are no observations in the
reserved judgment region. As more stages are
processed, fewer observations remain for DAMIP,
and the constructed model consists of too many
successive classifiers. This may result in over-fitting.
Hence, we propose two additional stopping criteria to
terminate the process: (a) the number of observations
is less than a pre-set minimum number, denoted by n,
and (b) the maximum allowed depth, denoted by d is
reached. The parameters n and d are pre-determined
according to the number of observations and the
number of input features in the given data.
2.2 Modified DAMIP Models
The size of the reserved judgment region is bounded
by the misclassification rates specified in constraints
(7). DAMIP is able to return good classification
results through problem-specific fine tuning of the
misclassification rates, especially when the groups
are unbalanced. To ease this fine-tuning process, we
envision that the classifiers in our multi-stage model
have the ability of balancing misclassifications and
‘difficult to classify’ observations in order to
maximize the prediction accuracy through a multi-
stage structure. For group g, let 𝛼
be the
misclassification rate, 𝛽
be the proper/correct
classification rate, and 𝛾
be the ‘difficult to classify’
rate, i.e., the percentage of observations placed in the
reserved judgment region. These three parameters can
be defined in DAMIP as follows:
𝛼
=
∑∑
𝑢
𝒪
𝒢,
(11)
𝛽
=
∑
𝑢
𝒪
(12)
𝛾
=
∑
𝑢
𝒪
(13)
Recall 𝒪
is the set of observations of group g and n
g
is the size of group g (i.e., n
g
= | 𝒪
|). The three
parameters satisfy that 𝛼
+ 𝛽
+𝛾
=1 for each
group g. We propose three modified DAMIP models
to (a) better utilize the reserved judgment region and
(b) handle imbalanced groups more efficiently.
2.2.1 Variant 1: The Base Model
V1: 𝑚𝑎𝑥 min
∈ 𝒢
𝛽
,
subject to constraints (1) - (6), (8)
- (10), and (12). This base model aims to generate an
optimal classification rule without using
misclassification limits and reserved judgment. The
objective is to maximize the minimum value of
correct classification rates 𝛽
among all groups. It
ensures that the minority groups are treated equally as
the majority groups, and hence it can perfectly deal
with imbalanced groups. It produces a lower bound of
the prediction accuracy of each group, and the
optimal values 𝛽
and the associated 𝛼
can be used
in the misclassification limits in DAMIP.
2.2.2 Variant 2: The β - α Model
𝑽𝟐: 𝑚𝑎𝑥 min
∈ 𝒢
𝛽
− 𝛼
subject to constraints (1)
– (6), and (8) – (12). The 𝛽−𝛼 model maximizes the
minimum difference between 𝛽
and 𝛼
by moving a
small proportion of observations into the reserved
judgment region. Instead of using the
misclassification constraints, it incorporates both 𝛼
and 𝛽 into the objective function to keep the reserved
judgment region from getting too large that it
weakens the performance of the model.
2.2.3 Variant 3: The γ Model
𝑽𝟑: 𝑚𝑎𝑥
∑
𝛽
∈ 𝒢
subject to constraints (1) – (6),
(8) – (10), (12), and (13), plus the new constraint
∑
𝑢
∈𝒪
≤𝛾
𝑛
,∀𝑔 ∈ 𝒢.
The 𝛾 model maximizes the prediction accuracy
while limiting the size of the reserved judgment
region by adding constraints on the percentage of
reserved judgment 𝛾
for each group g. It provides
accurate control of the reserved judgment region to
avoid too many stages in the model. The maximum
percentage 𝛾
for each group g is predetermined
according to the size of the problem. Thus the 𝛾
model resembles the original DAMIP model except it
constrains the reserved judgment region instead of
constraining the misclassification rates for each
group.
KDIR 2022 - 14th International Conference on Knowledge Discovery and Information Retrieval
98
2.2.4 Special Case: Solutions for 2 Groups
For two groups, the modified DAMIP models can be
solved in polynomial time. The constraints that define
𝐿
(
𝑥
)
can be written as:
𝐿
=𝜋
𝑓
(
𝑥
)
−𝜆
𝑓
(
𝑥
)
∀ 𝑖 ∈ 𝒪
𝐿
=𝜋
𝑓
(
𝑥
)
−𝜆
𝑓
(
𝑥
)
∀ 𝑖 ∈ 𝒪,
where optimal 𝜆
and 𝜆
are determined in
DAMIP. We prove that the optimal 𝜆
and 𝜆
in a
two group DAMIP model that maximizes the total
correct classifications can be found by searching on
the sorted array 𝑓
/𝑓
where 𝑓
and 𝑓
are the density
functions in constraint (1) of group 1 and 2
respectively.
Briefly, when no reserved judgment region is used
in the modified DAMIP model, we define a partition
p on the sorted array 𝑓
/𝑓
such that observations
having 𝑓
(
𝑥
)
/𝑓
(
𝑥
)
≤ 𝑝 are classified to group 1,
and observations having 𝑓
(
𝑥
)
/𝑓
(
𝑥
)
>𝑝 are
classified to group 2. By searching on the sorted array
𝑓
/𝑓
, p* can be found such that the objective
function which is the minimum of the correct
classifications of the two groups in the base model is
maximized. An optimal solution of (𝜆
,
𝜆
) then
can be determined by
=𝑝
∗
.
When a reserved judgment region is used in the
DAMIP models, we define two partitions 𝑝
and 𝑝
of the sorted array 𝑓
/𝑓
: observations having
𝑓
(
𝑥
)
/𝑓
(
𝑥
)
≤ 𝑝
are classified to group 1,
observations having 𝑝
<𝑓
(
𝑥
)
/𝑓
(
𝑥
)
≤𝑝
are
classified to the reserved judgment region, and
observations having 𝑓
(
𝑥
)
/𝑓
(
𝑥
)
> 𝑝
are
classified to group 2. By searching on the sorted array
𝑓
/𝑓
, (𝑝
∗
, 𝑝
∗
) can be found such that the objective
function is optimized. An optimal solution of
(𝜆
,
𝜆
) then can be determined by
=𝑝
∗
and
=𝑝
∗
.
The optimal partition may not be unique: any
partition 𝑝∈[𝑙
,𝑙
) results in the same objective
function value as 𝑝
∗
∈[𝑙
,𝑙
) where 𝑙
is the
maximum value of 𝑓
/𝑓
of observations that is less
than or equal to 𝑝
∗
and 𝑙
is the minimum value of
𝑓
/𝑓
of observations that is greater than 𝑝
∗
. A proper
way of determining 𝑝
∗
when searching on the sorted
array is to choose the mid-point 𝑝
∗
=
. The
complexity of this algorithm is O(nlogn): it takes
O(nlogn) to sort the array 𝑓
/𝑓
, and O(n) to search
through the array to find the partition that reaches the
optimal objective.
2.3 Running Multi-Stage
BB-PSO/DAMIP on Real-world
Problems
We apply the classification framework to real-world
problems, focusing on instances that challenge
existing classifiers where they perform poorly due to
imbalanced data and the very mixed nature of the
groups. By design, the DAMIP classifier partitions
the group space in a non-linear and segmented
manner, where observations belonging to the same
group could be classified under different conditions.
This is useful in medical applications. For example,
patients with the same outcome could have very
diverse sets of lab or treatment results. It is the entire
system that one must examine to classify properly.
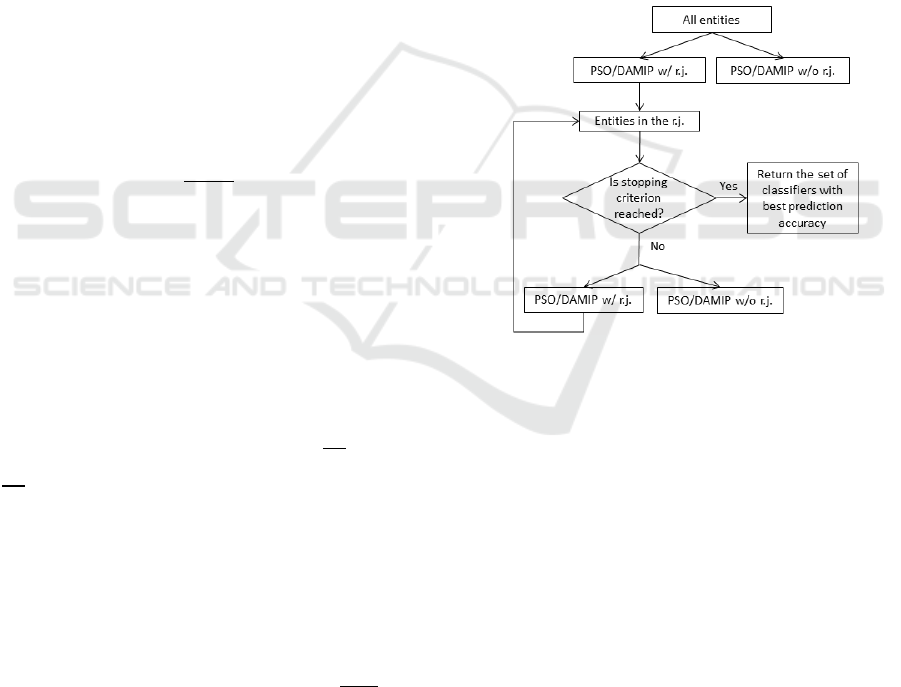
Figure 1 shows the multi-stage DAMIP approach.
Figure 1: The algorithm selects the better of the two at each
stage to continue. Termination can be triggered by the
number of stages reached or the size of unclassified entities.
3 RESULTS FOR DISEASE
DIAGNOSIS AND TREATMENT
OUTCOME PREDICTION
For brevity, we discuss two applications:
cardiovascular disease and Alzheimer’s disease. The
cardiovascular disease analyses involve over 737
clinical sites of -patient data. They showcase the need
for unsupervised learning to uncover the group status
prior to machine learning, since the data were
originated from diverse sites with a heterogeneous
interpretation of outcome status. The Alzheimer’s
disease study distinguishes itself from other work as
our analyses involve raw neuro-psychological data
instead of the overall clinical scores. Furthermore, we
A Multi-stage Multi-group Classification Model: Applications to Knowledge Discovery for Evidence-based Patient-centered Care
99

couple these low-cost non-invasive exams/tests with
the blood plasma biomarkers for comprehensive
analyses.
3.1 Cardiovascular Disease
“Cardiovascular diseases (CVD) are the leading
cause of death globally, taking an estimated 17.9
million lives each year. CVDs are a group
of disorders of the heart and blood vessels and include
coronary heart disease, cerebrovascular disease,
rheumatic heart disease and other conditions.”(World
Health Organization, 2022a) In the United States,
coronary heart disease is the leading cause of death
for men, women, and people of most racial and ethnic
groups, and affects about 20.1 million adults aged 20
and older (Tsao et al., 2022). Statistics show that
CVD affects nearly half of American adults
(American Heart Association News, 2019).
In our previous work, we have developed a
comprehensive, efficient “pipeline” for extracting,
de-identifying, and standardizing EMR data. The
system established interoperability for over 2.7
million patient data from the Care Coordination
Institute (CCI) covering = 737 clinical sites (Lee et
al., 2016, 2019, 2021). That prior work also
addressed challenges associated with temporal
laboratory time series data and unstructured text data
and described a novel approach for clustering
irregular Multivariate Time Series (MTS).
The CCI-health database contains 37,742
patients with CVD. Through our mapping, each
patient is eventually characterized by 11 raw features
including demographics, treatment duration, and co-
existing conditions, and 1,757 standardized features
described in Systematized Nomenclature of
Medicine-Clinical Terms (SNOMED-CT), including
laboratory tests, diagnosed problems, and
medications. These 1,757 standardized features were
mapped from 19,800 raw features from the database.
For each patient, treatment duration was determined
by calculating the elapsed time between diagnosis
(indicated by the first prescription of a medication)
and the last recorded activity (i.e., procedure, lab,
etc.).
Measurements of lipids and lipoproteins were
processed into time series since these are closely
related to cardiovascular conditions and can
potentially be used to characterize the severity of
CVD (Gordon et al., 1977). A low level of high-
density lipoproteins (HDL) is significantly associated
with the development of heart disease. A high level
of low-density lipoprotein (LDL) increases the risk of
heart disease. A high level of Triglycerides is also
associated with the incidence of heart disease but has
a less significant effect.
We used HDL, LDL, and Triglyceride
measurements to form an MTS containing three time
series for each patient. Each of these time series was
resampled to quarterly frequency. Gaps in the data
were filled by propagating the non-NaN values
forward first, and then backward, along each time
series. For each of the three types of laboratory
measurements, we removed patients with fewer than
three measurements after resampling from the
dataset. This produces a data set containing 450
patients. The global alignment kernel (GAK) distance
between each pair of corresponding time series was
calculated (Lee et al., 2021; Nwegbu et al., 2022).
The pairwise distance between each pair of MTS was
then obtained by averaging the three distances for
each pair of corresponding univariate time series.
Specifically, given two patients, P
1
and P
2
, each with
m lab measurement time series, their pairwise
distance was calculated using the following equation:
Distance (P
1
, P
2
)=
(
∑
𝐷
(𝑃
𝑃
)
).
3.1.1 Clustering to Establish Treatment
Outcome Groups
K-medoids clustering performed on the CVD
distance matrix partitioned the patients into three
groups. The clinical experts examined the raw
laboratory records for each group and associated the
cluster characteristics as “Good,” “Medium,” or
“Poor” outcomes (blue, red, or green). We caution
that such interpretation by clinical experts is of
paramount importance. Figure 2 show the raw HDL,
LDL, and Triglyceride laboratory records by cluster.
The “Poor Outcome” group is well-segregated from
the other two groups, showing high variability in
HDL and LDL levels, which is a high-risk factor for
myocardial infarction. Although the ”Good” and
“Medium” outcome groups have similar trajectories
of cholesterol levels, the “Good” outcome group has
slightly higher HDL levels, lower LDL and
Triglyceride levels, and shows more consistency in
all three types of cholesterol levels. Table 1 shows the
patient partition for machine learning training and
blind prediction.
KDIR 2022 - 14th International Conference on Knowledge Discovery and Information Retrieval
100
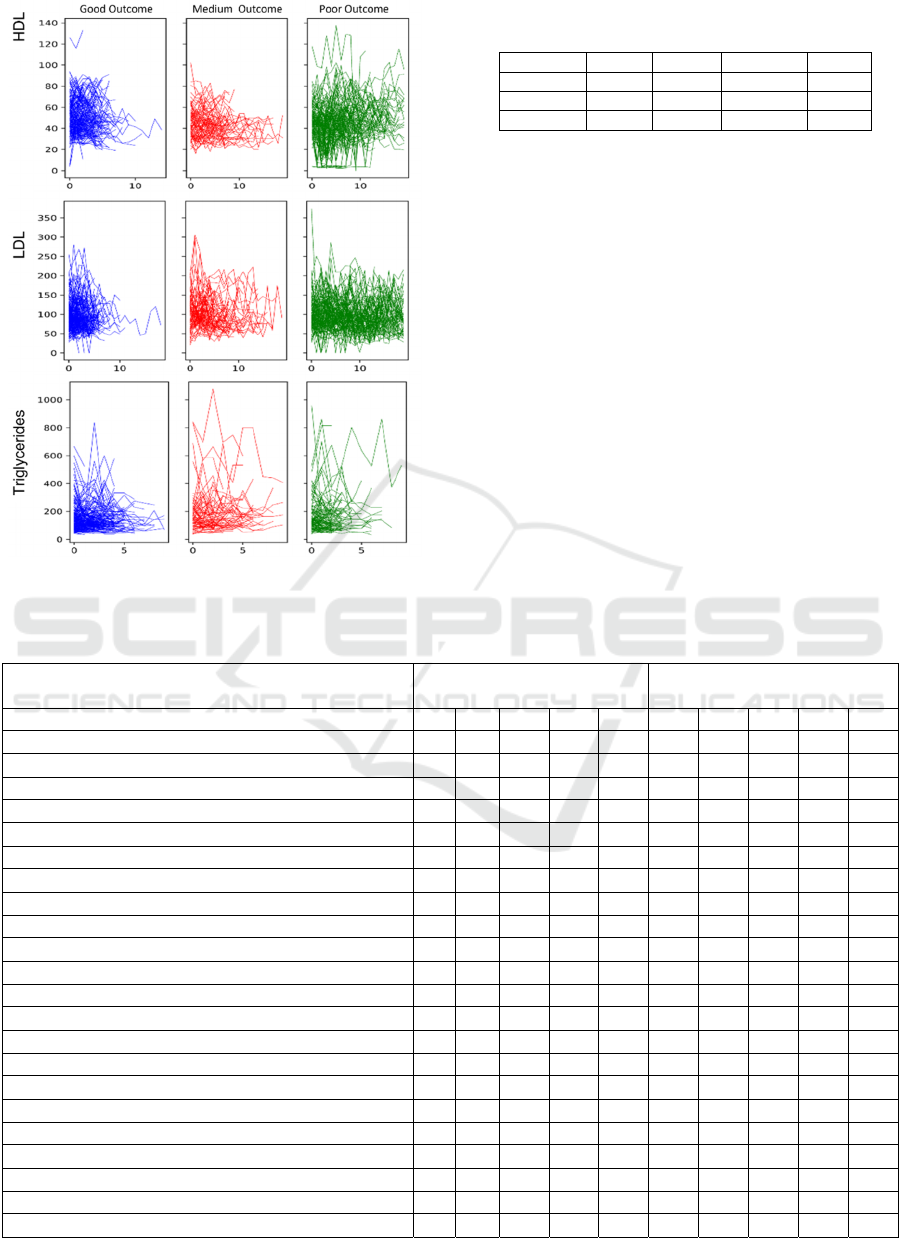
Figure 2: HDL, LDL, and Triglyceride laboratory records
for each patient cluster.
Table 1: Partition of CVD patients for machine learning
training and blind prediction.
Total Good Medium Poor
Training 314 60 158 96
Blind se
t
136 19 75 42
Total 450 79 233 138
3.1.2 Predicting Treatment Outcome Across
Multiple Sites
The goal of machine learning is to uncover
discriminatory features that can predict good
outcomes. This is critical for evidence-based, best
practice discovery and for the dissemination of good
clinical practice evidence across different sites. For
classification, we considered the “Good Outcome”
group versus the other two groups, the “Medium” and
“Poor” outcome clusters.
Table 2 summarizes the machine learning results
for the CVD patients using DAMIP, coupled with
either an exact combinatorial (BB) feature-selection
algorithm or the PSO feature-selection heuristic
described herein. We contrasted the accuracy of 10-
fold cross-validation and DAMIP blind prediction.
Table 2: BB-PSO/DAMIP classification rules in predicting CVD Treatment outcome.
Discriminatory feature
(chosen from 1,768 features)
Exact combinatorial branch-
and-bound search BB/DAMIP
Heuristics particle swarm
optimization PSO/DAMIP
Treatment Length X X X X X X X X X X
Glucose measurement, urine (procedure) X X X X X X X X
Synthetic steroid (substance) X X X X X X
Acute digestive system disorder (disorder) X
X
Inflammatory disorder of upper respiratory tract (disorder) X X X X X X
Calcium channel blocking agent (product) X X X
Neoplasm by body site (disorder) X X
Diabetic - poor control (finding) X X
Implantation (procedure) X X
Investigations (procedure) X X
Acute disorder of ear (disorder) X
Disorder of immune system (navigational concept) X
Allergen or pseudo allergen (substance) X
Oral form naproxen (product) X
Electrocardiogram finding (finding) X X
Disinfectants and cleansers (product) X X
Imaging (procedure) X X
Accuracy of 10-fold cross validation (%), Good Outcome 85.3 87.6 87.6 89.9 87.6 90.3 90.3 90.3 90.3 89.4
Accuracy of 10-fold cross validation (%), Medium Outcome 91.6 86.4 85.4 86.4 85.4 86.4 86.4 86.4 86.4 86.4
Accuracy of 10-fold cross validation (%), Poor Outcome 89.3 84.2 85.3 84.6 86.1 86.0 88.3 85.7 85.3 87.2
Accuracy of blind prediction (%), Good Outcome 89.3 91.4 91.4 93.6 91.4 91.9 93.6 92.5 92.5 92.5
Accuracy of blind prediction (%), Medium Outcome 97.6 92.8 92.8 90.4 92.8 92.5 90.4 90.4 95.2 97.6
Accuracy of blind prediction (%), Poor Outcome 91.2 88.3 90.6 89.7 90.8 91.0 92.1 89.7 94.9 92.5
A Multi-stage Multi-group Classification Model: Applications to Knowledge Discovery for Evidence-based Patient-centered Care
101

DAMIP classified patients into “Good Outcome”
vs. “Medium” and “Poor” Outcomes by uncovering a
set of discriminatory features that yields a blind
prediction accuracy of 88.3% to 97.6%. Each rule (a
column) consists of 3-7 discriminatory features. The
multiple rules with relatively small subsets of
discriminatory features afford flexibility for different
sites (and different patient populations) to adopt
different policies for implementing the best practice.
BB/DAMIP and PSO/DAMIP produce similar
results, although results from BB/DAMIP tend to
have fewer features than those from PSO/DAMIP.
We contrasted the BB-PSO/DAMIP results with
eight commonly used classifiers: Logistic
Regression, SVM, K-nearest neighbours, Random
Forest, Decision Tree, Neural Network, Gradient
Boosting, and Bernoulli Naïve Bayes. Table 3 shows
the best two results among these eight classifiers.
Specifically, Decision Tree and Random Forest
yielded 10-fold cross-validation unbiased estimates
of 65% and 63% for the “Good Outcome” and 80%-
90% for the “Medium” and “Poor” outcome groups
respectively. The blind prediction fared worse, with a
roughly 50% predictive accuracy for the “Good
Outcome” group. The remaining six classifiers
suffered similarly from imbalanced data, and the
accuracy for “Good Outcome” was uniformly below
40%. In all cases, Randomized Lasso was used for
feature selection, and it selected twenty-five
discriminatory features. In contrast, the BB-
PSO/DAMIP results offer higher accuracy using
fewer discriminatory features.
Table 3: Performance of the top two classifiers among the
eight. All analyses used Randomized Lasso for feature
selection with 25 features selected.
10-fold Cross-Validation Blind Prediction
Goo
d
Medium Poo
r
Goo
d
Medium Poo
r
Extraclass results
65.1% 88.7% 82.9% 56.3% 91.5% 88.9%
Random Forest results
63.5% 90.3% 84.7% 50.0% 89.4% 81.5%
3.2 Alzheimer’s Disease
In 2019, Alzheimer's disease (AD) and other forms of
dementia ranked as the 7th leading cause of death,
affecting over 55 million people worldwide.
Globally, 65% of deaths from Alzheimer’s and other
forms of dementia are among women (World Health
Organization, 2022b). AD is a progressive and
irreversible brain disease which causes memory loss
and other cognitive problems severe enough to affect
daily life. Dementia is a collection of symptoms of
cognitive function problems, such as thinking,
remembering, or reasoning problems, and AD is the
most common cause of dementia. Mostly AD occurs
in people over 65, although familial AD has an earlier
onset. Currently, AD is incurable; drugs are used to
manage the symptoms or to prevent or slow the
progress of the disease.
Mild cognitive impairment (MCI) is a condition
that has clear evidence of cognitive problems, most
often involving short term memory, but normal day-
to-day functioning is preserved. MCI is a situation
between normal aging and dementia. People with
MCI may or may not develop dementia in the future,
but people with MCI are at higher risk of developing
dementia than those without.
The evaluation of AD or MCI is based on patient
information including a complete medical history,
neuropsychological exam, laboratory tests,
neuropsychological tests, brain scans (CT or MRI),
and information from close family members.
Neuropsychological changes in the expression of
cognitive declines are important to the diagnosis of
AD and MCI. Statistical analyses as predictive
analysis tools have been applied to
neuropsychological data to understand MCI patients
(Kluger et al., 1999; Lopez et al., 2006). In addition
to statistical analyses, classification models have been
applied to neuropsychological data for predicting
brain damage (Lee, Wu, et al., 2012; Lee & Wu,
2009; Stuss & Trites, 1977; Tabert et al., 2006) and
whether nondemented elderly patients declined to a
diagnosis of dementia or Alzheimer’s disease.
In addition to the traditional diagnosis, the clinical
diagnosis of MCI and AD is increasingly aided by
biomarkers predictive of underlying pathology.
Several recent studies generated additional
enthusiasm for a blood-based test to predict
nondemented controls and those with AD (W. T. Hu
et al., 2016; Palmqvist et al., 2020; Ray et al., 2007;
Reddy et al., 2011; Rocha de Paula et al., 2011;
Schindler & Bateman, 2021). However, identifying
MCI and AD remains challenging. Hu (W. T. Hu et
al., 2012) measured levels of 190 plasma proteins and
identified 17 analytes associated with the diagnosis of
MCI or AD.
We apply the multi-stage classification model to
predict the control, MCI, and AD groups, using two
data sets: The first one is de-identified
neuropsychological test data conducted by Emory
Alzheimer's Disease Research Center. The second
one is plasma biomarkers information collected by
two independent centers (University of Pennsylvania,
Philadelphia; Washington University, St. Louis,
MO).
KDIR 2022 - 14th International Conference on Knowledge Discovery and Information Retrieval
102

3.2.1 Predictive Analysis using
Neuro-psychological Data
The neuropsychological tests conducted in this data
set include the Mini Mental State Examination
(MMSE), clock-drawing test, Word List Memory
tasks by the Consortium to Establish a Registry for
Alzheimer's Disease (CERAD), and Geriatric
Depression Scale (GDS). The MMSE is a screening
tool for cognitive impairment. It is brief, but covers
five areas of cognitive function, including orientation,
registration, attention and calculation, recall, and
language. The clock drawing test assesses cognitive
functions, particularly visuospatial abilities, and
executive control functions. The CERAD Word List
Memory tasks assess learning ability for new verbal
information. The tasks focus on repetition, word list
recall, and word list recognition. The GDS is a
screening tool to assess depression in the older
population.
Data of 267 subjects with known groups were
collected as shown in Table 4. Among the 267
subjects, two-thirds of the subjects in each group are
randomly selected as the training set for 10-fold
cross-validation, while the remaining subjects are
used for blind prediction. 107 features are included
for feature selection and classification. Among the
107 features are 3 features representing age, gender,
years of education, 15 features from the Clock
drawing test, 11 features from the GDS, 13 features
from the MMSE, and 65 features from the Word List
Memory tasks.
Table 4: Group information of 267 subjects in the
neuropsychological data set.
Total Control MCI AD
MCI or
AD
Training 178 72 51 55 106
Blind se
t
89 36 26 27 53
Total 267 108 77 82 159
Table 5: Prediction accuracy of the best feature sets via
PSO/DAMIP.
10-fold Cross-Validation Blind Prediction
Ctrl MCI AD Ctrl MCI AD
87.8% 80.0% 88.3% 88.2% 80.6% 90.9%
89.2% 80.0% 86.7% 85.3% 80.6% 90.9%
464 discriminatory feature sets, each with no more
than 10 features that can correctly predict over 80%
of the subjects in both 10-fold cross-validation and
blind prediction, are found by the PSO/DAMIP
framework. We highlight two Pareto best prediction
accuracy results in Table 5. They are associated with
multiple feature sets. We list two sets here for the
purpose of explanation: “cClockNumbers4,
cClockCenter, GDS6, ‘Score for What is the year?’,
MMSE Total, cWL1Ar, cWL1Ticket, cWL2Ticket,
cWLrTotal. cWRyCabin”, and “cClockNumbers4,
cClockHands4, cClockCenter, ‘Score for What is the
month?’, ‘Score for Where are we?’, MMSE Total,
cWL1Ticket, cWLrTotal, cWRyButter,
cWRnVillage”.
The overall prediction accuracy of 10-fold cross-
validation and blind prediction are over 85%, with the
blind prediction accuracy of each group ranging from
80.6% to 90.9%. The prediction accuracy no
longer improves when more features are used in the
classification model. In Table 6, we highlight the
features that most frequently occur in the 464 feature
sets.
Table 6: Features with the highest occurrences in the 464
discriminatory feature sets.
Feature Test Occurrences
MMSE Total MMSE 100.0%
cWLrTotal Word List 94.4%
cWL1Ticket Word List 94.2%
cClockCenter Clock 76.1%
Score for What is the year? MMSE 59.5%
Score for What is the month? MMSE 53.4%
The features selected highlight the test modules or
specific questions/tasks that are most predictive. One
advantage in our findings is that they are easily
interpreted and understood by clinicians as well as
patients. Thus, these discriminatory features can
serve as an early detection tool that family members
and providers can use to monitor for disease in
patients.
3.2.2 Predictive Analysis using Plasma
Biomarkers
Data of 352 subjects with complete information are
collected as shown in Table 7. We use the same
partition strategy to establish the training set and the
blind prediction set. Thirty-one features for feature
selection are included: gender, age, education years,
MMSE, and 10 indicators and 17 analytes that were
identified by Hu (W. T. Hu et al., 2012).
Table 7: Group information of 352 subjects in plasma
biomarkers data set.
Total Control MCI AD
MCI
or AD
Training 250 35 133 82 215
Blind se
t
102 21 62 19 81
Total 352 56 195 101 296
A Multi-stage Multi-group Classification Model: Applications to Knowledge Discovery for Evidence-based Patient-centered Care
103

92 discriminatory feature sets, each with no more
than 10 features that can correctly predict with
accuracy ranging from 82.9% - 91.5% in 10-fold
cross-validation and 81% to 94.7% in blind
prediction, are found by the PSO/DAMIP framework.
Table 8 presents the best prediction accuracy,
which associates with 3 feature sets: “MMSE,
ApoE_1, tTau, Ab42, BNP, Resistin, IGFBP2,
tTauG91, LoAbHiTau, SAP3”, “MMSE, ApoE_1,
tTau, Ab42, BNP, SAP, IGFBP2, TauG91,
LoAbHiTau”, and “MMSE, ApoE_1, tTau, Ab42,
IGFBP2, tTauG91, LoAbHiTau, BNP3, Resistin3,
SAP3.” Note that the 3 sets share 80% of the selected
features.
Table 9 highlights the features that most
frequently occur in the 92 feature sets.
Table 8: Prediction accuracy of the best feature sets via
PSO/DAMIP.
10-fold Cross-Validation Blind Prediction
Ctrl MCI AD Ctrl MCI AD
91.4% 82.9% 91.5% 81.0% 85.8% 94.7%
Table 9: Features with the highest occurrences in the 92
discriminatory feature sets.
Feature Occurrences
ApoE_1 100.0%
tTau 100.0%
Ab42 100.0%
IGFBP2 100.0%
tTauG91 100.0%
LoAbHiTau 100.0%
MMSE 100.0%
BNP 59.8%
Resistin 52.2%
SAP3 52.2%
The analyses using two independent patient sets
of data illustrate that MMSE can act as a low-cost
procedure to be added to annual physical exams for
the aged population. It offers good predictive power
for the brain’s cognition status. Early detection of
MCI offers the opportunity for treatment to slow
down the onset of AD.
4 CONCLUSIONS
Technological advances in prevention, diagnosis, and
treatment of diseases help predict disease, prolong
life, and promote health. However, with an increase
in the volume and complexity of data and evidence,
medical decision making can be a complex process.
Many decisions involve uncertainties and trade-offs
and can have profound consequences to patients and
the clinical practice. To make such complex
decisions, providers must balance the potential harm
and benefit of medical interventions. Computational
methods such as mathematical programming,
simulation, and classification have found broad
applications in these areas.
In this paper, we present a multi-stage, multi-
group classification framework that incorporates
particle swarm optimization (PSO) for feature
selection and discriminant analysis via mixed integer
programming (DAMIP) for classification. By
utilizing a reserved judgment region, it allows the
classifier to delay making decisions on ‘difficult-to-
classify’ observations and develop new classification
rules in a later stage. Such a design works well for
mixed (poorly separated) data that are difficult to
classify without committing a high percentage of
misclassification errors. We also establish variant
DAMIP models that enable problem-specific fine-
tuning to establish proper misclassification limits and
reserved judgement levels that facilitate efficient
management of imbalanced groups. By design,
DAMIP ensures that minority groups with relatively
few entities are treated equally as the majority groups.
We apply the framework to two real-life medical
problems: (a) multi-site treatment outcome prediction
for best practice discovery in cardiovascular disease,
and (b) early disease diagnosis in predicting subjects
into normal, mild cognitive impairment, and
Alzheimer’s disease groups using
neuropsychological tests and blood plasma
biomarkers. Both problems involve poorly separated
data and imbalanced groups in which traditional
classifiers yield low prediction accuracy. The multi-
stage PSO/DAMIP manages the poorly separable
imbalanced data well and returns interpretable
predictive results with over 80% blind prediction
accuracy. A note of comparison, the frequently used
Pap Smear test has an accuracy of roughly 70%.
Gallagher, Lee, and Patterson first established the
original DAMIP multi-group model (Gallagher et al.,
1997). They introduced a linear-programming
approximation to provide a rapid solution capability
(Lee et al., 2003). This study materializes the multi-
stage construct and integrates both an exact
combinatorial branch-and-bound algorithm and a fast
feature selection heuristic along with a systematic
multi-stage schema, with a set of problem-specific,
fine-tuning models to guide its practical usage.
Mathematically, DAMIP is 𝒩𝒫 − 𝑐𝑜𝑚𝑝𝑙𝑒𝑡𝑒 with
its classifier proven to be universally strongly
consistent. Hence DAMIP has desirable solution
characteristics for machine learning purposes.
KDIR 2022 - 14th International Conference on Knowledge Discovery and Information Retrieval
104

Computationally, DAMIP is the first multi-
group, multi-stage classification model that
simultaneously includes a reserved judgment
capability and the ability to constrain
misclassification rates within a single model. Further,
Constraint (1) serves to transform the features from
their original space to the group space, serving as a
dimension reduction mechanism.
Nevertheless, the problem remains
computationally intractable. Although each iteration
of feature selection can be achieved rapidly when
heuristics are employed, the wrapper design
evaluation via DAMIP is computationally intensive.
For both the cardiovascular and Alzheimer’s disease
problems, the solution time to establish final
classification rules can take days of CPU time in a
cloud environment. Nonetheless, the high quality of
the blind predictive results is promising and usable
for clinical stakeholders who must carefully make
critical decisions.
For the multi-site cardiovascular study, the
ability to uncover a best practice that pinpoints a
specific clinical process, treatment regimen and
duration, and drug types helps to establish improved
clinical practice guidelines for adoption by other
sites. This accelerates patient-centered, evidence-
based care. For Alzheimer’s disease, an early
diagnosis of MCI can lead to proactive treatment that
can slow down or prevent the onset of Alzheimer’s.
The neuropsychological data features selected can
serve as an early detection tool for family members
and providers to monitor as they care for the elderly
population. All of which can have significant impact
on quality of life and medical outcome.
We remark that although balancing class size via
majority under-sampling, minority oversampling, and
synthetic minority oversampling techniques
(SMOTE) are commonly employed (Basha et al.,
2022; Fujiwara et al., 2020; Yi et al., 2022), these
approaches pose serious weaknesses (Gao et al.,
2020). Under-sampling of the majority class may
discard useful information about the data itself, which
could be necessary and important to establish an
unbiased classifier. It is also possible that the chosen
sample (after under-sampling) could be biased.
Oversampling may increase the likelihood of
overfitting, while synthetic patient data alters the
actual practice patterns, skews the classifiers, and
impedes implementation potential (Gao et al., 2020).
IBM Watson’s failure reinforces the premise that real
data and interoperability is of paramount importance
in driving machine learning technology (O’Leary,
2022; Sweeney, 2017).
In our two applications, the imbalanced data is
compounded further by the fact that they are poorly
separable. After the first stage classification, about
46% of “Good” outcome from the cardiovascular
disease were placed in the reserved judgement region.
And for the Alzheimer’s disease, about 54% MCI and
37% of AD were mixed together. We note that the
hardest and most critical knowledge is the earliest
diagnosis of mild cognitive impairment as it affords
early intervention to lower the risk of manifestation
to AD. These data underscore the poorly separable
concept and the advantage of a multi-stage approach,
In comparison, SMOTE approaches did not
yield improved predictive results on these
applications. There is no good way to generate
artificial patients that are representative of real
diseased patients. While we appreciate other
investigators’ efforts in creating data sets to mimic
real patients (for imbalanced data, or for increasing
the sample size), we cannot afford to do so since there
is a very serious danger of creating artificial patients
for actual clinical decision support. Our goal is to find
meaningful results that can be used in actual clinical
settings using real patient data that represent the
population. The multi-stage multi-group DAMIP
offers promising results.
Once the DAMIP classification rules are
established, the blind prediction process takes only
nanoseconds, making usage practical in real-time. In
our experience where we implemented the machine
learning toolkit for day-to-day use, many of the
predictive rules developed do not require constant
refinement or re-runs, rather they only need periodic
updates. Our goal is a high-quality robust
interpretable solution that can predict with
confidence. We are currently developing new
hypergraphic theoretical and computational results to
efficiently solve these intractable instances (Shapoval
& Lee, 2021).
ACKNOWLEDGEMENTS
A portion of the results from this project (the machine
learning advances, and the results obtained for
cardiovascular disease) received the first runner-up
prize at the 2019 Caterpillar and INFORMS
Innovative Applications in Analytics Award. This
work is partially supported by grants from the
National Science Foundation (IIP-1361532).
Findings and conclusions in this paper are those of the
authors and do not necessarily reflect the views of the
National Science Foundation. The authors would like
to acknowledge the participation of Fan Yuan and
Zhuonan Li on this project. The authors also thank Dr.
Allan Levey, Dr. Felicia Goldstein, and Dr. William
A Multi-stage Multi-group Classification Model: Applications to Knowledge Discovery for Evidence-based Patient-centered Care
105

Hu of Emory Alzheimer's Disease Research Center
for their collaboration and clinical advice. We thank
the anonymous reviewers for their useful comments.
REFERENCES
Agrafiotis, D. K., & Cedeño, W. (2002). Feature selection
for structure-activity correlation using binary particle
swarms. Journal of Medicinal Chemistry, 45(5).
https://doi.org/10.1021/jm0104668
Basha, S. J., Madala, S. R., Vivek, K., Kumar, E. S., &
Ammannamma, T. (2022). A Review on Imbalanced
Data Classification Techniques. 2022 International
Conference on Advanced Computing Technologies and
Applications (ICACTA), 1–6. https://doi.org/10.110
9/ICACTA54488.2022.9753392
Cardiovascular diseases affect nearly half of American
adults, statistics show. (2019). American Heart
Association News, https://www.heart.org/en/news/
2019/01/31/cardiovascular-diseases-affect-nearly-half-
of-american-adults-statistics-show
Correa, E. S., Freitas, A. A., & Johnson, C. G. (2006). A
new discrete particle swarm algorithm applied to
attribute selection in a bioinformatics data set. GECCO
2006 - Genetic and Evolutionary Computation
Conference, 1.https://doi.org/10.1145/1143997.1144003
Cui, L., Yang, S., Chen, F., Ming, Z., Lu, N., & Qin, J.
(2018). A survey on application of machine learning for
Internet of Things. International Journal of Machine
Learning and Cybernetics, 9(8). https://doi.org/1
0.1007/s13042-018-0834-5
Dixon, M. F., Halperin, I., & Bilokon, P. (2020). Machine
learning in finance: From theory to practice. In Machine
Learning in Finance: From Theory to Practice.
https://doi.org/10.1007/978-3-030-41068-1
Efron, B., Hastie, T., Johnstone, I., Tibshirani, R.,
Ishwaran, H., Knight, K., Loubes, J. M., Massart, P.,
Madigan, D., Ridgeway, G., Rosset, S., Zhu, J. I., Stine,
R. A., Turlach, B. A., Weisberg, S., Johnstone, I., &
Tibshirani, R. (2004). Least angle regression. Annals of
Statistics, 32(2). https://doi.org/10.1214/009053604
000000067
Fujiwara, K., Huang, Y., Hori, K., Nishioji, K., Kobayashi,
M., Kamaguchi, M., & Kano, M. (2020). Over- and
Under-sampling Approach for Extremely Imbalanced
and Small Minority Data Problem in Health Record
Analysis. Frontiers in Public Health, 8. https://doi.o
rg/10.3389/fpubh.2020.00178
Gallagher, R. J., Lee, E. K., & Patterson, D. A. (1997).
Constrained discriminant analysis via 0/1 mixed integer
programming. Annals of Operations Research, 74.
https://doi.org/10.1023/a:1018943025993
Gao, L., Zhang, L., Liu, C., & Wu, S. (2020). Handling
imbalanced medical image data: A deep-learning-based
one-class classification approach. Artificial Intelligence
in Medicine, 108. https://doi.org/10.1016/j.artmed.
2020.101935
Ghassemi, M., Naumann, T., Schulam, P., Beam, A. L.,
Chen, I. Y., & Ranganath, R. (2020). A Review of
Challenges and Opportunities in Machine Learning for
Health. AMIA Joint Summits on Translational Science
Proceedings. AMIA Joint Summits on Translational
Science, 2020.
Gordon, T., Castelli, W. P., Hjortland, M. C., Kannel, W.
B., & Dawber, T. R. (1977). High density lipoprotein as
a protective factor against coronary heart disease. The
Framingham study. The American Journal of Medicine,
62(5). https://doi.org/10.1016/0002-9343(77)90874-9
Hayward, K. J., & Maas, M. M. (2021). Artificial
intelligence and crime: A primer for criminologists.
Crime, Media, Culture, 17(2). https://doi.org/10.117
7/1741659020917434
Hocking, R. R., & Leslie, R. N. (1967). Selection of the
Best Subset in Regression Analysis. Technometrics,
9(4). https://doi.org/10.1080/00401706.1967.10490502
Hu, W. T., Holtzman, D. M., Fagan, A. M., Shaw, L. M.,
Perrin, R., Arnold, S. E., Grossman, M., Xiong, C.,
Craig-Schapiro, R., Clark, C. M., Pickering, E., Kuhn,
M., Chen, Y., van Deerlin, V. M., McCluskey, L.,
Elman, L., Karlawish, J., Chen-Plotkin, A., Hurtig, H.
I., … Soares, H. (2012). Plasma multianalyte profiling
in mild cognitive impairment and Alzheimer Disease.
Neurology, 79(9). https://doi.org/10.1212/WNL.0b013
e318266fa70
Hu, W. T., Watts, K. D., Tailor, P., Nguyen, T. P., Howell,
J. C., Lee, R. C., Seyfried, N. T., Gearing, M., Hales, C.
M., Levey, A. I., Lah, J. J., & Lee, E. K. (2016). CSF
complement 3 and factor H are staging biomarkers in
Alzheimer’s disease. Acta Neuropathologica
Communications, 4. https://doi.org/10.1186/s40478-
016-0277-8
Hu, Y., Zhang, Y., & Gong, D. (2021). Multiobjective
Particle Swarm Optimization for Feature Selection with
Fuzzy Cost. IEEE Transactions on Cybernetics, 51(2).
https://doi.org/10.1109/TCYB.2020.3015756
Jain, N. K., Nangia, U., & Jain, J. (2018). A Review of
Particle Swarm Optimization. In Journal of The
Institution of Engineers (India): Series B (Vol. 99, Issue
4). https://doi.org/10.1007/s40031-018-0323-y
Kennedy, J., & Eberhart, R. C. (1997). Discrete binary
version of the particle swarm algorithm. Proceedings of
the IEEE International Conference on Systems, Man
and Cybernetics, 5. https://doi.org/10.1109/icsmc.1997
.637339
Kluger, A., Ferris, S. H., Golomb, J., Mittelman, M. S., &
Reisberg, B. (1999). Neuropsychological prediction of
decline to dementia in nondemented elderly. Journal of
Geriatric Psychiatry and Neurology, 12(4).
https://doi.org/10.1177/089198879901200402
Lazer, D., Kennedy, R., King, G., & Vespignani, A. (2014).
The parable of google flu: Traps in big data analysis. In
Science (Vol. 343, Issue 6176). https://doi.org/
10.1126/science.1248506
Lee, E. K., Gallagher, R. J., & Patterson, D. A. (2003). A
linear programming approach to discriminant analysis
with a reserved-judgment region. INFORMS Journal on
KDIR 2022 - 14th International Conference on Knowledge Discovery and Information Retrieval
106

Computing,15(1). https://doi.org/10.1287/ijoc.15.1.23
.151 58
Lee, E. K., Li, Z., Wang, Y., Hagen, M. S., Davis, R., &
Egan, B. M. (2021). Multi-Site Best Practice
Discovery: From Free Text to Standardized Concepts to
Clinical Decisions. 2021 IEEE International
Conference on Bioinformatics and Biomedicine
(BIBM), 2766–2773. https://doi.org/10.1109/BIBM52
615.2021.9669414
Lee, E. K., Wang, Y., Hagen, M. S., Wei, X., Davis, R. A.,
& Egan, B. M. (2016). Machine learning: multi-site
evidence-based best practice discovery. Lecture Notes
in Computer Science (Including Subseries Lecture
Notes in Artificial Intelligence and Lecture Notes in
Bioinformatics), 10122 LNCS. https://doi.org/10.1
007/978-3-319-51469-7_1
Lee, E. K., Wang, Y., He, Y., & Egan, B. M. (2019). An
efficient, robust, and customizable information
extraction and pre-processing pipeline for electronic
health records. IC3K 2019 - Proceedings of the 11th
International Joint Conference on Knowledge
Discovery, Knowledge Engineering and Knowledge
Management, 1. https://doi.org/10.5220/0008071
303100321
Lee, E. K., & Wu, T. L. (2009). Classification and disease
prediction via mathematical programming. In Springer
Optimization and Its Applications (Vol. 26).
https://doi.org/10.1007/978-0-387-09770-1_12
Lee, E. K., Wu, T. L., Goldstein, F., & Levey, A. (2012).
Predictive model for early detection of mild cognitive
impairment and Alzheimer’s disease. Fields Institute
Communications, 63. https://doi.org/10.1007/978-1-
4614-4133-5_4
Lee, E. K., Yuan, F., Hirsh, D. A., Mallory, M. D., &
Simon, H. K. (2012). A clinical decision tool for
predicting patient care characteristics: patients
returning within 72 hours in the emergency department.
AMIA ... Annual Symposium Proceedings / AMIA
Symposium. AMIA Symposium, 2012.
Lei, Y., Yang, B., Jiang, X., Jia, F., Li, N., & Nandi, A. K.
(2020). Applications of machine learning to machine
fault diagnosis: A review and roadmap. In Mechanical
Systems and Signal Processing (Vol. 138).
https://doi.org/10.1016/j.ymssp.2019.106587
Lopez, O. L., Becker, J. T., Jagust, W. J., Fitzpatrick, A.,
Carlson, M. C., DeKosky, S. T., Breitner, J., Lyketsos,
C. G., Jones, B., Kawas, C., & Kuller, L. H. (2006).
Neuropsychological characteristics of mild cognitive
impairment subgroups. Journal of Neurology,
Neurosurgery and Psychiatry, 77(2). https://doi.org/
10.1136/jnnp.2004.045567
Marlin, B. M., Zemel, R. S., Roweis, S. T., & Slaney, M.
(2011). Recommender systems: Missing data and
statistical model estimation. IJCAI International Joint
Conference on Artificial Intelligence. https://doi.org/
10.5591/978-1-57735-516-8/IJCAI11-447
McDermott, M. B. A., Yan, T., Naumann, T., Hunt, N.,
Suresh, H., Szolovits, P., & Ghassemi, M. (2018).
Semi-supervised biomedical translation with cycle
Wasserstein regression GaNs. 32nd AAAI Conference
on Artificial Intelligence, AAAI 2018. https://doi.
org/10.1609/aaai.v32i1.11890
Mohan, K., Pearl, J., & Tian, J. (2013). Graphical models
for inference with missing data. Advances in Neural
Information Processing Systems.
Monteiro, S. T., & Kosugi, Y. (2007). Particle swarms for
feature extraction of hyperspectral data. IEICE
Transactions on Information and Systems, E90-D(7).
https://doi.org/10.1093/ietisy/e90-d.7.1038
Myszczynska, M. A., Ojamies, P. N., Lacoste, A. M. B.,
Neil, D., Saffari, A., Mead, R., Hautbergue, G. M.,
Holbrook, J. D., & Ferraiuolo, L. (2020). Applications
of machine learning to diagnosis and treatment of
neurodegenerative diseases. In Nature Reviews
Neurology (Vol. 16, Issue 8). https://doi.org/
10.1038/s41582-020-0377-8
Narciso, D. A. C., & Martins, F. G. (2020). Application of
machine learning tools for energy efficiency in
industry: A review. In Energy Reports (Vol. 6).
https://doi.org/10.1016/j.egyr.2020.04.035
Nwegbu, N., Tirunagari, S., & Windridge, D. (2022). A
novel kernel based approach to arbitrary length
symbolic data with application to type 2 diabetes risk.
Scientific Reports, 12(1). https://doi.org/10.1
038/s41598-022-08757-1
Palmqvist, S., Janelidze, S., Quiroz, Y. T., Zetterberg, H.,
Lopera, F., Stomrud, E., Su, Y., Chen, Y., Serrano, G.
E., Leuzy, A., Mattsson-Carlgren, N., Strandberg, O.,
Smith, R., Villegas, A., Sepulveda-Falla, D., Chai, X.,
Proctor, N. K., Beach, T. G., Blennow, K., … Hansson,
O. (2020). Discriminative Accuracy of Plasma
Phospho-tau217 for Alzheimer Disease vs Other
Neurodegenerative Disorders. JAMA - Journal of the
American Medical Association, 324(8). https://doi.org/
10.1001/jama.2020.12134
Pudil, P., Novovičová, J., & Kittler, J. (1994). Floating
search methods in feature selection. Pattern
Recognition Letters, 15(11). https://doi.org/10.
1016/0167-8655(94)90127-9
Qu, K., Guo, F., Liu, X., Lin, Y., & Zou, Q. (2019).
Application of machine learning in microbiology.
Frontiers in Microbiology, 10(APR). https://doi.org/1
0.3389/fmicb.2019.00827
Rajkomar, A., Hardt, M., Howell, M. D., Corrado, G., &
Chin, M. H. (2018). Ensuring fairness in machine
learning to advance health equity. Annals of Internal
Medicine, 169(12). https://doi.org/10.7326/M18-1990
Ray, S., Britschgi, M., Herbert, C., Takeda-Uchimura, Y.,
Boxer, A., Blennow, K., Friedman, L. F., Galasko, D.
R., Jutel, M., Karydas, A., Kaye, J. A., Leszek, J.,
Miller, B. L., Minthon, L., Quinn, J. F., Rabinovici, G.
D., Robinson, W. H., Sabbagh, M. N., So, Y. T., …
Wyss-Coray, T. (2007). Classification and prediction of
clinical Alzheimer’s diagnosis based on plasma
signaling proteins. Nature Medicine, 13(11).
https://doi.org/10.1038/nm1653
Reddy, M. M., Wilson, R., Wilson, J., Connell, S., Gocke,
A., Hynan, L., German, D., & Kodadek, T. (2011).
Identification of candidate IgG biomarkers for
A Multi-stage Multi-group Classification Model: Applications to Knowledge Discovery for Evidence-based Patient-centered Care
107

alzheimer’s disease via combinatorial library screening.
Cell, 144(1). https://doi.org/10.1016/j.cell.2010.11.054
Rocha de Paula, M. R., Gómez Ravetti, M., Berretta, R., &
Moscato, P. (2011). Differences in abundances of cell-
signalling proteins in blood reveal novel biomarkers for
early detection of clinical Alzheimer’s disease. PLoS
ONE, 6(3). https://doi.org/10.1371/journal.pone.00174
81
Rose, S. (2018). Machine Learning for Prediction in
Electronic Health Data. In JAMA network open (Vol. 1,
Issue 4). https://doi.org/10.1001/jamanetworkopen.2018.
1404
Schindler, S. E., & Bateman, R. J. (2021). Combining
blood-based biomarkers to predict risk for Alzheimer’s
disease dementia. In Nature Aging (Vol. 1, Issue 1).
https://doi.org/10.1038/s43587-020-00008-0
Shapoval, A., & Lee, E. K. (2021). Generalizing 0-1
conflict hypergraphs and mixed conflict graphs: mixed
conflict hypergraphs in discrete optimization. Journal
of Global Optimization, 80(4). https://doi.org/
10.1007/s10898-021-01012-3
Siedlecki, W., & Sklansky, J. (1989). A note on genetic
algorithms for large-scale feature selection. Pattern
Recognition Letters, 10(5). https://doi.org/10.10
16/0167-8655(89)90037-8
Silva, A. P. D., & Stam, A. (1994). Second order
mathematical programming formulations for
discriminant analysis. European Journal of Operational
Research, 72(1). https://doi.org/10.1016/0377-2217
(94)90324-7
Stuss, D. T., & Trites, R. L. (1977). Classification of
neurological status using multiple discriminant function
analysis of neuropsychological test scores. Journal of
Consulting and Clinical Psychology, 45(1).
https://doi.org/10.1037/0022-006X.45.1.145
Suresh, H., Hunt, N., Johnson, A., Celi, L. A., Szolovits, P.,
Ghassemi, M., & Edu, M. (2017). Proceedings of
Machine Learning for Healthcare 2017 Clinical
Intervention Prediction and Understanding with Deep
Neural Networks. Ml4H, 68.
Tabert, M. H., Manly, J. J., Liu, X., Pelton, G. H.,
Rosenblum, S., Jacobs, M., Zamora, D., Goodkind, M.,
Bell, K., Stern, Y., & Devanand, D. P. (2006).
Neuropsychological prediction of conversion to
alzheimer disease in patients with mild cognitive
impairment. Archives of General Psychiatry, 63(8).
https://doi.org/10.1001/archpsyc.63.8.916
Tibshirani, R. (2011). Regression shrinkage and selection
via the lasso: A retrospective. Journal of the Royal
Statistical Society. Series B: Statistical Methodology,
73(3). https://doi.org/10.1111/j.1467-9868.2011.00771
.x
Yarkoni, T., & Westfall, J. (2017). Choosing Prediction
Over Explanation in Psychology: Lessons from
Machine Learning. Perspectives on Psychological
Science, 12(6). https://doi.org/10.1177/17456916176
93393
Zhao, S., Zhang, S., Liu, J., Wang, H., Zhu, J., Li, D., &
Zhao, R. (2021). Application of machine learning in
intelligent fish aquaculture: A review. In Aquaculture
(Vol. 540). https://doi.org/10.1016/j.aquaculture.2021.
736724
KDIR 2022 - 14th International Conference on Knowledge Discovery and Information Retrieval
108
