
Assessing City Green Spaces by Voluntary Geographic Information
Alexander V. Ignatyev
a
, Mikhail A. Kulikov
b
and Danila S. Parygin
c
Volgograd State Technical University, Volgograd, Russia
Keywords: Geoinformation technologies, geoinformation systems, GIS, planting, environment, living environment
quality index, territory improvement, environmental comfort of living.
Abstract: Green spaces are one of the most important indicators of the urban environment quality. The quantitative
information on the green areas is necessary for the calculation of a total index of the urban environment quality
submitted annually to the government statistics bodies. Such information can also be obtained by means of
geoinformation systems that provide multiple opportunities of their application in this area: map generating,
data base building, information actualization. The article considers the application of voluntary geographic
information from the web-cartographic project OpenStreetMap (OSM) and the GIS technology to assess the
area of the city greenery. The authors provide an example for the use of the geoinformation system with an
open code QGIS to calculate the areas of green spaces in Volgograd. The application of the method suggested
allows significantly reducing the time and labor effort to obtain the indicators of urban environment planting.
1 INTRODUCTION
The increased technogenic action on the environment
caused the need for more sustainable design and
construction processes. Environmentally sound
architectural and construction solutions at all the
stages of a life cycle the city passes as a whole system
are the essential prerequisite of urban development
(Shadrina, 2009; Usacheva, 2017; Sidorenko, 2020;
Ignatyev, 2020; Ignatyev, 2020).
Although the urban environment development
was included into key strategic development areas of
Russia, only a third part of Russian cities were
considered comfortable by the Minstroy RF
information. Thus, in 2019 the Decree of the
Government of the Russian Federation approved the
Method for Formation of Urban Environment Quality
(March 23, 2019 No. 510-r). This method
distinguished 6 spaces, and one of them is titled
“Green spaces”. A total of three criteria were
established for its assessment:
1. A share of public green spaces of a total
greenery area (%): it allows assessing the level
of comfort and safety of such green spaces in
general and natural planting in the city.
a
https://orcid.org/0000-0003-0733-8808
b
https://orcid.org/0000-0003-0519-8194
c
https://orcid.org/0000-0001-8834-5748
2. The planting level (%) which allows assessing
the potential development of the public green
areas as well as improving the environmental
safety of citizens considering the main
properties of greenery (dust, noise and CO2
attenuation, and oxygen release, sewage water
filtration, etc.)
3. Greenery state (non-dimensional share).
The improvement of indicators on these criteria
allows enhancing the assessment of the area “Green
spaces”.
While the greenery state shall be assessed after the
visual inspection alone, to obtain two other criteria
one may use geoinformation systems (GIS).
Although the idea of geoinformation system
application for assessing the planting level is not
original (the results of their application to solve these
tasks have been assessed by a few authors (Goryaeva,
2015; Ivlieva, 2010; Cavajos, 2011; Popova, 2018;
Sergeeva, 2021), in general, no uniform and generally
accepted method for the assessment of city green
spaces has been developed.
The research covered the endeavor to develop a
method for assessing the city green spaces based on
the voluntary geographic information from the web-
Ignatyev, A., Kulikov, M. and Parygin, D.
Assessing City Green Spaces by Voluntary Geographic Information.
DOI: 10.5220/0011555500003524
In Proceedings of the 1st International Conference on Methods, Models, Technologies for Sustainable Development (MMTGE 2022) - Agroclimatic Projects and Carbon Neutrality, pages
103-108
ISBN: 978-989-758-608-8
Copyright
c
2023 by SCITEPRESS – Science and Technology Publications, Lda. Under CC license (CC BY-NC-ND 4.0)
103
cartographic project OpenStreetMap (OSMN)
exemplified by Volgograd. The ultimate purpose is to
optimize the process of obtaining the urban planting
indicators.
2 MATERIALS AND METHODS
To get the data on the green spaces in Volgograd, the
authors used voluntary geographic information (VGI)
from OpenStreetMap (OSM) (Alhamwi, 2017;
Ballatore, 2012; Briem, 2019; Brinkhoff, 2016;
Estima, 2013; Fritz, 2012; Gil, J., 2015; Mobasheri,
2017; Ludwig, 2021).
The OSM formal model includes a range of
properties (referred to as tags) describing the
geographic classes the use of which is defined by the
project participants at the special website Wiki. Each
mapped object is assigned a tag which unites a key
and its meaning.
The research work (Ignatyev, 2021) already
provided the study of tags used in OpenStreetMap to
designate greenery.
However, it turned out we did not select enough
“key-meaning” pairs to identify all greenery in
Volgograd.
After additional study conducted for the OSM
tags we obtained the following pairs:
− landuse = grass, surface = grass, and natural =
grassland – grass lawns;
− landuse = meadow, natural = heath and natural
= scrub – territories with scrubs;
− natural = wood and landuse = forest –
territories with trees;
− landuse = recreation_ground - green spaces for
public leisure except for parks;
− landuse = allotments – land lots allocated for
gardens or farmlands;
− leisure =- park – parks;
− natural = wetland - other greenery.
To unload the information on the green objects in
Volgograd from the cartographic service
OpenStreetMap and its further processing, we used a
free geoinformation system with an open code QGIS.
The research was conducted in several stages.
To unload the information on Volgograd with its
boundaries and green objects from the cartographic
service OpenStreetMap, we used the module
QuickOSM.
To unload the information on Volgograd with its
boundaries, we used the tag with the key admin_level
and the value 6.
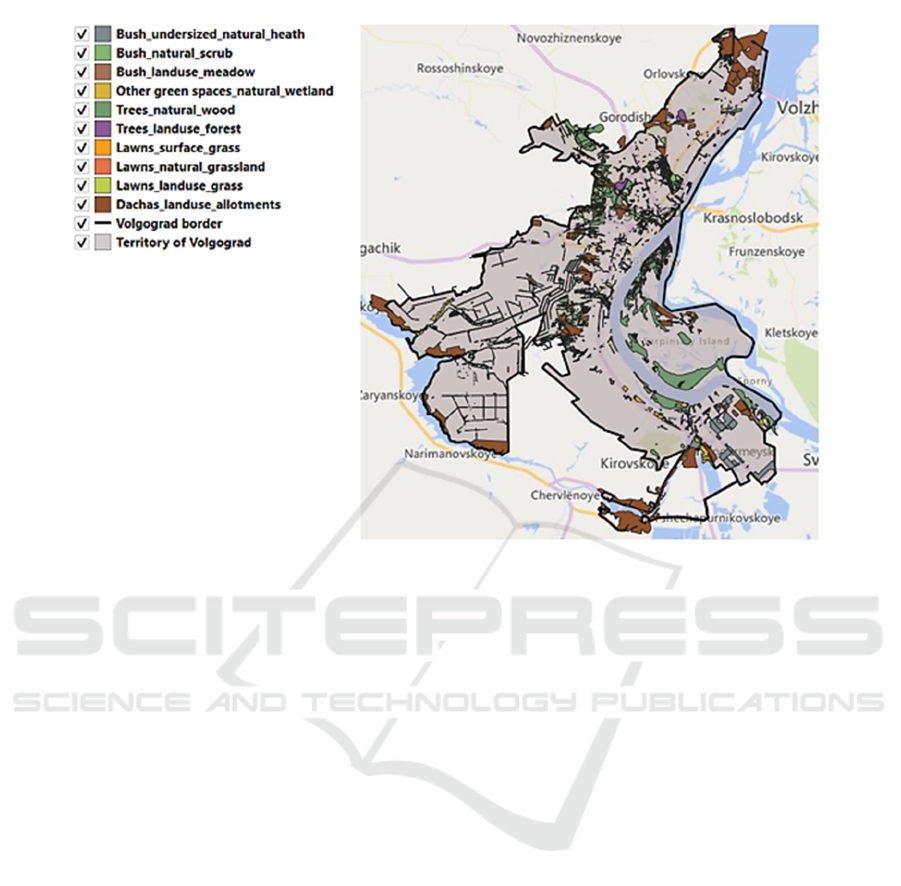
Figure 1: Vector layers for green objects, Volgograd.
MMTGE 2022 - I International Conference "Methods, models, technologies for sustainable development: agroclimatic projects and carbon
neutrality", Kadyrov Chechen State University Chechen Republic, Grozny, st. Sher
104
Using the abovementioned tags, we unloaded and
saved the information on all green objects in
Volgograd in the form of a permanent layer (Fig. 1).
The table of each layer attributes was added a
calculated field area intended for storing the area
value of each polygon.
After that we cleared all the data and deleted the
objects with zero area values.
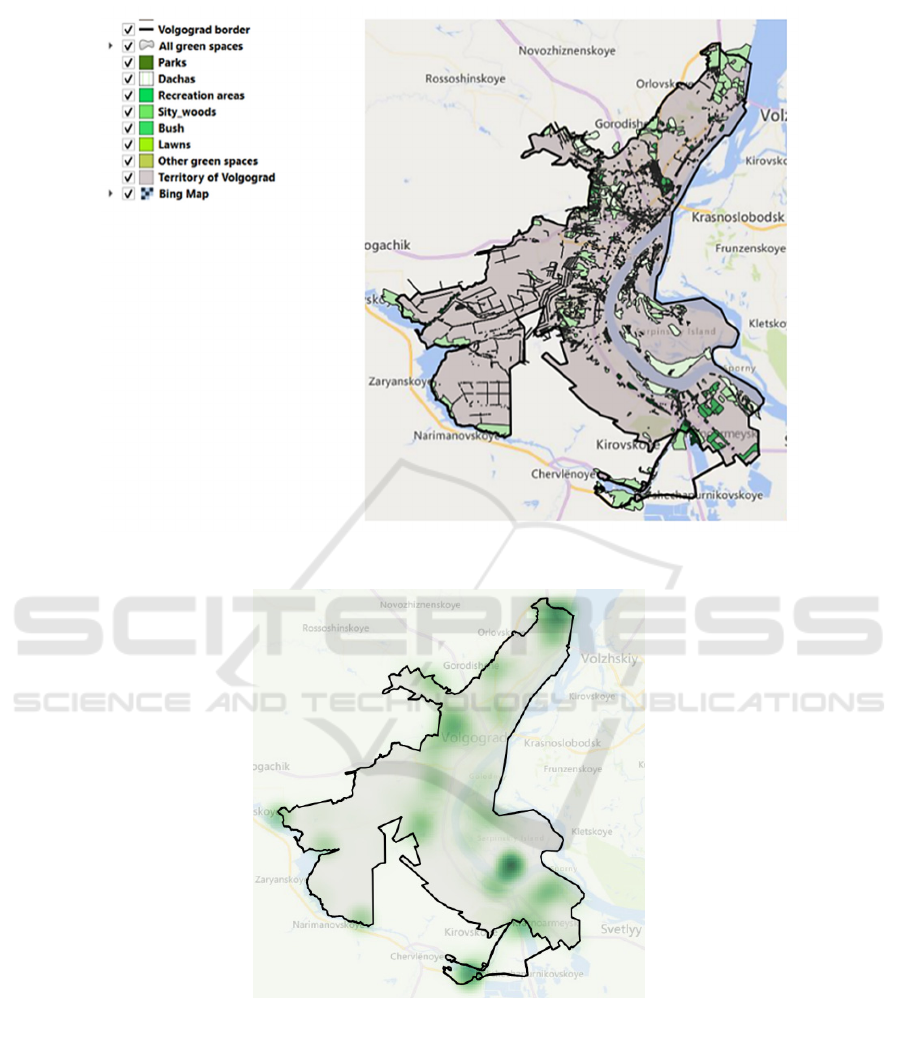
Further, the layers obtained were united by the
specific greenery types (Fig. 2).
These layers were united into the layer “All green
spaces”.
Using this layer, we generated a heat map of
greenery distribution (Fig. 3). In the process of its
generation the points were weighed on the field area,
Figure 2: Layers with specific greenery types, Volgograd.
Figure 3: Heat map of greenery distribution, Volgograd.
Assessing City Green Spaces by Voluntary Geographic Information
105
i.e., on the polygon areas containing the information
on the green spaces.
To obtain information on the distribution of
apartment blocks and the number people living there,
we used the data unloaded from the service Reforma
ZhKKh (Housing and Utility Reform) presented in
the csv format. This file contains variable data on the
apartment blocks located in Volgograd including
their addresses, coordinates and the number of people
living there.
The thorough analysis of the file showed that
some of the blocks have no data on their residents’
number.
This flaw was eliminated. We calculated those 26
square meters is an average living space per a person
living in the apartment block in Volgograd. Using this
value, we added the missing information to the field
containing the data on the number of residents in the
apartment blocks.
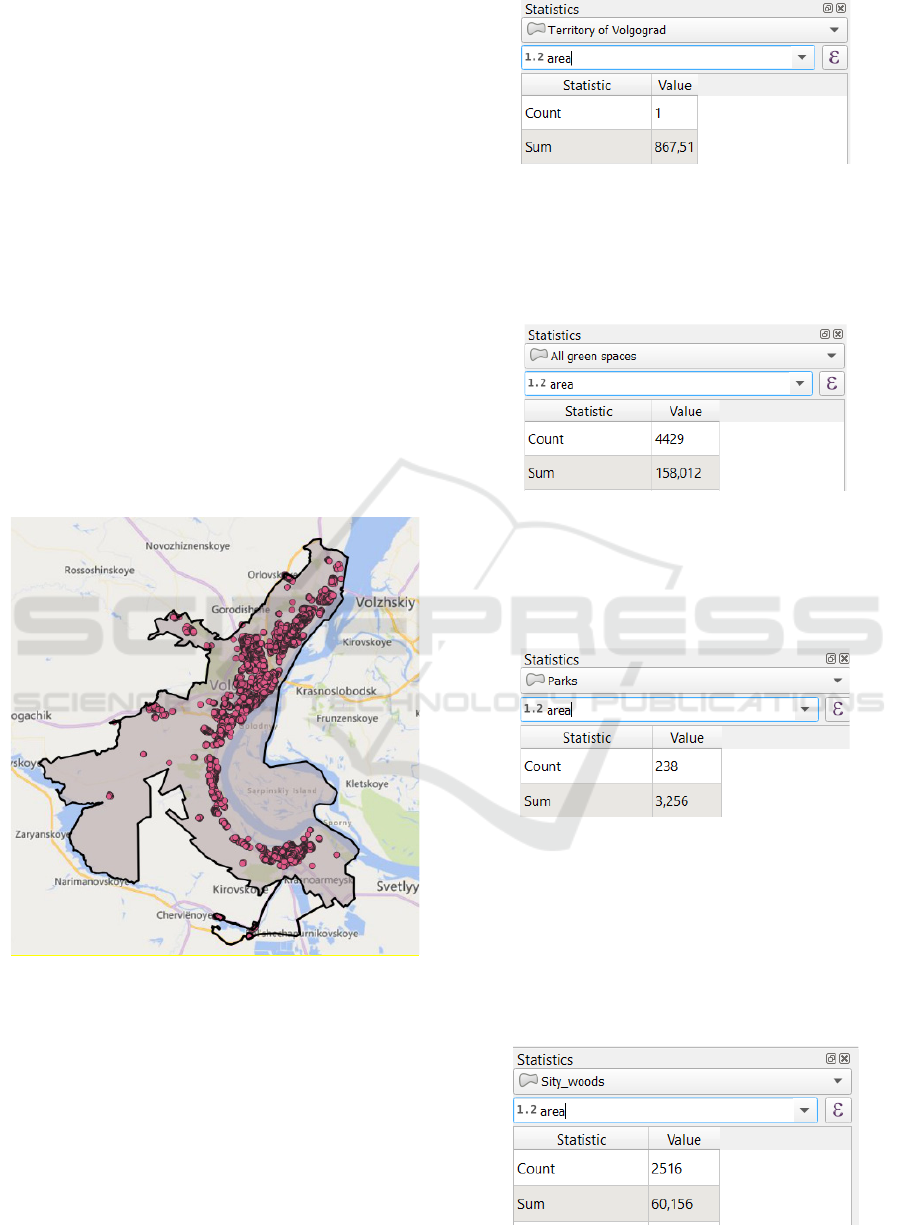
The availability of coordinates allowed mapping
these blocks onto QGIS as a dot layer shown in Figure
4.
Figure 4: A dot layer with the apartment blocks location,
Volgograd.
3 RESULTS AND DISCUSSION
The software solution we obtained allows calculating
the following indicators used to get the index of urban
environment quality:
1. The general city area (Fig. 5) applied to
calculate the criterion “Planting level”.
Figure 5: The general area calculated, Volgograd.
2. The area of city territories covered by greenery
(Fig. 6) applied to calculate the criteria
“Planting level” and the “Share of public green
spaces of a total greenery area”.
Figure 6: The calculated area of city spaces covered by
greenery, Volgograd.
3. The area of public spaces (Fig. 7) applied to
calculate the criterion “Share of public green
spaces of a total greenery area”.
Figure 7: The calculated area of public spaces, Volgograd.
Additionally, as the solution developed allows
calculating a total area of spaces covered by each type
of greenery, it can be applied for unveiling the
potential improvement of green spaces. For example,
Figure 8 showed the area of so-called urban forests
that can be improved and included in the category of
the area of public spaces.
Figure 8: The area of urban forests, Volgograd.
MMTGE 2022 - I International Conference "Methods, models, technologies for sustainable development: agroclimatic projects and carbon
neutrality", Kadyrov Chechen State University Chechen Republic, Grozny, st. Sher
106
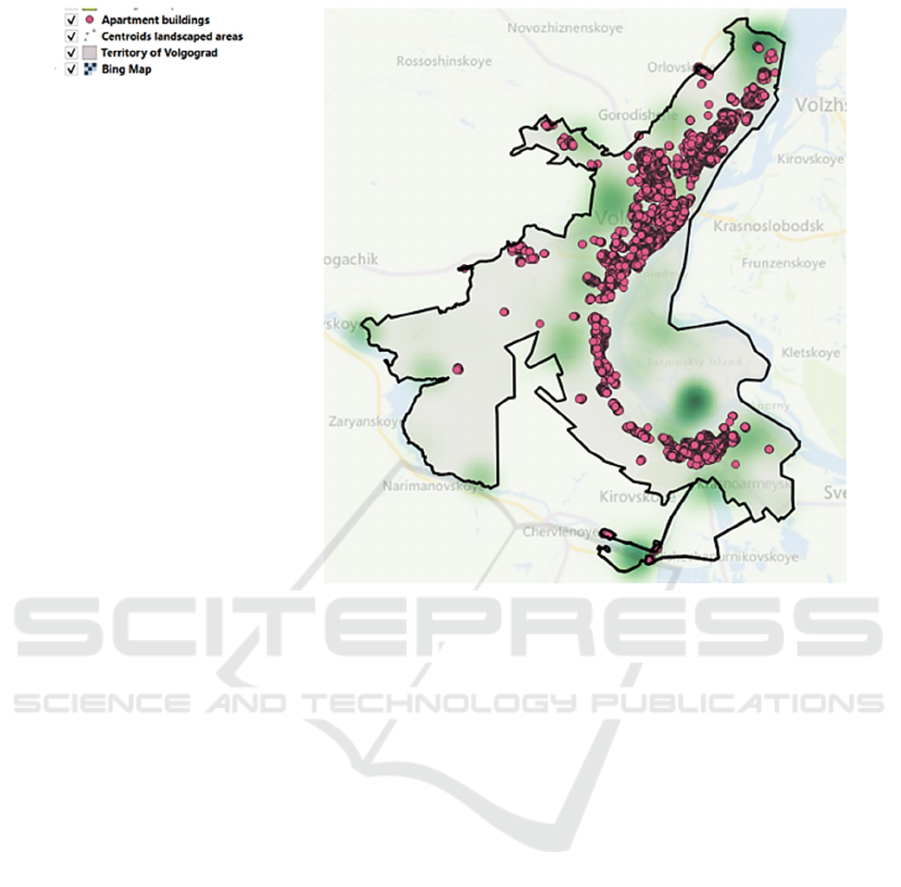
Figure 9: The aligned heat map of greenery distribution and the layer of apartment block location, and the layer showing
Volgograd boundaries.
To add more, by aligning the heat map of greenery
distribution with the layer of apartment block location
(Fig. 9), one can define residential areas that should
be provided the access to green spaces in the first
place.
4 CONCLUSIONS
It is the first time the voluntary geographic
information from the web-cartographic project
OpenStreetMap was applied for Volgograd to assess
the area of city green spaces. The method suggested
allows using these data to calculate indicators for
obtaining the criteria “Planting level”, “Share of
public green spaces of a total greenery area” used to
get the index of the urban environment quality.
As the solution developed allows calculating a
total area of spaces covered by each type of greenery,
it can be applied for unveiling the potential
improvement of green spaces.
ACKNOWLEDGEMENTS
The study has been supported by the grant from the
Russian Science Foundation (RSF) No. 22-11-20024,
https://rscf.ru/en/project/22-11-20024/, and the
Volgograd Oblast. The authors express gratitude to
colleagues from the Department of Digital
Technologies for Urban Studies, Architecture and
Civil Engineering, VSTU involved in the
development of the project.
REFERENCES
Shadrina, A. V., Kolyasnikov, V. A., 2009. Formation of a
system of integrated security in urban planning.
Academic Bulletin Uralniproekt RAASN. 2. pp. 12-15.
Usacheva, O. A., 2017. Russian concepts of greening cities
in Russia and the world: global challenges and
strategies of socio-cultural modernization. Materials of
the International Scientific and Practical Conference.
pp. 726-732.
Sidorenko, V. F., Ignatyev, A. V., Abros'kin, A. A., 2020.
Formation of the system of environmental monitoring
of the atmospheric air taking into account the urban
Assessing City Green Spaces by Voluntary Geographic Information
107

development of populated areas. VolgGTU,
Volgograd. p. 132.
Ignatyev, A. V., 2020. Methodology for comprehensive
assessment of atmospheric air state in populated areas.
IOP Conference Series: Materials Science and
Engineering. 962(4).
Ignatyev, A. V., Chumakov, A. V., Udo, I. E., 2020.
Development of a methodology for a comprehensive
assessment of the main sources of pollution and factors
affecting the state of the air in populated areas. Modern
science: actual problems of theory and practice. 6. pp.
88-93.
Goryaeva, E. V., Mokhirev, A. P., 2015. Inventory of green
spaces using GIS technologies on the example of the
city of Lesosibirsk. News of higher educational
institutions. Forest Journal. 2(344). pp. 80-89.
Ivlieva, N. G., Dolgacheva, T. A., Manukhov, V. F.,
Buchatskaya N. V., 2010. The use of GIS technologies
to assess the social comfort of living in the city.
INTERKARTO. INTERGIS. 16. pp. 140-144.
Cavajos, F., Ramos, Y., Boye, A., 2011. Urban green space
inventory and monitoring using WORLVIEW-2 data.
Geomatics. 3. pp. 67–73.
Popova, I. V., Burak, E. E., Vorobieva, Yu. A., 2018,
Application of geoinformation systems for monitoring
and development of the urban green space system.
Housing and Communal Infrastructure. 4(7). pp. 67-75.
Sergeeva, O. S., Pirozhkov, S. P., 2021. Methodology
development for calculating the area of greenery in a
city, using remote sensing data. Geographical bulletin,
2(57). pp. 170-181.
Alhamwi, A., Medjroubi, W., Vogt, T., Agert, C., 2017.
OpenStreetMap data in modelling the urban energy
infrastructure: a first assessment and analysis. Energy
Procedia. 142. pp. 1968-1976.
Ballatore, A., Wilson, D. C., Bertolotto, M., 2012. A
Holistic Semantic Similarity Measure for Viewports in
Interactive Maps. Di Martino, S., Peron, A., Tezuka, T.
(eds) Web and Wireless Geographical Information
Systems. W2GIS 2012. Lecture Notes in Computer
Science. 7236.
Briem, L., Heilig, M., Klinkhardt, C., Vortisch, P. 2019.
Analyzing OpenStreetMap as data source for travel
demand models. A case study in Karlsruhe,
Transportation Research Procedia. 41. pp. 104-112.
Brinkhoff, T., 2016. Open street map data as source for
built-up and urban areas on global scale. The
International Archives of Photogrammetry, Remote
Sensing and Spatial Information Sciences. 41. p. 557.
Estima, J., Painho, M., 2013. Exploratory analysis of
OpenStreetMap for land use classification. In:
GEOCROWD '13: Proceedings of the Second ACM
SIGSPATIAL International Workshop on
Crowdsourced and Volunteered Geographic
Information, pp. 39-46.
Fritz, S., McCallum, I., Schill, C., Perger, C., See, L.,
Schepaschenko, D., Obersteiner, M., 2012. Geo-Wiki:
An online platform for improving global land cover. In:
Environmental Modelling & Software, 31, pp. 110-123.
Gil, J., 2015. Building a Multimodal Urban Network Model
Using OpenStreetMap Data for the Analysis of
Sustainable Accessibility. OpenStreetMap in
GIScience. pp. 229–251.
Mobasheri, A., 2017. A Rule-Based Spatial Reasoning
Approach for OpenStreetMap Data Quality
Enrichment. Case Study of Routing and Navigation.
17(11). 2498.
Ludwig, C., Hecht, R., Lautenbach, S., Schorcht, M., Zipf,
A., 2021. Mapping Public Urban Green Spaces Based
on OpenStreetMap and Sentinel-2 Imagery Using
Belief Functions. ISPRS International Journal of Geo-
Information.
10(4). 251.
Ignatyev, A. V., 2021. Methodology for objects selection
and classification of the urban planning system on the
basis of voluntary geographic information. AIP
Conference Proceedings. 2442. 070003.
MMTGE 2022 - I International Conference "Methods, models, technologies for sustainable development: agroclimatic projects and carbon
neutrality", Kadyrov Chechen State University Chechen Republic, Grozny, st. Sher
108
