
Decision Support for Production Control based on Machine Learning
by Simulation-generated Data
Konstantin Muehlbauer
a
, Lukas Rissmann
b
and Sebastian Meissner
c
Technology Center for Production and Logistics Systems, Landshut University of Applied Sciences, Am Lurzenhof 1,
Landshut, Germany
Keywords: Artificial Intelligence, Decision-making, Machine Learning, Order-sequence Optimization, Logistics
Simulation.
Abstract: Data-oriented approaches enable new opportunities to analyze processes and support managers in decision-
making during planning and control tasks. In particular, the application of simulations has been a widely used
tool for many years to evaluate alternative system configurations or to predict future process outcome. Due
to a rapidly changing environment in a cross-linked domain such as production and logistics systems, more
and more decisions have to be made in a shorter time under consideration of multi-factorial influences.
Simulation based approaches often reach limits regarding time constraints assuming limited computing power.
The article describes how data, generated by production and logistics simulation can be used to train a machine
learning model. Thus, the generalized framework presented can be utilized to support decision-making during
planning and control tasks. By applying the framework to a case study on order sequence optimization, it was
possible to verify its feasibility and potential to improve the operational performance of a manufacturing
system.
1 INTRODUCTION AND
PROBLEM STATEMENT
The ongoing technological progress enables new
potentials regarding planning and control of
production and logistics systems (Windt et al., 2008).
One fundamental aim of computational applications
in this field is to support managers in time-consuming
activities or activities with a high degree of
complexity regarding decision-making. In particular,
potential through data-oriented approaches (e.g.,
simulation or machine learning) can be leveraged in
areas where enormous amount of data and its
situational dependency has to be considered. (Hasan
et al., 2016; Koot et al., 2021)
Simulations have been used for many years to
support decision-making during planning of
production and logistics systems (Pfeiffer et al.,
2016). The use of simulations in production control
will also become more important due to the further
a
https://orcid.org/0000-0003-0986-7009
b
https://orcid.org/0000-0002-9747-7707
c
https://orcid.org/0000-0002-5808-9648
implementation of digital twins. A digital twin is a
virtual representation of a physical object or process
(Kauke et al., 2021). It should help to understand the
behavior of an object by a dynamic prediction based
on diverse data (Qi and Tao, 2018). Simulations are
often an essential part of digital twins (Kritzinger et
al., 2018).
The rising complexity of production and logistics
systems also leads to increasingly demanding
requirements for simulation models and necessitate
an growing amount of simulation runs in order to
better represent the reality (Rose, 2007). In particular,
executing different scenarios can make simulation
runs computing and time intensive. Despite increased
computing power, simulating various problems can
take more time than is available (Rose, 2007). In case
of time-critical decisions, this might imply that not all
alternative scenarios can be simulated in time. Thus,
only an insufficiently evaluated decision can be
made. Machine learning (ML) can provide a solution
to this problem. Based on a trained ML model
54
Muehlbauer, K., Rissmann, L. and Meissner, S.
Decision Support for Production Control based on Machine Lear ning by Simulation-generated Data.
DOI: 10.5220/0011538000003335
In Proceedings of the 14th International Joint Conference on Knowledge Discovery, Knowledge Engineering and Knowledge Management (IC3K 2022) - Volume 3: KMIS, pages 54-62
ISBN: 978-989-758-614-9; ISSN: 2184-3228
Copyright
c
2022 by SCITEPRESS – Science and Technology Publications, Lda. All rights reserved

enormous amounts of data can be processed and
evaluated faster and, thus, time-critical decisions can
be made on time.
This article presents a framework for application
of simulation models of manufacturing and logistics
processes to generate data in order to train an ML
model. Based on an ML model that has been trained
in advance, the objective is to support decision-
making through predictive analytics for planning and
control tasks in manufacturing and logistics systems.
The approach describes important information flows
and process steps required. The framework is
designed to tackle two challenges. On the one hand,
the approach can help to cope with the issue that
simulating different scenarios takes more time than is
available for time-critical decisions. On the other
hand, it enables the training of ML models in
processes with a quantitatively or qualitatively
limited data basis. Additional simulation-generated
data can be provided as training data, thus, enabling
better control decision. This can increase the
performance of a production and logistics system
significantly. With regard to the current performance
and applicability of ML, as well as the extensive
availability of simulation tools for production and
logistics systems, this article aims to answer the
following research question (RQ):
RQ: How can a generalized framework for machine-
learning-application based on discrete-event
simulation be described in order to be implemented
for decision-support in production and logistics
control system with insufficient data quality and
quantity?
2 RESEARCH ADVANCES
In following section, current research advances in
simulation and ML as well as applications within
manufacturing and logistics systems are described.
2.1 Simulation of Production and
Logistics Processes
A simulation is a method of reproducing a system in
an experimentable model, which can be used to
observe and analyze the temporal behavior of
complex systems (VDI 3633, 2018). Simulations can
help companies develop, implement, and execute
plans and strategies, giving them a significant
competitive advantage. They have proven their
potential by predicting performance, utilization,
bottlenecks, as well as analyzing interactions of
different components of a system. Results of
simulations can significantly improve decisions in
terms of planning and control. A key advantage
compared to other operations research approaches is
the ability to perform experiments with different
elements of a business system (Agalianos et al.,
2020). Fowler and Rose mention further advantages
such as time compression, component integration,
and risk avoidance. Simulation models are already
often used for applications in high-tech production
systems such as semiconductor or automotive
industries (Fowler and Rose, 2004).
Application scenarios of simulation models
regarding short-term decision-making within
production and logistics systems are described below.
Korth et al. developed a simulation model within a
digital twin for a critical real-time use case in logistics.
Objective of the application is to support shift planning
of employees and time window planning within a
warehouse (Korth et al., 2018). Kauke et al. describe a
digital twin for order picking systems by using a
simulation. It is emphasized that due to a high system
complexity, simulation is often the only way to check
different parameters of a picking system. Simulations
should help to support decisions like the size of picking
orders, use of employees, or order-release strategies
(Kauke et al., 2021). Further applications of
discrete-event simulation within production and
logistics systems are shown by Agalianos et al. in their
literature review.
However, the literature indicates that in particular
real-time simulations are still in early development
phase. According to the current state, the application
of simulation for time-critical decisions is only
possible with: (1) use of a simulation model that runs
continuously and is synchronized with the factory, (2)
automated modeling of a simulation models based on
the factory data basis, or (3) by simplifying the
simulation (Fowler and Rose, 2004; Rose, 2007).
2.2 Simulation-based Machine
Learning in Production and
Logistics Systems
In literature the combination of ML and simulation
models are described in different applications.
Vernickel et al. introduce a ML approach for
parameterizing and synchronizing a material flow
simulation model. This approach shows how ML can
be used to identify relevant process information from
a dataset and integrate this information into a
simulation model. This enables a better determination
of resource processing time compared to a normal
simulation model (Vernickel et al., 2020). Nagahara
Decision Support for Production Control based on Machine Learning by Simulation-generated Data
55

et al. pursue a job sequencing rule identification
method by using ML to generate an automatic
modeling of operational control rules for a
simulation. Another approach is presented by Müller
et al. using a material flow simulation to control
automated guided vehicles which communicates with
other digital twins, e.g., in manufacturing cells. Other
author attempts to validate an ML model for
predicting disruptive effects in production logistics
by simulation models (Vojdani and Erichsen, 2018).
The generated data of a simulation model represent
real production data. This could be important as some
companies do not have the necessary data basis to use
ML. Data from simulation models are often the only
way to test an algorithm's applicability in advance and
to transfer them to a real production or logistics
system. Pfeiffer et al. describe an approach for multi-
model-based prediction of lead times within a
manufacturing system. The method is tested on data
generated by a simulation model.
The literature analysis shows that the application
of simulation in combination with ML in production
and logistics systems increases. The lack of sufficient
real production and logistics data encourages the
usage of simulation models to generate data for ML.
In summary, three possible applications for the
collaborative use of ML and simulations can be
identified. First, ML can support simulation runs by
optimizing the parameterization of simulation
models. Secondly, ML could make complete
predictions on its own and replace the entire
simulation model (also called surrogate modelling)
(Bárkányi et al., 2021). The third application is to use
simulations to generate data of production and
logistics systems for training and validating ML
models.
3 MACHINE LEARNING
FRAMEWORK BASED ON
SIMULATION DATA
Section 3.1 describes the developed framework with
all components required for the implementation and
section 3.2 presents an application example by a
specific case study.
3.1 Components of the Framework
The framework consists of different components
which are shown in Figure 1. The following
components are required: (1) problem statement
level, (2) input data to perform a simulation run, (3) a
validated simulation model, (4) output data of a
simulation run, (5) a data preparation utility, and (6)
a selected ML model.
Based on a key performance indicator (KPI)
system and the deviation between target and actual
values, an identified potential for optimization in the
respective production and logistics system serves as
the starting point for the application. Consequently, a
target can be determined. This target has to be
reflected in the real system by one or more KPIs (e.g.,
lead time, throughput, failures). The factors that
influence the target (process parameters and process
constants) or other causes have to be determined from
the real production and logistics systems. Due to the
fact that not all influencing factors can be adjusted,
control variables have to be defined. Various process
analysis methods as well as expert knowledge have to
be used for this. This can be done manually (e.g., by
Value Stream Mapping) or with data-oriented
approaches (e.g., by rule-based or ML approaches).
The identified control variables as well as the target
KPIs will be used for the ML model.
After the problem statement and the analysis of
the process, simulation input data has to be prepared
in order to generate sufficient simulation output data.
Also, different control variables have to be defined,
so that the simulation model can be parameterized
depending on the application. This simulation input is
used for a validated simulation model of the
production and logistics system. The model should
reflect the real process in as much detail as is
reasonable based on the defined target KPIs and
influencing factors. It is necessary to ensure that
results of this model have been checked in advance
and produce comparable results to the real process.
For this purpose, it is important to use the same data
structure between input data of the simulation and the
real system. This is critical to validate the results of
the simulation. It has to be mentioned that by using
simulations as well as simulations in combination
with ML multiple factors for inaccuracies can exist.
Further research is required on this issue. These
effects are not considered in this article.
The simulation input (e.g., production or transport
orders, resources, etc.) required for implementing a
simulation model can be taken from different systems
such as Enterprise Resource Planning (ERP),
Manufacturing Execution System (MES), or
Warehouse Management System (WMS). The
aforementioned input should be used for the
simulation model as well as the ML model. Based on
the defined simulation input (2) and a validated
simulation model (3), the required output data (4) for
determining the target KPIs can be generated.
KMIS 2022 - 14th International Conference on Knowledge Management and Information Systems
56

Through the use of a simulation model it is
possible to generate multiple years’ worth of data
where only the input variables of the system have
changed. Thus, the configuration as well as the
restrictions of the production and logistics systems
are the same. This allows occurrences that happen
very rarely to be reflected in the data and provide
comprehensive data for training an ML model.
Furthermore, existing datasets or datasets with
insufficient quality and quantity can be enriched with
additional data. For determining the number of entries
in the dataset required, it has to be considered that the
duration of a single simulation run can be a regulating
variable. It is not possible to specify the quantity of
required entries in a dataset. This is due to different
factors such as the complexity of the simulation as
well as the number of process parameters. The
complexity of the problem to be solved or the ML task
can also influence the number of entries.
Furthermore, the input and generated output data
of each simulation run (=simulation results) must be
stored together. This can be done using a database
system e.g., SQLite, etc. Next, the dataset can be split
by a random training and test splitting function for
cross validation. The training is performed with the
available features (=simulation input) and labels
(=simulation output). Once the generated data has
been splitted, it is analyzed in the next step using
various data preparation methods. Where, incorrect or
missing data are sorted out. By using a simulation
model only failed simulation runs or incorrect models
can create erroneous data. In case of using a validated
simulation model, no erroneous simulation runs
should occur at this step. Nevertheless, the results
should be checked as failed simulation runs can create
incorrect or incomplete data. Furthermore, data
argumentation as well as techniques for
dimensionality reduction can applied.
In complex problems, ML clustering (e.g., K-
Means, etc.) may be used to automatically find
patterns or correlations in the data. This allows to
create classes, which substitute the original label.
Techniques such as scaling and principal component
analysis (PCA) can used to improve model
performance. This may help to cope with imbalanced
data and improve the ML result. Subsequently, it
must be decided which ML learning type, ML class,
and finally ML model are roughly suitable. As labels
are available, supervised learning is selected.
Supervised learning, involves learning with different
features of a dataset, annotated with a label. The goal
is to map input to output values by minimizing the
discrepancy between real and predicted values within
the dataset (Goodfellow et al., 2016). Through the
description of the application scenario, an ML class
can be specified e.g., classification or regression.
Thus, possible models can be delimited. A regression
model attempts to predict continuous values based on
given data (Han et al., 2012). On the other hand, a
classification model aims to predict a correct class
from several classes of data (Han et al., 2012).
As shown in Figure 1, it is important to define the
output requirements in order to be able to evaluate the
final ML results. Nevertheless, a specific requirement
cannot be described due to the different application
scenarios within production and logistics systems.
However, the proposed solution must be better than
the current approach. Thus, the performance or
reliability of the system should be increased, such as
lower throughput times, better adherence to
schedules, or an increased throughput. These KPIs
can be specified in percentages or absolute numbers.
After training, the model is validated with a
comparison between a prediction of previously
unknown data against the labeled data. Thus, the ML-
based results are referred to as predicted, while the
simulation-based results are referred to as real. It is
analyzed whether the prediction accuracy achieved
by the ML model is sufficient to meet the defined
output (performance) requirements. Based on the
chosen ML model, metrics are used to quantify the
ML results. For regression tasks ‘mean absolute
error’ and ‘root mean squared error’ can be applied.
In classification, ‘accuracy’, ‘recall’, ‘precision’, and
‘f1-score’ can be used.
Depending on the complexity and quality of the
ML results, this step leads to further iteration loops as
shown in Figure 1. If further data generation is
chosen, the amount of data is increased step by step.
In performance enhancement the settings of the ML
model (e.g., further data preparation) or the complete
ML model itself (e.g., other algorithm classes or
algorithm) is adjusted. If the results of the ML model
correspond to the previously defined requirements,
the model can then be tested with real (historical)
data. However, it should be mentioned that this step
can only be performed if data of the real system is
available. Otherwise, this step must be performed
with the future real system data. Depending on the
result, this step leads to the execution of the
corresponding feedback loop. If these results match
the test data results in terms of accuracy, the ML
model can be used in the real system as a decision
support tool. Here, the ML model helps to decide
whether a replanning is necessary or only a few
adjustments (control variables) are required. In the
following, the key applications of the framework are
demonstrated by means of a case study.
Decision Support for Production Control based on Machine Learning by Simulation-generated Data
57
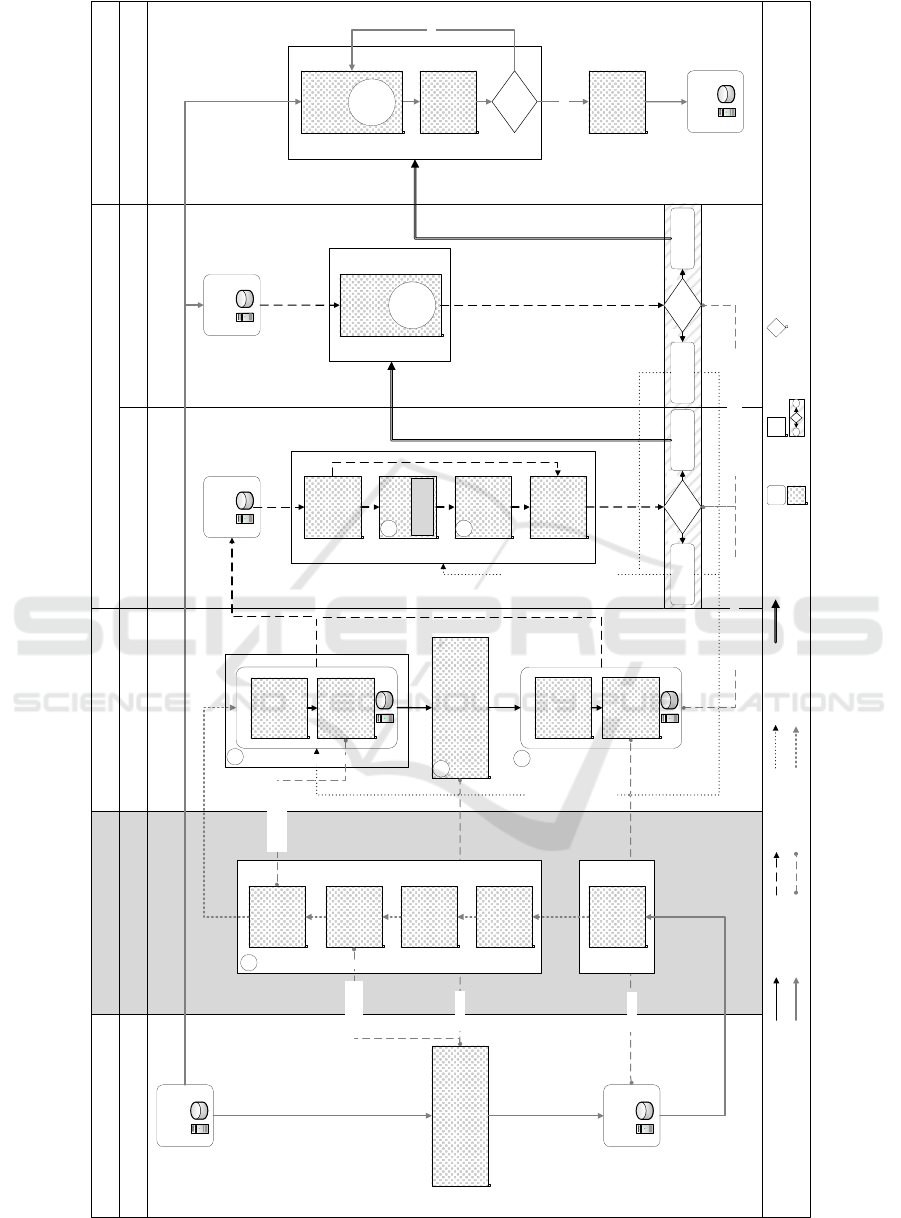
Figure 1: Framework for training an ML model with simulation-generated data of a production and logistics system.
Real Production or Logistics System Problem Statement ML Training
Real System Initial Situation Machine Learning (ML)
Real production or logistics
system
Planning &
control data
Real system
output
ML input
data
Programming enviroment
Result
req.
ML
validation
ML
optimization
YES
NO
Validated simulation model
Simulation output
Labels
Define results requirements
ML Performance enhancement
ML Validation
ML input
data
Programming enviroment
Simulation
Data Generation by Simulation Model
Test ML
model with
real data
Simulation input
Generating
data based
on planning
& control
information
1
2
4
Parameter-
ization of
control
variables
Features
ML Application
Decision support tool
ML results
Data
selection
(filter)
Result
req.
Real
application
ML
optimization
YES
NO
Trained
ML
model
Trained
ML
model
Real System
Simulation
results
KPI
calculation
Compared with test data results
Target
achieved
NO
Change
control
variables in
the real
system
YES
Simulation data
process flow
Real data
process flow
Data
Activities
Decision for
implementation
ML Data
process flow
Knowledge
transfer flow
ML feedback
loop
Problem to target
process flow
Systems
Transfer AI
model
Real system
decision
Training
ML model
Data
preparation
ML clustering
(optional)
Training and
test data
splitting
Test ML
model with
simulation
data
3
5
6
Identifying
problem
based on
KPIs
Defining
farget &
target KPIs
Determing
influencing
factors
Determing
control
variables
Modeling
Planning &
control data
KPI-System
Comparing
target vs.
actual KPIs
Identified from
problem statement
Identified from
real system
Further data generation
Programming enviroment
1
Validation
Common problem definition
KMIS 2022 - 14th International Conference on Knowledge Management and Information Systems
58
3.2 Case Study
The case study represents a U-cell assembly line of a
medium-sized company and is exemplarily set up in
the Technology Center for Production and Logistics
Systems (TZ PULS) of the University of Applied
Science Landshut (Blöchl and Schneider, 2016). A
simulation model was built up in Plant Simulation
based on the real system and validated against
multiple KPIs (e.g., throughput in units, cycle time
etc.). As the U-cell assembly line is used for
educational purposes, the data from the educational
production runs were used for validation. As
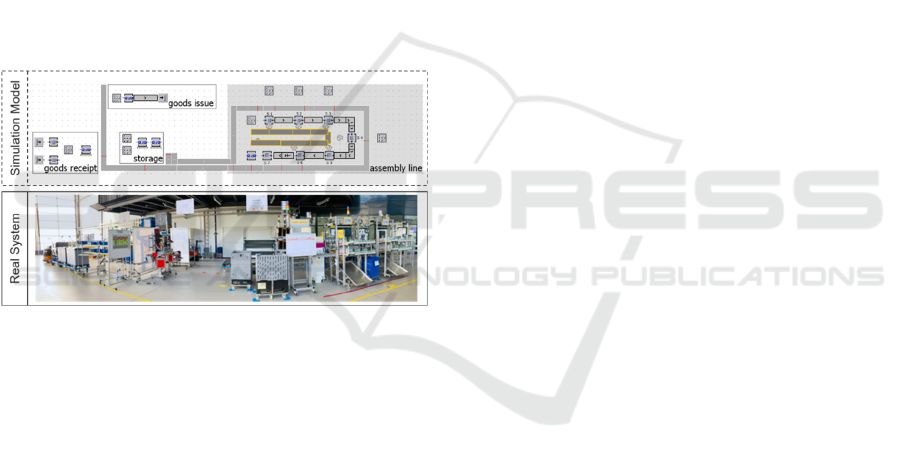
displayed in Figure 2 the whole value stream from
goods reception over storage to assembly and finally
goods issue is simulated. In the considered system,
floor rollers in six different variants are assembled in
seven steps. The input data are the production orders
of the assembly line. Goods reception, storage, and
goods issue are only influenced indirectly through
requests within the U-cell.
Figure 2: Representation of the real system and simulation
model in the TZ PULS.
The identified potential for optimization is that the
assembly line in question has a fluctuating throughput
per working day, resulting in a lower average
throughput than planned. Hence, the considered
target KPI is throughput in units. Since this KPI
depends on many different influencing factors, it was
necessary to narrow down the scope with regard to
the problem to be solved. The following restrictions
have been placed on this: the feasibility of the
solution should not involve any physical changes to
the material flow and should be implementable in a
short time without additional costs. Consequently, the
adjustment of the production order sequence was
identified as a changeable and monitorable control
variable. Thus, the goal was to predict the throughput
in units based on the production order sequence using
ML. The production orders as well as the throughputs
generated by the simulation model are combined to
form the input data for the ML model.
To verify the functionality of the ML model, a set
with 1,000 random production orders sequences
(numpys.random.choice
)
, are prepared. The
distribution of variants within a production order is
60 % for high-runner, 30 % for middle, and 10 % for
least demanded variants. Considering their
distribution within the production orders, the six
different variants were sequenced randomly. The
number of items per production order has been
limited to 751 units, since this number is the
maximum output quantity of the assembly line for
one working day. Each simulation run corresponds to
the processing of a production order per working day
with two shifts and sixteen hours of working time.
The output data of the simulation (=throughput in
units) is used as label.
The first approach was to predict the throughput
in units without clustering. Classic non-linear
regression algorithms (logistic regression, elastic net)
struggle to identify patterns in the data probably
because of the large number of features (751
features). A production order consists of 751 different
products that can be distinctly sequenced according to
its distribution (60 % - 30 % - 10 %). This results in
an extremely large amount of possible production
order sequences (≈10
289
). Hence, regression models
seemed to predict only floating averages. These
predictions showed a ‘mean absolute error’ of 162
units. Consequently, the approach was discarded and
following classification model was selected.
To increase the prediction accuracy the simulation
model results are first clustered into five classes.
K-Means (sklearn.cluster.KMeans) was used to
identify five different clusters. The result of the
clustering replaces the label throughput in units for
the upcoming classification task. Furthermore, the
four clusters with lower yields are grouped together.
Further data preparation contains scaling
(sklearn.preprocessing.StandardScaler) and finally a
PCA (sklearn.decomposition.PCA) step keeping
96 % of the components.
Hence, the class of the ML model is defined as
classification of the KPI throughput in units
represented by previously mentioned clusters (high
and low yield). The objective is to classify whether a
given production order sequence will produce a high
yield or not. Due to the fact that input data can be
categorized as features and output data of the
simulation model as labels, supervised learning can
be applied as ML type. Since this is a classification,
regression algorithms can be named for delimitation
of the algorithm class. For the case study a multilayer
perceptron (MLP) model (sklearn.neural_network.
MLPClassifier) is used for classification. MLP is one
Decision Support for Production Control based on Machine Learning by Simulation-generated Data
59
of a widely used algorithm which consists of a fully
connected input and output layer with multiple hidden
layers and is only feedforward (Goodfellow et al.,
2016). They form the basis of all ANN and are
suitable for unknown structures in the data.
Hence, the classification task has to separate
between the two classes high and low yield. High
yield should contain production order sequences with
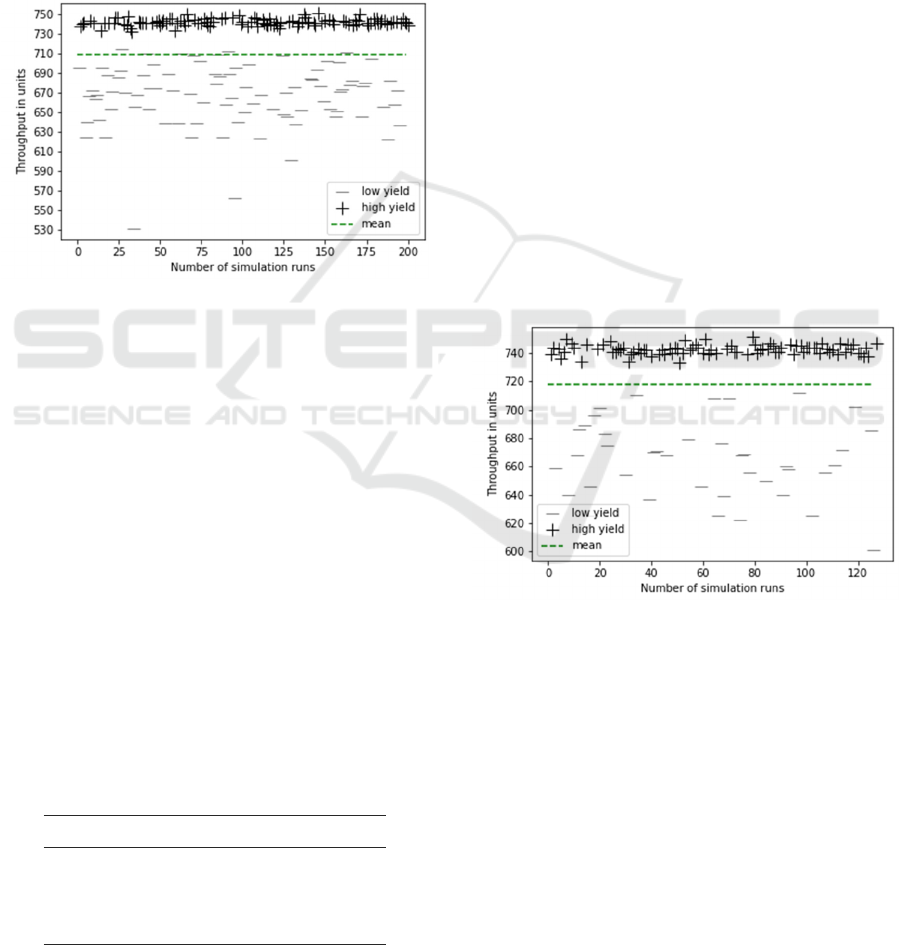
a high throughput in units and vice versa. In Figure 3
training and test data as well as the mean (=708 units)
of the throughput in units - before applying the ML
model - are displayed.
Figure 3: 200 production orders with random sequences
with corresponding throughput in units.
The requirements for the validation of the ML
result were defined as an increase of the average
throughput in units by 1% (≈7 units) of each working
day. To split the dataset into training and test data a
random data split function (sklearn.model_selection.
train_test_split) is used. The results of the
classification are presented below.
4 RESULTS
In order to verify the approach, the predicted results
are compared with the simulated throughputs in units.
The maximum accuracy reached is 68 % with an f1-
score of 73 % for the high yield class (Table 1). In
addition, 60 % of the given production orders are
correctly classified into low yield class.
Table 1: Results of the ML model (MLP).
The precision value shows the true and false
positive rate of all positive values. As seen in Table 1
a majority of prediction is correct. Through recall the
true positive and false negative ratio is described. F1-
score is defined as the harmonic mean of the precision
and recall. Last but not least the accuracy of both
classes shows the correct prediction of the total
number of predictions for the two classes high and
low yield.
The results prove that the approach is able to
identify the high yield class with a high probability.
The classification of the low yield classes is not as
good as that of the high yield classes, i.e., it is harder
to classify production order sequences with lower
throughput in units than vice versa. By applying the
approach presented in this paper, with a 68 %
accuracy of the trained ML model, the mean value of
the throughput in units can be increased by 10 units
from a mean value of 708 units (Figure 3) to 718 units
(Figure 4). Further, the variability of the throughput
has also been reduced. This fulfilled the target of
increasing the average throughput in units by 1 %.
These results confirm the successful application of
the framework by using a simulation model to
generate input data for a ML model in this specific
case study.
Figure 4: Throughput in units of the 127 pre-validated
production orders.
5 DISCUSSON
In the following section the results are discussed. The
implementation of the framework within a case study
shows exemplarily that simulation models can be
used to generate data to train ML models. The results
of classifying the throughput in units based on
production order sequences, shows an accuracy of
68 %. If the accuracy satisfies the requirements of the
process, the ML model can be used as a decision
support tool for planning and control task in
precision recall f1-score
high yield (1) 0.69 0.78 0.73
low yield (2) 0.67 0.55 0.60
accuracy - - 0.68
KMIS 2022 - 14th International Conference on Knowledge Management and Information Systems
60

production and logistics systems. Furthermore, it is
possible to classify the production order sequence
faster than with a simulation model. For the case
study a complete simulation run took 20 seconds
while a single classification required 0.01 seconds.
Although these figures only apply in this specific case
study. Further research on time-savings is required.
This enables faster decision-making as compared to a
simulation model in the presented case study. Also, it
is shown that the framework applied is suitable for
extend an insufficient data basis (quantity and
quality) of processes from production and logistics
systems with additional data in order to train an ML
model. With these results and the provided
limitations, the RQ can be answered: Key elements of
the framework are a well described problem
statement based on target KPIs and control variables,
generated simulation input data based on the
identified control variables, a validated simulation
model for data generation as well as suitable data
preparation step for an appropriate ML model.
The framework can also be applied to other
control processes within production and logistics
systems. Nevertheless, there are still some
limitations. First of all, it should be mentioned that,
there is still room for improvement regarding the ML
model. The determination of suitable AI models with
regard to this specific problem of production order
sequencing has already been studied by (Rissmann et
al., 2022). It can be stated that the application of more
specific ML models, such as deep neural networks,
could provide even better results. Further
investigation is expected to demonstrate how the
application works on other random problems (e.g.,
failures, downtimes etc.) within production and
logistics systems. Furthermore, only the classification
of throughput in units was tested. For other KPIs,
such as the prediction of the production time of
individual units or lead time, the simulation-based
data may have to be enriched.
6 SUMMARY AND OUTLOOK
In this paper, we present a framework that supports
the implementation and training of ML models based
on generated datasets from production and logistics
simulations. To achieve this, the input and output data
of a simulation model are used for training. Thus, ML
models can be developed even in processes with
limited data or insufficient data quality, which can
then be used for decision support. By applying the
approach within an exemplary case study, the ML
model was able to increase the average throughput.
In future research activities, the existing
simulation model is to be supplemented by further
influencing factors such as downtimes and failures.
This will allow the simulation model to reflect a real
production and logistics system even more
accurately. The next research steps will be the
implementation of a data-oriented problem
identification and optimization approach based on
KPIs as well as another verification of the approach
in a real production and logistics system.
FUNDING
This research was supported by KIProLog project
funded by the Bavarian State Ministry of Science and
Art (FKZ: H.2-F1116.LN33/3).
REFERENCES
Agalianos, K., Ponis, S. T., Aretoulaki, E., Plakas, G., and
Efthymiou, O. (2020). Discrete Event Simulation and
Digital Twins: Review and Challenges for Logistics. In:
Procedia Manufacturing 51, pp. 1636–1641.
Bárkányi, Á., Chován, T., Németh, S., and Abonyi, J.
(2021). Modelling for Digital Twins—Potential Role of
Surrogate Models. In: Processes 9 (3), pp. 476.
Blöchl, S. J., and Schneider, M. (2016). Simulation Game
for Intelligent Production Logistics – The PuLL®
Learning Factory. In: Procedia CIRP 54, pp. 130–135.
Fowler, J. W., and Rose, O. (2004). Grand Challenges in
Modeling and Simulation of Complex Manufacturing
Systems. In: SIMULATION 80 (9), pp. 469–476.
Goodfellow, I., Bengio, Y., and Courville, A. (2016). Deep
learning, The MIT Press, Cambridge, Massachusetts,
London, England.
Han, J., Kamber, M., and Pei, J. (2012). Data Mining
Concepts and Techniques, Elsevier.
Hasan, M. S., Ebrahim, Z., Wan Mahmood, W. H., and Ab
Rahman, M. N. (2016). Decision support system
classification and its application in manufacturing
sectore: a review. In: Jurnal Teknologi 79 (1).
Kauke, D., Galka, S., and Fottner, J. (2021). Digital Twins
in Order Picking Systems for Operational Decision
Support. In: Hawaii International Conference on
System Sciences, pp. 1655–1664.
Koot, M., Mes, M. R., and Iacob, M. E. (2021). A
systematic literature review of supply chain decision
making supported by the Internet of Things and Big
Data Analytics. In: Computers & Industrial
Engineering 154, pp. 107076.
Korth, B., Schwede, C., and Zajac, M. (2018). Simulation-
ready digital twin for realtime management of logistics
systems. In: 2018 IEEE International Conference on
Big Data, pp. 4194–4201.
Decision Support for Production Control based on Machine Learning by Simulation-generated Data
61

Kritzinger, W., Karner, M., Traar, G., Henjes, J., and Sihn,
W. (2018). Digital Twin in manufacturing: A
categorical literature review and classification. In:
IFAC-PapersOnLine 51 (11), pp. 1016–1022.
Müller, M., Mielke, J., Pavlovskyi, Y., Pape, A., Masik, S.,
Reggelin, T., and Häberer, S. (2021). Real-time
combination of material flow simulation, digital twins
of manufacturing cells, an AGV and a mixed-reality
application. In: Procedia CIRP 104, pp. 1607–1612.
Nagahara, S., Sprock, T. A., and Helu, M. M. (2019).
Toward data-driven production simulation modeling:
dispatching rule identification by machine learning
techniques. In: Procedia CIRP 81, pp. 222–227.
Pfeiffer, A., Gyulai, D., Kádár, B., and Monostori, L.
(2016). Manufacturing Lead Time Estimation with the
Combination of Simulation and Statistical Learning
Methods. In: Procedia CIRP 41, pp. 75–80.
Qi, Q., and Tao, F. (2018). Digital Twin and Big Data
Towards Smart Manufacturing and Industry 4.0: 360
Degree Comparison. In: IEEE Access 6, pp. 3585–3593.
Rissmann, L., Muehlbauer, K., and Meissner, S. (2022).
Application of Deep Learning based on a Simulation
Model to classify Production Orders. In: Proceedings
of the 34rd European Modeling & Simulation
Symposium, (accepted).
Rose, O. (2007). Improved simple simulation models for
semiconductor wafer factories. In: 2007 Winter
Simulation Conference. Washington, DC, USA, IEEE,
pp. 1708–1712.
Verein Deutscher Ingenieure (2018). Simulation von
Logistik-, Materialfluss- und Produktionssystemen, In:
Verein Deutscher Ingenieure (Ed.), 2018 (3633).
Vernickel, K., Brunner, L., Hoellthaler, G., Sansivieri, G.,
Härdtlein, C., Trauner, L. et al. (2020). Machine-
Learning-Based Approach for Parameterizing Material
Flow Simulation Models. In: Procedia CIRP 93, pp.
407–412.
Vojdani, N., and Erichsen, B. (2018). Ein Ansatz für ein
Predictive-Monitoring-System zur Identifikation von
Störungswirkungen in der Produktionslogistik mittels
künstlichen neuronalen Netzen. In: Logistics journal.
Windt, K., Philipp, T., and Böse, F. (2008). Complexity
cube for the characterization of complex production
systems. In: International Journal of Computer
Integrated Manufacturing 21 (2), pp. 195–200.
KMIS 2022 - 14th International Conference on Knowledge Management and Information Systems
62
