
Towards Evaluating e-Commerce Sites Purchase Intention using
Affective Computing, a Preliminary Study
Hayri Yigit
1
, Javier De Andrés
2a
, Martin González-Rodríguez
3b
, Daniel Fernández-Lanvin
3c
,
Kathia Marçal de Oliveira
4
and Emmanuelle Grislin-Le Strugeon
4,5
1
Department of Computer Science, Mehmet Akif Ersoy University, Antalya Burdur Yolu, 15030 Yakaköy/Burdu, Turkey
2
Depatment of Accounting, University of Oviedo, c/San Francisco 3, 33001, Oviedo, Spain
3
Depatment of Computer Science, University of Oviedo, c/San Francisco 3, 33001, Oviedo, Spain
4
Univ. Polytechnique Hauts-de-France, LAMIH, CNRS, UMR 8201, F-59313 Valenciennes, France
5
INSA Hauts-de-France, F-59313 Valenciennes, France
Keywords: Usability, Affective Computing, e-Commerce.
Abstract: The evaluation of an e-commerce website usability and effectiveness is traditionally measured through
surveys. These tools provide subjective information about the user perception of the website, and their use is
expensive and involve some drawbacks, since it requires the user to collaborate in the study and to control the
sample. In this work, we explore the relation between what the users perceives and shares when they are asked
about their experience, and the emotion they show while using the system under study. We use Affective
Computing algorithms to analyse user expressions, and we compare the results with the information provided
by means of a TAM based survey.
1 INTRODUCTION
The success of any e-commerce website is strongly
determined by the usability of its user interface, and
thus, by the satisfaction of the user that access the site
(Sahi, 2015). The most popular and traditional way to
measure the satisfaction of the user is applying
Technology Acceptance Models (TAMs)
(Marangunić & Granić, 2015), that is, using surveys
that the subject must fulfil after using the product.
Although this method is well tested and accepted, it
has many drawbacks that make it difficult and
expensive to use, especially in frequently updated
web sites, since it requires the subject collaboration
and a controlled sample. Moreover, the results of the
evaluation are based on the subjective perception
from the user, who can be influenced by many factors
(familiarity, learning effect, sympathy for the
website, reluctance to changes, etc.) that could bias
the results, and favour a website over others with
better design and usability.
a
https://orcid.org/0000-0001-6887-4087
b
https://orcid.org/0000-0002-9695-3919
c
https://orcid.org/0000-0002-5666-9809
In order to remove the subjective component, there
are other strategies like, for example, the use of eye-
tracking technologies, which measure the
performance of the user with objective parameters
(Cooke, 2004; Lasa et al., 2015; Rakoczi & Pohl,
2012). However, they usually require onsite
evaluation and technological infrastructure.
On the other hand, one of the emerging and most
active lines of research in Human Computer
Interaction is the one related to the perception of user
emotions though artificial vision algorithms. This is
part of what we know as Affective Computing (AC)
(Ma & Yarosh, 2021). AC algorithms can process the
picture of a subject and classify their emotions
analysing their facial expression. The relation
between emotions, usability and purchase intentions
has been already demonstrated by previous research
works (Eroglu et al., 2001).
In this paper, we try to explore whether the user
emotion captured by AC algorithms while using an e-
commerce site is consistent with the user subjective
perception of usability according to responses to a
Yigit, H., De Andrés, J., González-Rodríguez, M., Fernández-Lanvin, D., Marçal de Oliveira, K. and Strugeon, E.
Towards Evaluating e-Commerce Sites Purchase Intention using Affective Computing, a Preliminary Study.
DOI: 10.5220/0011537200003323
In Proceedings of the 6th International Conference on Computer-Human Interaction Research and Applications (CHIRA 2022), pages 163-170
ISBN: 978-989-758-609-5; ISSN: 2184-3244
Copyright
c
2022 by SCITEPRESS – Science and Technology Publications, Lda. All rights reserved
163

TAM based survey. We designed a prototype that
simulates the purchase process in an e-commerce
website, gathering pictures of the subject and
evaluating them with three different AC algorithms,
and at the same time, we asked users to fulfil the
survey at the end of the process. The results we
obtained, despite the reduced size of the sample, point
out that there is a significant correlation between the
output of the AC algorithms and some questions of
the survey.
2 RELATED WORK
Results from earlier studies demonstrate a strong and
consistent association between user emotions and
purchase behaviour. The most important factor
affecting user emotion on an e-commerce website is
undoubtedly the user interface and user experience
(Eroglu et al., 2001). These authors developed an
exemplary e-commerce site in their study and
conducted a survey with 328 people who tried the
site. They concluded that the environment of the
online shopping site will affect the emotion and
attitude of the user, which in turn will affect the
shopping results (Eroglu et al., 2001). Makkonen et
al. emphasized that, in cases of successful sales, users
are generally in a positive mood. Moreover, they
found that positive emotions are more effective than
negative ones in situations such as satisfaction,
repurchase and recommendation (Makkonen et al.,
2020). In addition, Kemppainen et al. found that the
user interface is a critical factor that can cause
negative emotions (Kemppainen et al., 2020).
Numerous studies have been conducted to evaluate
interface performance based on user feelings.
Although the selected methods are different from
each other, the main idea is to detect the emotions of
the user with the help of sensors while trying a
product, and then to direct a survey to the users and
analyse the data obtained to measure the performance
of the user interface.
2.1 Emotion Detection
Several different dimensions can be used to represent
emotions. For example, the Pleasure, Arousal and
Dominance (PAD) emotion model developed by
Mehrabian et al. uses 3 dimensions to detect all
emotions (Mehrabian & Russell, 1974). In contrast,
Fontaine and Plutchick examined emotions using
more than two dimensions (Fontaine et al., 2007;
Plutchick, 1980). Bhandari et al. used arousal and
valence dimensions to analyse user emotions in their
study examining the effects of design factors
(Bhandari et al., 2017). Johanssen et al., on the other
hand, developed a framework to define usage issues
in mobile applications based on user sentiment, and
tended to divide sentiment into 7 different dimensions
(Johanssen et al., 2019). In their study, Eroglu et al.
experienced that the PAD scheme could not capture
most of the effects of the site atmosphere and
suggested the use of a more inclusive scheme in
nature that includes reactions such as interest, anger,
surprise and disgust (Eroglu et al., 2003). In our
study, similar to such suggestion, we examined
emotions in 7 different dimensions.
Furthermore, many methods such as Galvanic
Skin Response (GSR), Electrodermal Activity
(EDA), Electroencephalogram (EEG),
Electromyography (EMG) and Facial Expression
Recognition (FER) have been used to detect emotions
in research. Gasah et al. used an EEG device to detect
emotions in their study, which was aimed to
determine whether a user interface would create
positive emotions in students (Gasah et al., 2019).
Bhandari et al. used more than one method: Facial-
EMG for valence and EDA for arousal in their study
(Bhandari et al., 2017). Lasa et al. developed a UX
evaluation tool using FER and an eye tracker (Lasa et
al., 2015). Psychophysiological sensors (GSR/EDA,
EEG, EMG etc.) can give the user's emotional state in
real time, but there are some disadvantages associated
with the use of such sensors. Firstly, measurements
made with them can be expensive. Moreover, the use
of these sensors is so intrusive that can disrupt human
nature by distracting the user and hence change the
results of the experiment (Maia & Furtado, 2016). In
our study, we used the facial expression detection
method to detect emotions. No physical contact was
made with the participants, the user carried out the
experiment in his own personal environment, and
only the user's own computer and camera were used
to collect data.
2.2 Measuring Satisfaction with
Surveys
The Technology Acceptance Model (TAM) pretends
to understand how users accept and use a technology
(Marangunić & Granić, 2015). TAM has been used in
many studies covering the subject of Human
Computer Interaction (Tang & Hsiao, 2016). It was
developed by Fred Davis in his study, “What causes
people to accept or reject information technology?”
(Davis, 1989). In response to the question, he
proposed the following bivariate approach.
CHIRA 2022 - 6th International Conference on Computer-Human Interaction Research and Applications
164

Perceived Usefulness: The degree to which a user
believes that a new technology will improve business
performance.
Perceived Ease of Use: The degree to which users
believe that they will not have difficulty using a new
technology.
We used a questionnaire survey method based on
the Technology Acceptance Model in our work.
Questionnaires are useful tools for collecting
subjective data containing users' feelings and
thoughts, and can be used to support the results of the
experiment. To the best of our knowledge, there is not
any de facto standard survey model used in studies
that perform facial expression analysis for emotion
detection. For example, in the research driven by
Mcduff et al., two questionnaires were administered,
one of which was conducted prior to the experiment
(McDuff et al., 2015). The prior experiment questions
were mostly about whether the user liked the ad or
bought the product featured in the ad. The
questionnaire used by Staiano et al. consisted of 3
different sections: (i) UX evaluation; (ii) user's
media-player usage information and (iii)
demographic information. In the user experience
evaluation section, they examined 6 different
dimensions of web site design (Staiano et al., 2012).
Faisal et al. developed a 26-question questionnaire, in
which they assessed web design features (typography,
colour, content quality, interactivity, and navigation)
to determine trust, satisfaction, and loyalty (Faisal et
al., 2017). In this study we used a questionnaire based
on this last paper. The final set of items, which were
measured using a 7-point Likert scale, was the
following:
1. It is easy to read the text on this website with the
used font type and size.
2. The font color is appealing on this website.
3. The text alignment and spacing on this website
make the text easy to read.
4. The color scheme of this website is appealing.
5. The use of color or graphics enhances navigation.
6. The information content helps in buying decisions
by comparing the information about products or
services.
7. The information content provided by this website
meets my needs.
8. Contents and information support for reading and
learning about buying process.
9. This website provides adequate feedback to assess
my progression when I perform a task.
10. This website offers customization.
11. This website offers versatility of ordering process.
12. This website provides content tailored to the
individual.
13. In this website everything is consistent.
14. Navigation aids serve as a logical road map for
buying.
15. Obviousness of buying button and links in this
website.
16. It is easy to personalize or to narrow buying
process.
17. It is easy to learn to use the website.
18. This website supports reversibility of action.
19. Overall I am satisfied with the interface of this
website.
20. My current experience with this website is
satisfactory.
21. Overall. I am satisfied with the amount of time it
took to complete the tasks for buying products.
22. Overall. I am satisfied with accuracy for this
website related to the buying process.
23. I trust the information presented on this website.
24. This website is credible for me.
25.I would visit this website again.
26. I would recommend this website to my friend.
3 OUR APPROACH
Our purpose was to check whether it is possible to
measure the satisfaction of the user with a website
through the analysis of the expressions of their face,
processed by means of affective computing
algorithms. We developed a shopping site simulation
to collect data. To know their subjective perception of
the website, participants were asked to complete two
tasks, browsing the website and completing the
questionnaire about their experience using the
website. Figure 1 shows the method pipeline.
Towards Evaluating e-Commerce Sites Purchase Intention using Affective Computing, a Preliminary Study
165
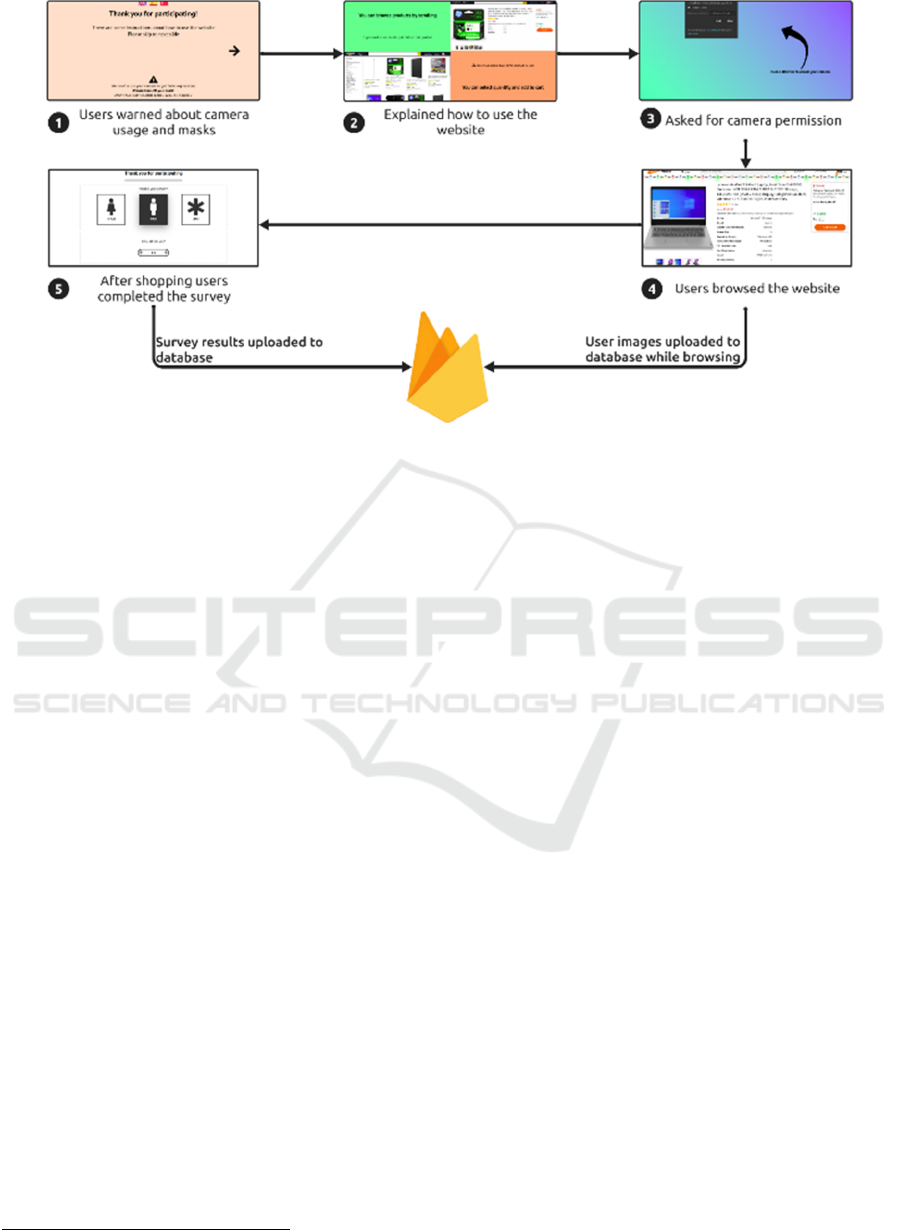
Figure 1: Method pipeline.
3.1 Data Collection
To develop the website user interface, we used the
popular JavaScript library ReactJS
4
. We adapted the
design from a popular shopping website and created
a different look and feel by changing some features in
the design, such as the logo, colours and layout, so as
not to bias participants. Before starting the
simulation, we included a start page that explains how
the participant must use the website, asks them to
remove their masks (when this is relevant) while
using the website, and for the necessary permissions
from the participant so that we can use the camera and
take snapshots.
After obtaining the necessary permissions, the
participant is redirected to the web site and the
purchase simulation starts. To distinguish the
participants, an artificial unique id is assigned to each
of them. The participant is asked to do some simple
tasks: browse the products and add at least 1 product
to the shopping cart to complete the simulation. A
photo of the subject is taken every 2 seconds while
they are browsing the website.
Additionally, photos are taken when the subject
adds a product to the shopping cart and finish the
shopping. The captured photos are saved in the
database in Base64 format in real-time. Moreover, the
information of the page viewed by the user at the time
the photo is taken, and the time information are also
recorded in the database. Due to possible errors,
simulation sessions are limited to 10 minutes in order
4
https://es.reactjs.org/
to avoid taking too many photos of the participants
and therefore to fill the database unnecessarily.
At the end of the simulation, the questionnaire is
shown to the subjects. The questionnaire is presented
in 3 different languages, English, Spanish and
Turkish. This questionnaire is designed based on the
one used by Faisal et al. in a similar study (Faisal et
al., 2017), which was designed based on well tested
previous relevant TAM studies.
In addition to these, Google Analytics web
analytics service, was used to analyse website traffic
and audience. The unique ids we assigned to the
participants enabled us to track each subject
separately.
The Google Cloud Firestore service is used to
store collected data. The website is hosted on Vercel,
a free platform for hosting static websites.
We kept the website open for 3 months. At the end
of the experiment, we wrote a simple JavaScript script
to retrieve data from the database. Survey data was
stored in CSV format. Subjects’ photos were
converted from Base64 format to PNG image format
using a Python script and stored temporarily for use
in the analysis.
3.2 Participants
At the end of the data gathering process, a total of 119
participants visited the site. Although we offer the
survey in 3 different languages (English, Spanish and
Turkish), we made the site accessible to all countries.
Most of the participants were from Pakistan and
CHIRA 2022 - 6th International Conference on Computer-Human Interaction Research and Applications
166
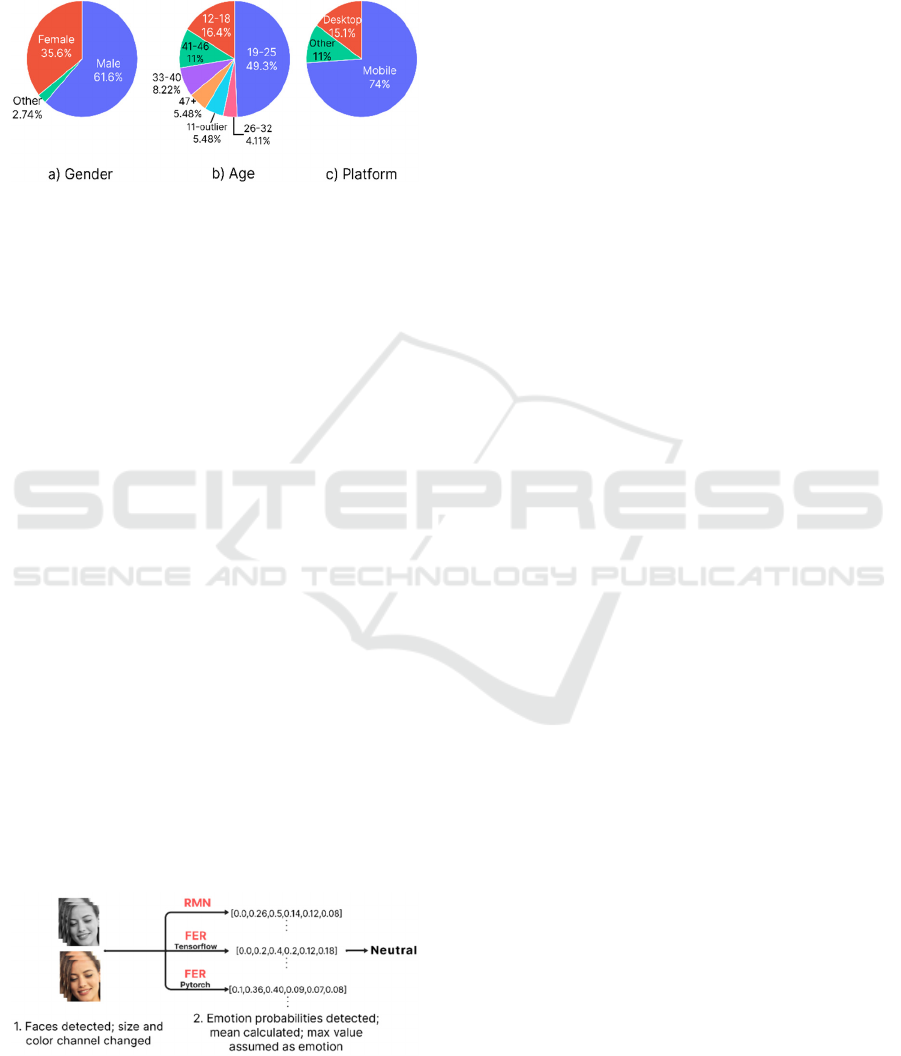
Spain. We did not try to balance factors such as the
gender of the participant or the platform they used so
that the shopping process would proceed naturally.
Figure 2 shows the distribution of participants by
gender, age, and the platform they use.
Figure 2: Distribution of participants by gender, age, and
the platform they use.
Not all respondents who visited the website
completed the survey or were willing to allow their
photos and responses to be recorded. In these cases,
participants' data were not used in the analysis. 61%
of the participants who visited the web site allowed
their photos to be saved and completed the survey.
In addition, not all the participants had a properly
working webcam or they did not read the warnings
carefully and take off their masks before starting the
simulation. After examining the collected
photographs and cleaning the data, 49.3% of the
participants who completed the survey (30.25% of all
participants) provided valid data to be used in the
analysis.
In summary, data from 36 participants, with an
average of 57 photos, were used for the analysis.
3.3 Detecting Facial Expressions
To predict facial expressions, we first detected the
faces of the participants from the captured photos and
then saved these facial photos in the subjects’ folders.
For the sentiment prediction, we used 3 pre-trained
deep learning models that were previously trained on
the facial expression dataset. We mentioned this
process in the Emotion Detection section. Figure 3
shows the facial expression recognition pipeline.
Figure 3: The facial expression recognition pipeline.
3.3.1 Face Detection
MediaPipe is a framework that provides cross-
platform machine learning solutions. We used the
MediaPipe framework's face detection tool to detect
faces. We set the MODEL_SELECTION parameter
to 0. 0 value, which works better at finding faces up
to 2 meters, and parameter 1, better at finding faces
up to 5 meters. For the MIN_DETECTION_CON-
FIDENCE parameter we set 0.5, which means that
face detection is considered successful if the value is
greater than 0.5.
In some photos, more than one face was detected,
in which case we saved the detected faces in a
separate folder and then manually filtered the faces
that did not belong to the participant. We manually
reviewed the obtained data again and removed any
invisible, blurred or duplicate faces.
3.3.2 Facial Expression Detection
We used 3 pre-trained models, trained with ready-
made datasets, to detect facial expressions.
RMN: It was developed using Pytorch, trained using
the FER2013 and VEMO datasets, and achieved
76.82% and 65.94% accuracy on these datasets,
respectively (Pham et al., 2020).
FER-Tensorflow: It was developed using
TensorFlow, trained using the FER2013 dataset and
achieved 65% accuracy (GitHub - Xionghc/Facial-
Expression-Recognition: Facial-Expression-
Recognition in TensorFlow. Detecting Faces in Video
and Recognize the Expression(Emotion)., n.d.).
FER-Pytorch: It was developed using Pytorch,
trained using the FER2013 and CK+ datasets and
achieved 73.12% and 94.64% accuracy on these
datasets, respectively (GitHub - WuJie1010/Facial-
Expression-Recognition.Pytorch: A CNN Based
Pytorch Implementation on Facial Expression
Recognition (FER2013 and CK+), Achieving
73.112% (State-of-the-Art) in FER2013 and 94.64%
in CK+ Dataset, n.d.).
Each model predicts 7 emotions, namely happy, sad,
neutral, angry, fearful, disgusted, surprised. To get
the final result from 3 different predictions, we
averaged each emotion and assumed the emotion with
the highest probability to be the overall emotion of
the participants while shopping. We combined the
results with the survey results and saved them in CSV
format.
Towards Evaluating e-Commerce Sites Purchase Intention using Affective Computing, a Preliminary Study
167
3.4 Data Analysis
Once the data had been gathered, we assessed
whether certain facial expressions were statistically
associated with certain responses to the questions in
the questionnaire. To do this we discarded all the
facial expressions except neutral and sad, as they did
not have enough observations to conduct statistical
tests. For the case of neutral there are 16 cases in the
sample and for the sad expression 15.
As we have only two valid expressions and the
total sample is of small size, we used the non-
parametric Mann-Whitney test (Wilcoxon rank sum
test) instead of the usual t-tests to assess whether the
responses of the participants with sad expression were
significantly different from those of individuals with
neutral expression. Also, as the prior theoretical
developments do not suggest a direction in the
relationship, we used two-tailed tests.
4 RESULTS
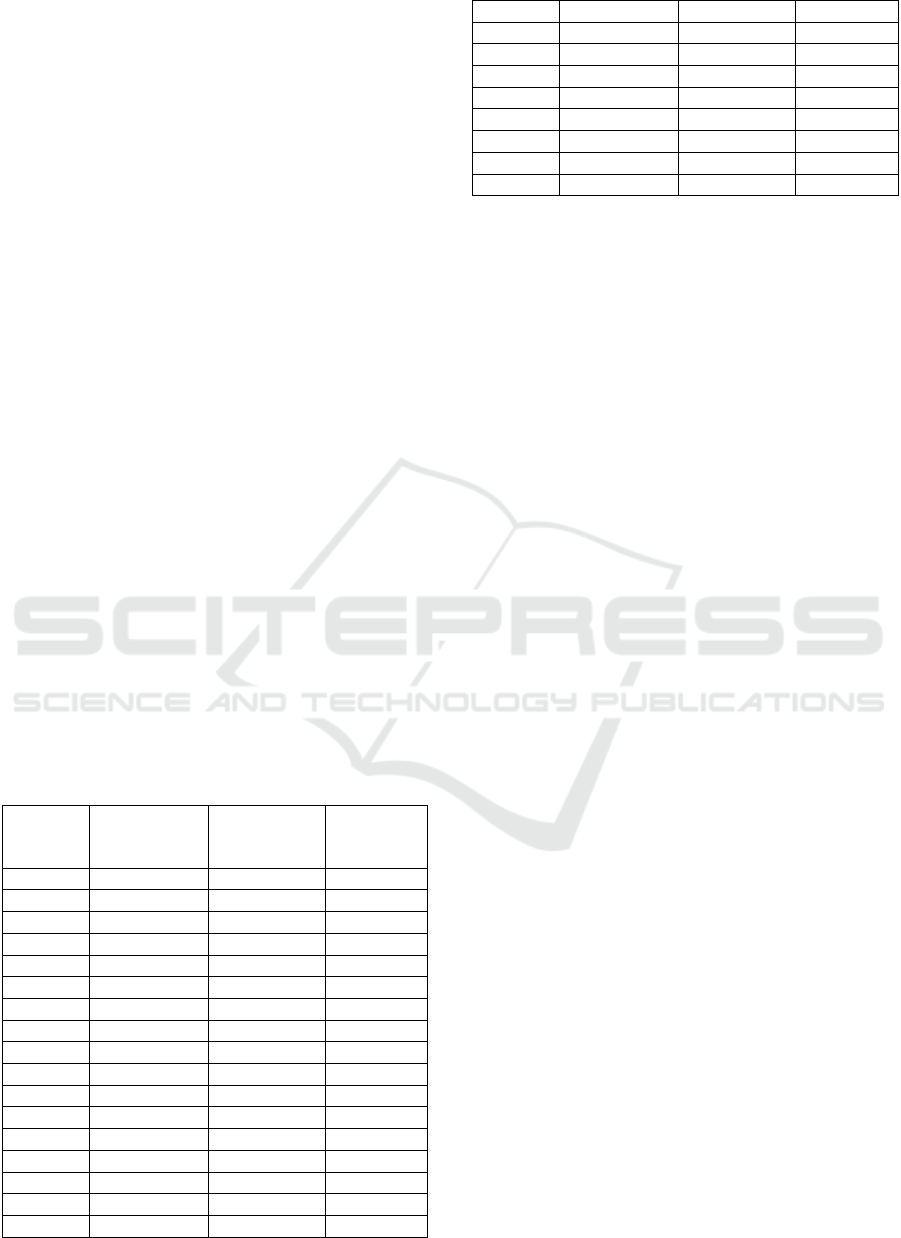
Table 1 shows the results of the Mann-Whitney tests.
The results of each test (one for each question) are
displayed in a row in the table. We include the mean
rank for neutral and sad expressions, and the p-value
associated to the z statistic associated to the Mann-
Whitney’s U in the test. Tests evidencing significant
differences (p<5%) are displayed in bold typeface
while tests suggesting slight differences
(5%<p<10%) are displayed in italics.
Table 1: Results of the Mann-Whitney tests.
Question Mean rank
for neutral
(
n=16
)
Mean rank
for sad
(
n=15
)
p-value
1 10.44 21.93 <0.001
2 13.0
0
19.2
0
0.054
3 12.19 20.07 0.014
4 13.56 18.60 0.115
5 11.06 21.27 0.002
6 13.56 18.60 0.117
7 14.34 17.77 0.284
8 14.50 17.60 0.337
9 17.22 14.70 0.438
10 17.47 14.43 0.348
11 15.56 16.47 0.779
12 16.69 15.27 0.660
13 16.28 15.70 0.856
14 14.50 17.60 0.330
15 13.25 18.93 0.078
16 16.94 15.00 0.549
17 14.66 17.43 0.386
18 15.97 16.03 0.984
19 16.31 15.67 0.842
20 14.69 17.40 0.400
21 14.47 17.63 0.324
22 14.53 17.57 0.347
23 15.34 16.70 0.673
24 14.88 17.20 0.467
25 13.75 18.40 0.148
26 15.91 16.10 0.952
It is evidenced that for questions 1, 3 and 5 the mean
rank for the individuals with sad expression are
significantly higher than the rank for those with
neutral expression. This means that the values
obtained in the questionnaire were significantly
higher for individuals with a sad expression. Then,
this kind of users finds easier to read the text with a)
the used font type and size and b) the text alignment
and spacing. Users with sad expression have also a
stronger conviction that colour / graphics in the
website enhance navigation. For questions 2 and 15
the test evidences that differences, if not so strong, are
still present. So, the font colour is slightly more
appealing for sad users and they find a bit more
obvious the buying button and links in the website.
For the rest of the questions, tests do not show
significant differences.
5 CONCLUSION
These results of the study are initially confusing. The
three questions that evidence a strong relation with
subjects showing a sad expression are emphasizing
positive aspects of the design (regarding font, text
layout and readability and colours selection). That is,
results suggest that users who appreciate these aspects
of the design as positive are sad. After analysing the
results, we reviewed the pictures classified as sad by
the algorithms, and what we found out is that most of
them seem to be concentrated instead of sad. Thus, it
seems more reasonable to think that users that found
out the application more useable where more focused
on the task and so, were classified as sad.
Obviously, this is just a conjecture, and should be
checked with a new experiment, so we cannot assume
that as a valid result of the experiment. Nevertheless,
results suggest that there is a relation between the
subjective perception of some of the aspects of the
design and the information we gather using AC
algorithms. This encourages us to repeat the
experiment with a bigger and controlled sample of
users.
CHIRA 2022 - 6th International Conference on Computer-Human Interaction Research and Applications
168

ACKNOWLEDGEMENTS
This work was funded by the Scientific and
University Department – SCAC of the Embassy of
France in Spain (French Institute of Spain REF: Grant
02/2021) and the Department of Science, Innovation
and Universities (Spain) under the National Program
for Research, Development and Innovation (Project
RTI2018-099235-B-I00).
REFERENCES
Bhandari, U., Neben, T., Chang, K., & Chua, W. Y. (2017).
Effects of interface design factors on affective
responses and quality evaluations in mobile
applications. Computers in Human Behavior, 72, 525–
534. https://doi.org/10.1016/j.chb.2017.02.044
Cooke, L. (2004). Improving usability through eye tracking
research. IEEE International Professional
Communication Conference, 195–198. https://doi.org/
10.1109/IPCC.2004.1375297
Davis, F. D. (1989). Perceived usefulness, perceived ease
of use, and user acceptance of information technology.
MIS Quarterly: Management Information Systems,
13(3), 319–339. https://doi.org/10.2307/249008
Eroglu, S. A., Machleit, K. A., & Davis, L. M. (2001).
Atmospheric qualities of online retailing: A conceptual
model and implications. Journal of Business Research,
54(2), 177–184. https://doi.org/10.1016/S0148-
2963(99)00087-9
Eroglu, S. A., Machleit, K. A., & Davis, L. M. (2003).
Empirical Testing of a Model of Online Store
Atmospherics and Shopper Responses. Psychology and
Marketing, 20(2), 139–150. https://doi.org/10.1002/
mar.10064
Faisal, C. M. N., Gonzalez-Rodriguez, M., Fernandez-
Lanvin, D., & Andres-Suarez, J. De. (2017). Web
Design Attributes in Building User Trust, Satisfaction,
and Loyalty for a High Uncertainty Avoidance Culture.
IEEE Transactions on Human-Machine Systems, 47(6),
847–859. https://doi.org/10.1109/THMS.2016.2620901
Fontaine, J. R. J., Scherer, K. R., Roesch, E. B., &
Ellsworth, P. C. (2007). The world of emotions is not
two-dimensional. Psychological Science, 18(12),
1050–1057. https://doi.org/10.1111/j.1467-9280.2007.
02024.x
Gasah, M., Hidayah, N., Zain, M., & Baharum, A. (2019).
An approach in creating positive emotion for children’s
e-learning based on user interface design. Indonesian
Journal of Electrical Engineering and Computer
Science, 13(3), 1267–1273. https://doi.org/10.11591/
ijeecs.v13.i3.pp1267-1273
GitHub - WuJie1010/Facial-Expression-
Recognition.Pytorch: A CNN based pytorch
implementation on facial expression recognition
(FER2013 and CK+), achieving 73.112% (state-of-the-
art) in FER2013 and 94.64% in CK+ dataset. (n.d.).
Retrieved May 17, 2022, from https://github.com/
WuJie1010/Facial-Expression-Recognition.Pytorch
GitHub - xionghc/Facial-Expression-Recognition: Facial-
Expression-Recognition in TensorFlow. Detecting
faces in video and recognize the expression(emotion).
(n.d.). Retrieved May 17, 2022, from
https://github.com/xionghc/Facial-Expression-
Recognition
Johanssen, J. O., Bernius, J. P., & Bruegge, B. (2019).
Toward usability problem identification based on user
emotions derived from facial expressions. Proceedings
- 2019 IEEE/ACM 4th International Workshop on
Emotion Awareness in Software Engineering,
SEmotion 2019, 1–7. https://doi.org/10.1109/SEmot
ion.2019.00008
Kemppainen, T., Makkonen, M., & Frank, L. (2020).
Exploring online customer experience formation: How
do customers explain negative emotions during online
shopping encounters? 32nd Bled EConference
Humanizing Technology for a Sustainable Society,
BLED 2019 - Conference Proceedings, June, 655–675.
https://doi.org/10.18690/978-961-286-280-0.35
Lasa, G., Justel, D., & Retegi, A. (2015). Eyeface: A new
multimethod tool to evaluate the perception of
conceptual user experiences. Computers in Human
Behavior, 52, 359–363. https://doi.org/10.1016/j.chb.
2015.06.015
Ma, H., & Yarosh, S. (2021). A Review of Affective
Computing Research Based on Function-Component-
Representation Framework. IEEE Transactions on
Affective Computing, 1–1. https://doi.org/10.1109/
TAFFC.2021.3104512
Maia, C. L. B., & Furtado, E. S. (2016). A study about
psychophysiological measures in user experience
monitoring and evaluation. ACM International
Conference Proceeding Series, Part F1280.
https://doi.org/10.1145/3033701.3033708
Makkonen, M., Riekkinen, J., Frank, L., & Jussila, J.
(2020). The effects of positive and negative emotions
during online shopping episodes on consumer
satisfaction, repurchase intention, and recommendation
intention. 32nd Bled EConference Humanizing
Technology for a Sustainable Society, BLED 2019 -
Conference Proceedings, June, 931–953.
https://doi.org/10.18690/978-961-286-280-0.49
Marangunić, N., & Granić, A. (2015). Technology
acceptance model: a literature review from 1986 to
2013. Universal Access in the Information Society,
14(1), 81–95. https://doi.org/10.1007/s10209-014-
0348-1
McDuff, D., Kaliouby, R. El, Cohn, J. F., & Picard, R. W.
(2015). Predicting Ad Liking and Purchase Intent:
Large-Scale Analysis of Facial Responses to Ads. IEEE
Transactions on Affective Computing, 6(3), 223–235.
https://doi.org/10.1109/TAFFC.2014.2384198
Mehrabian, Albert., & Russell, J. A. (James A. (1974). An
approach to environmental psychology. 266.
Pham, L., Vu, T. H., & Tran, T. A. (2020). Facial
expression recognition using residual masking network.
Proceedings - International Conference on Pattern
Towards Evaluating e-Commerce Sites Purchase Intention using Affective Computing, a Preliminary Study
169

Recognition, 4513–4519. https://doi.org/10.1109/ICPR
48806.2021.9411919
Plutchick, R. (1980). A General Psychoevolutionary
Theory of Emotion. In Theories of Emotion (pp. 3–33).
Academic Press. https://doi.org/10.1016/b978-0-12-
558701-3.50007-7
Rakoczi, G., & Pohl, M. (2012). Visualisation and analysis
of multiuser gaze data: Eye tracking usability studies in
the special context of e-learning. Proceedings of the
12th IEEE International Conference on Advanced
Learning Technologies, ICALT 2012, 738–739.
https://doi.org/10.1109/ICALT.2012.15
Sahi, G. (2015). User satisfaction and website usability:
Exploring the linkages in B2C E-commerce context.
2015 5th International Conference on IT Convergence
and Security, ICITCS 2015 - Proceedings.
https://doi.org/10.1109/ICITCS.2015.7293034
Staiano, J., Menéndez, M., Battocchi, A., De Angeli, A., &
Sebe, N. (2012). UX_Mate: From Facial Expressions
to UX Evaluation. 741. https://doi.org/10.1145/23179
56.2318068
Tang, K., & Hsiao, C.-H. (2016). The Literature
Development of Technology Acceptance Model.
International Journal of Conceptions on Management
and Social Sciences, 4(1), 1–4.
CHIRA 2022 - 6th International Conference on Computer-Human Interaction Research and Applications
170
