Segmenting Overlapping Red Blood Cells With Classical Image
Processing and Deep Learning
Nils Br
¨
unggel, Pascal Vallotton
a
and Patrick Conway
Roche Diagnostics
Keywords:
Machine Learning, Deep Learning, Semantic Segmentation, Hematology.
Abstract:
In hematology the ability to count and analyze red blood cells (RBCs) is of major importance. Roche’s propri-
etary Bloodhound
®
technology allows the automated printing and staining of slides to generate a monolayer
of blood cells. While the RBCs are spread evenly, overlaps cannot be avoided completely. In the presence of
such overlaps several tasks become problematic such as counting cells, quantifying the mean cellular volume
or measuring cell shapes, critical for particular conditions such as anisocytosis (RBCs that are unequal in size)
or rouleaux (clumps of RBCs that look like stacked coins). Modern deep learning models such as U-Net make
it possible to accurately segment images given the appropriate training data (images and segmentation masks).
The U-Net paper highlights the ability to train a model with only few images by applying data augmenta-
tion. We apply the learnings from their work and show that the mask creation can largely be automated: We
collected images of free-standing RBCs, automatically segmented these using traditional image processing
algorithms and combined these to generate artificial overlaps. We then used these images to train a model and
show that it generalizes to real overlaps.
1 INTRODUCTION
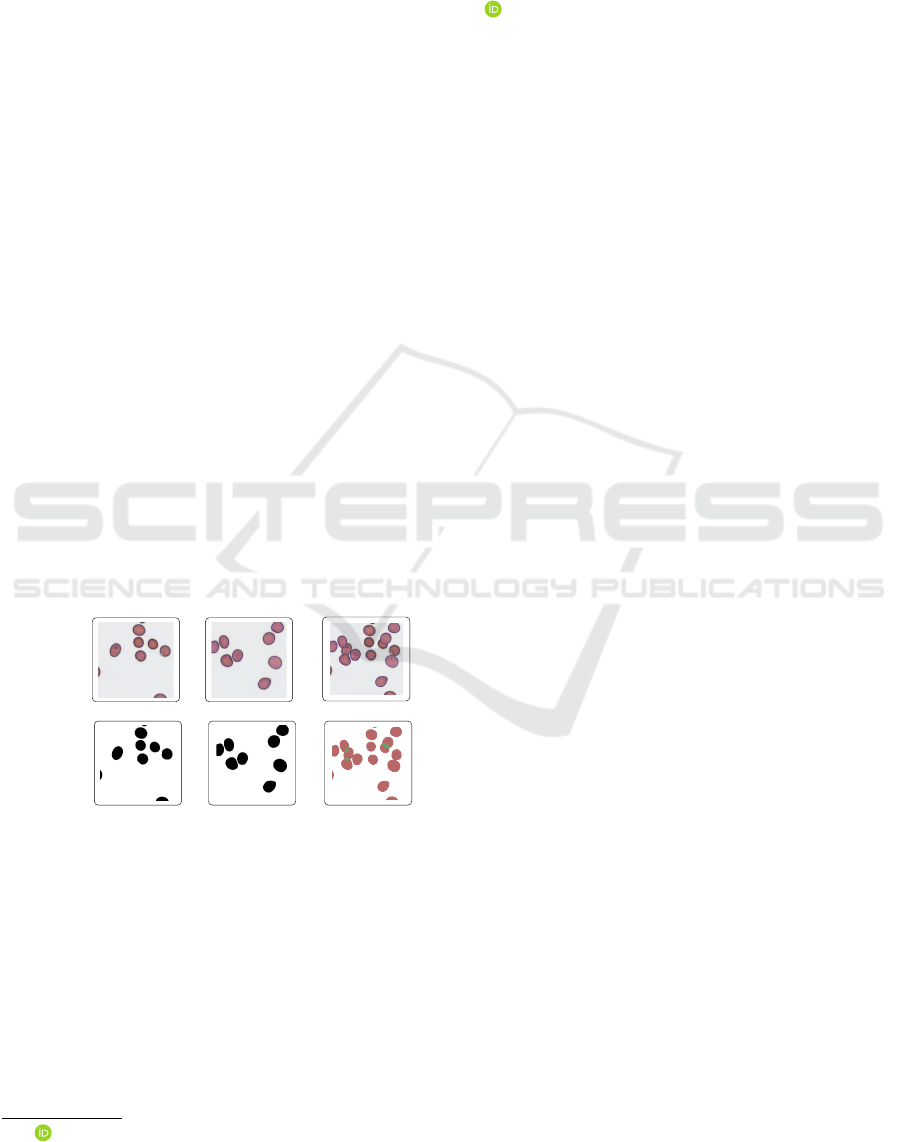
Sparse RBC Images
Automatically Generated Masks
overlap(
,
) =
+ =
Figure 1: Images of non-overlapping RBCs can easily be
segmented. Those images are then combined to generate
artificial overlaps. The masks are summed to obtain a three-
class mask.
To analyze a blood sample for hematological disor-
ders, a medical technologist traditionally creates a
blood smear on a glass slide. The smear is made with
an automated slide maker or by manually dispearsing
a drop of blood on a slide. In the so called feathered
edge region of the blood smear, the cells should be
spread evenly; allowing the microscopic analysis of
these cells. This region is also referred to as a mono-
a
https://orcid.org/0000-0002-4159-1447
layer (see (Bain, 2014), chapter 1 for details). Most
red blood cells (RBCs) in the monolayer are free-
standing. However it is common to find overlapping
RBCs and clumps as well. The cells at the beginning
and end of the smear are squashed together and cannot
be examined. We exclude these cells in our analysis
and focus on the cells in the monolayer.
Roche’s proprietary Bloodhound
®
technology al-
lows the automated printing and staining of blood,
creating a monolayer of cells (Bruegel et al., 2018).
The cells are spread evenly across the whole print,
only the cells at the border are squashed together.
RBC overlaps cannot be avoided completely either:
In the presence of such overlaps several tasks become
problematic such as counting cells, quantifying the
mean cellular volume or measuring cell shapes rel-
evant for particular conditions such as anisocytosis
(RBCs that are unequal in size) or rouleaux (clumped
RBCs that resemble a stack of coins, see (Bain, 2014)
chapter 3, page 97 for more information). Since
we print whole blood, sometimes platelets and white
blood cells (WBCs) can be seen too. In this work
we focus on segmenting RBCs, therefore WBCs and
platelets belong to the background class.
Modern deep learning models such as U-Net
(Ronneberger et al., 2015) showed that it is possi-
ble to accurately segment biomedical images given
the appropriate training data (images and pixel-wise
segmentation masks). The U-Net paper highlights the
ability to train a model with only few images by ap-
plying data augmentation. We apply these learnings
and focus on the automatic creation of masks: We col-
lected images of free-standing RBCs, automatically
segmented these using traditional image processing
and combined these to create artificial overlaps. We
then use these artificial images to train a U-Net model
and show that it generalizes to real overlaps.
2 RELATED WORK
The introduction of deep learning methodology
specifically to the analysis of overlapping RBCs is
relatively recent, so the literature on the topic is still
sparse. Most publications on this topic use classi-
cal image processing algorithms (for example (Naru-
enatthanaset et al., 2021) or (Moallem et al., 2018)).
Recently, Zhang et al. (2020) used a modified U-
Net to segment and classify RBCs with various ab-
normal shapes. They observed that a vanilla U-Net
often makes three types of errors when segmenting
RBC images into background and cell classes:
1. Failure to properly separate non-touching cells.
2. Artefacts (such as dirt spots) segmented as cells.
3. Incompletely segmented cells.
It should be noted that these errors often do not af-
fect common performance metrics (eg IOU) by much,
because the vast majority of pixels are still classified
correctly with these errors present. They describe the
use of deformable convolutions (originally introduced
by Dai et al. (2017)) which can learn to adapt their
receptive fields. Using their “deformable U-Net” they
are able to lower the rate of these errors by large mar-
gins. Combining their approach with our ground truth
generation technique is a potential research direction.
Another recent deep learning approach exploited
a combination of U-Net foreground mask with Faster
R-CNN (Kassim et al., 2021). This allowed the au-
thors to reach impressive red blood cell counting per-
formance on malaria smear images. To the best of
our knowledge, our approach to ground truth mask
generation has not been described in a deep learning
context yet.
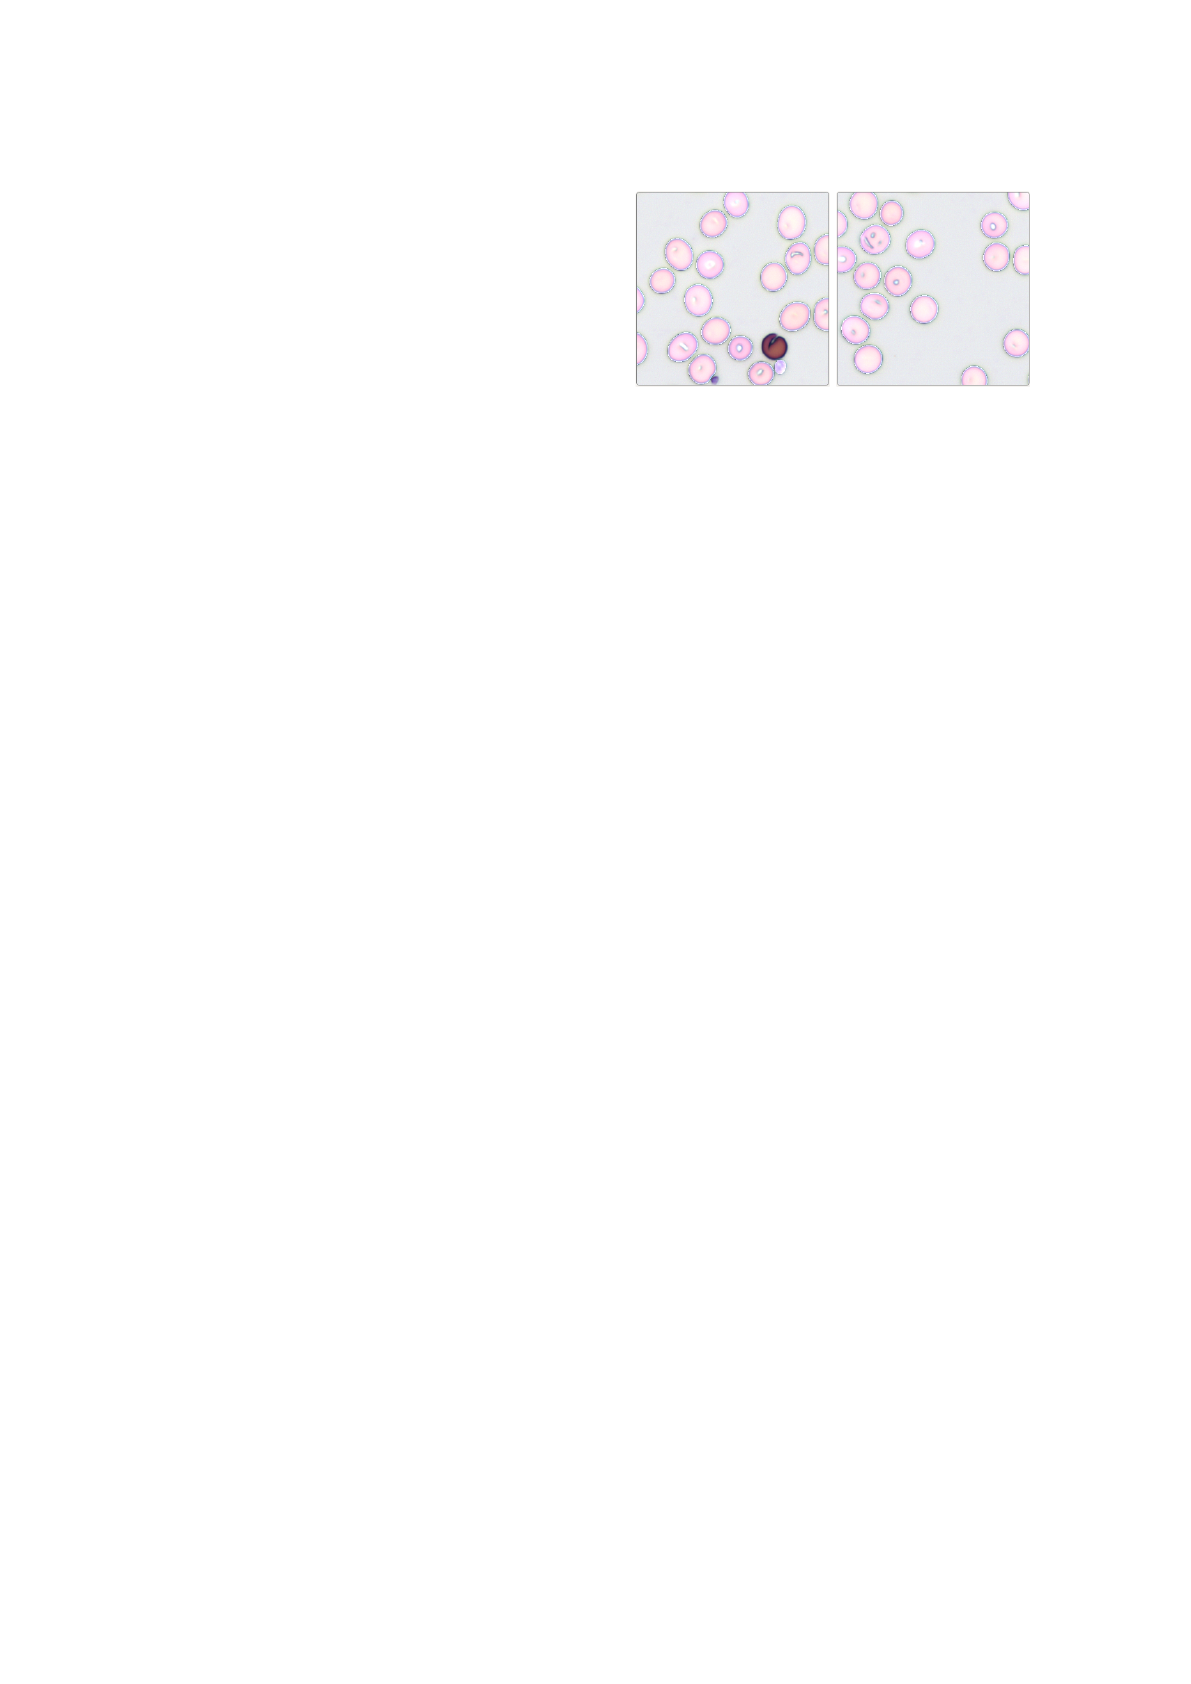
Figure 2: Shows the mask review app. Most of the auto-
matically generated masks are correct (right), but there are
a few mistakes (left): An RBC is missing and a platelet is
wrongly classified as RBC.
3 MATERIALS AND METHODS
3.1 Data Collection
We collected 2’300 image crops (300x300 pixels) of
non-overlapping red blood cells from a Romanowsky
stained slide. The full frame images (2024x1512 pix-
els) were manually selected to ensure that they con-
tain no overlaps. From those we randomly cropped
out squares images for model training. The slides
were printed and stained using Roche’s proprietary
slide printing method (Bruegel et al., 2018). For
imaging we used an automated microscope with a 20x
magnification. The images were then segmented by
a simple algorithm that involves edge detection with
a Laplacian filter (OpenCV Team, 2020), the removal
of small objects and a binary opening. After the initial
segmentation we reviewed the images and corrected
the few masks that had mistakes in it. For this we de-
veloped a webapp that shows the image with the mask
overlay to the user (see figure 2). For mask correction
we used the freely available GNU Image Manipula-
tion Program (GIMP) (Kimball and Mattis, 2018) and
overlaid the binary mask as a separate layer on top of
the image.
3.2 Artificial Overlaps
By overlapping every (non-overlapping) RBC image
with every other RBC image, we could create a very
large dataset from just a few real images. However
we noticed that if we only do that, the model quickly
overfits to the training and validation set and does not
generalize to real overlaps. Instead it is important to
understand the visual variations of RBC overlaps that
can typically be found on microscopic images. Fig-
ure 4 shows two different kinds of overlaps: The two
cells marked in red simply overlap: The cell on the
top partially occludes the cell below. The two cells
marked in blue look like they are fused together.
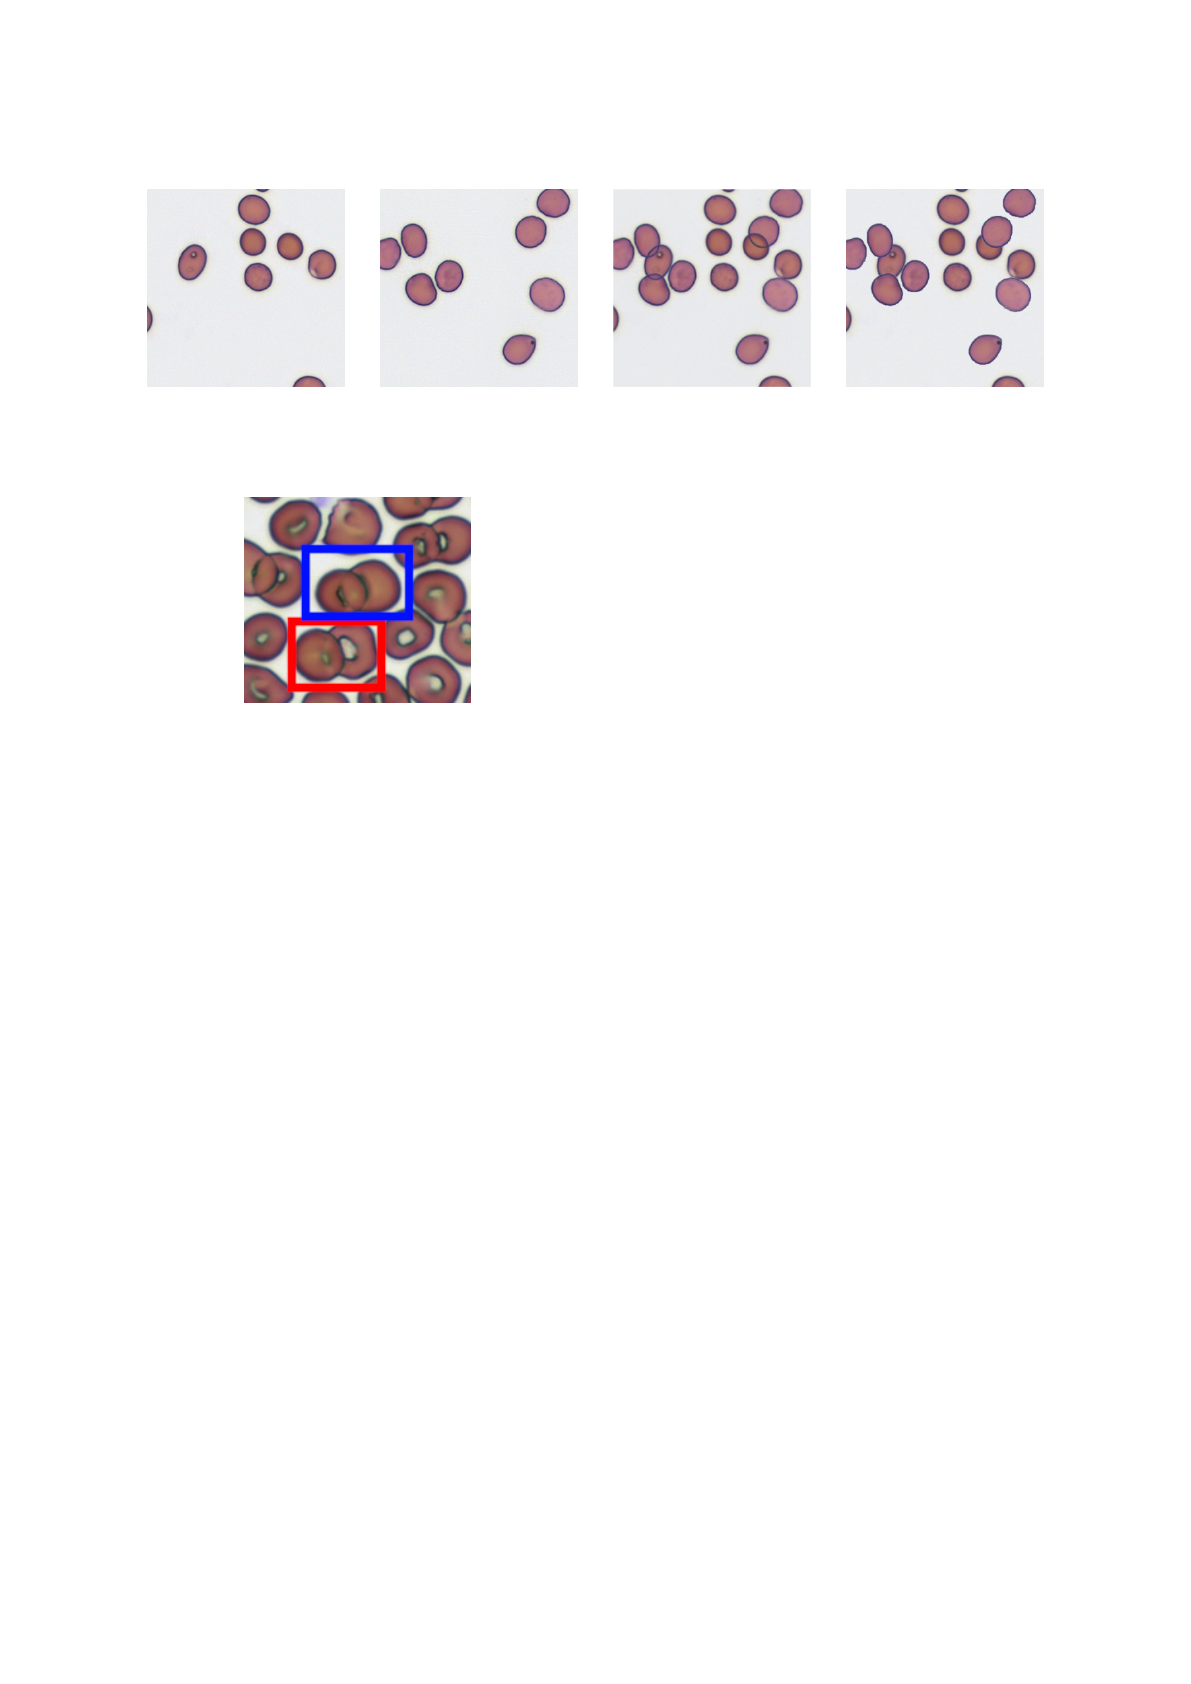
(a) first image (b) second image (c) min(a, b) (d) b over a
Figure 3: Simulated overlaps: Using two images with non-overlapping RBCs (a and b) we can generate two types of overlaps
(image c and d).
Figure 4: Real RBCs overlaps, note that the overlaps
marked in red and blue are visually very different.
We found that these two types of overlaps can
largely be simulated by either taking the minimum
of both images (figure 3, c) or by drawing the RBCs
from one image over the other image (figure 3, d).
Note that when comparing these images to figure 4
they look somewhat synthetic: In image c the edges
of both cells are very sharp and clearly visible in the
overlapping region, this is not the case in the real ex-
ample where the edge of the right cell on the left side
of the overlap is not always clearly visible (marked
in blue). In image d the edges of the cell on the top
are very sharp in the overlapping area. In the actual
overlap they appear a bit softer (figure 4, marked in
red). The sharp edge in image d is caused by cutting
out the RBC using a binary mask which leads to an
immediate large change in color values.
We also simulate Rouleaux by overlapping images
with themselves, moved by a few pixels (randomly
chosen between 20 and 30) in a randomly chosen di-
rection.
Empirically, we found that two additional steps
are needed to create images that can be used to train a
model that generalizes to images with real overlaps:
1. Combine both types of overlaps with a weighted
sum, where the weight is drawn from a bathtub
shaped distribution: We noticed that the real over-
laps never exactly look like the artificial overlaps
in figure 3 (image c and d; compare this to the real
overlaps in figure 4). But the cases where either
the cell at the bottom is almost invisible in the re-
gion of the overlap or that both cells are clearly
visible dominate. More precisely we use the fol-
lowing formula to calculate the final image:
a ∼ Beta(α, β)
i = a ·i
min
+ (1 − a) · i
over
,
where i is the final image and i
min
and i
over
are the
artificial overlaps as explained above. We chose
α and β to be 0.7 to obtain a bathtub shaped beta
distribution.
2. Randomly choose 50% of the generated images
for blurring. Apply Gaussian blur to the chosen
images with σ ∈ [1, 2] (uniformly chosen).
3.3 Dataset
The final dataset we used for training consists of the
following parts:
1. Artificial overlaps: For each image of the 2’300
collected images we randomly chose another im-
age and overlap it according to the procedure de-
scribed above.
2. Artificial rouleaux: 30 images (again randomly
chosen) that are overlapped with itself to simulate
rouleaux.
3. Manually corrected masks: 12 images from an-
other slide that contain many overlapping RBCs.
The masks were obtained by running an earlier
model and then fixing all the mistakes in these
masks manually.
3.4 Data Augmentation and Traning
We used fastai’s (Howard and Gugger, 2020) U-
Net implementation which takes a modern backbone
(e.g. ResNet 50) and turns it into a U-Net (Fastai
Team, 2020b). Please note that this model differs in
the details from the original U-Net implementation:
For example it does not include a dropout layer and
it relies on PixelShuffle ICNR upsampling (Aitken
et al., 2017) for artefact-free upsampling. The model
was trained with fastai’s data augmentation turned
on (Howard and Gugger, 2020, chapter 5.5). We
only differed from the default settings (Fastai Team,
2020a) by setting rotation to 5 degrees and enabling
flips (horizontal and vertical). We used the vanilla
cross-entropy loss function (PyTorch Team, 2020)
from PyTorch (Paszke et al., 2019) for training.
4 RESULTS
We found an average pixel-wise intersection over
union (IOU) on our validation set (20% random split
from the training data) of 98.90%. Since the vali-
dation set consists mostly of artificial overlaps, this
metric is not too informative. Instead it is interesting
to look at cases of real overlaps. We created a test
set consisting of RBC images with real overlaps from
separate slides (with blood from other patients), none
of which were included in the training or validation
set. The images differ slightly from slide-to-slide be-
cause of print, stain and patient variations. The masks
used to calculate the IOU were created as described
in section 3.1 with the addition of manual annotated
overlaps.
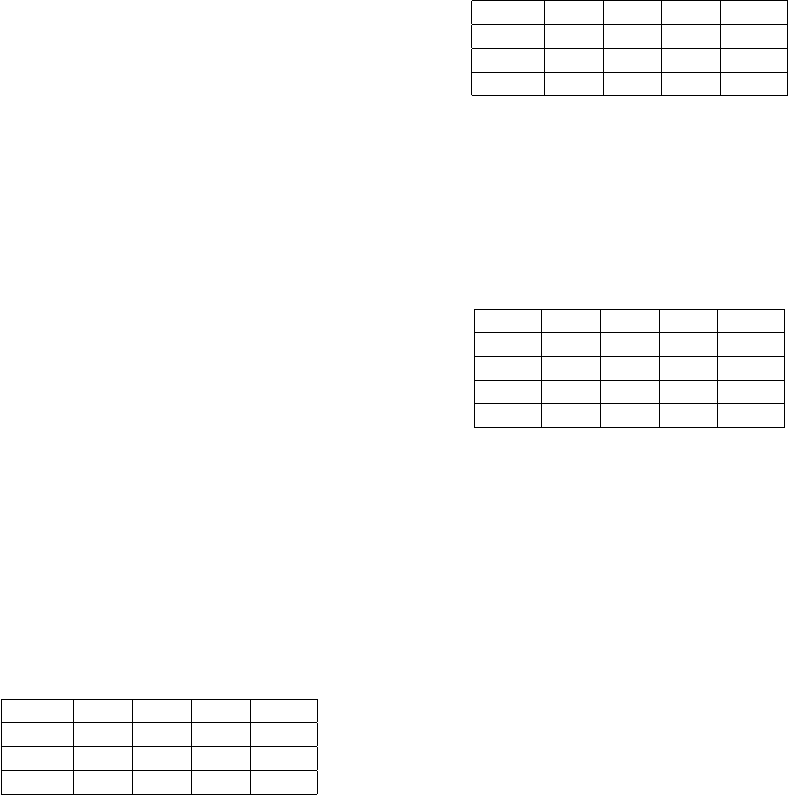
Table 1: IOUs for the normal RBC images, shown in figure
5 (bg stands for background and over for overlaps).
image bg rbc over mean
a 0.98 0.95 0.82 0.92
b 0.97 0.97 0.78 0.91
c 0.92 0.93 0.53 0.80
Figure 5 shows the predicted masks on a normal
slide. The IOUs for each image are shown in table 1.
The model predicts most of the RBCs (red) and over-
laps (green) correctly. However there are a few mis-
takes: Part of a platelet was mistaken for an RBC (b)
and not every RBC that sticks to the white blood cell
at the top left could be segmented correctly (c). We
found some cases where the initial segmentation al-
gorithm confused platelets with RBCs (see figure 2),
which could be the reason for the wrongly segmented
platelet in figure 5 b. The training set does not con-
tain enough examples of overlapping RBCs that stick
to white blood cells. This is probably the reason why
the segmentation works poorly in this area.
Figure 6 shows the segmentation results on a slide
with rouleaux. The IOUs for each image are shown
in table 2. Note that most overlaps are predicted cor-
Table 2: IOUs for the rouleaux RBC images, shown in fig-
ure 6.
image bg rbc over mean
a 0.96 0.88 0.56 0.80
b 0.95 0.91 0.59 0.82
c 0.98 0.95 0.5 0.81
rectly. However the IOUs for the overlaps are lower,
which is not surprising given that this is an abnormal
case. There are a few cases where only part of the
overlap was detected, hinting that the model can be
improved with more data.
Table 3: IOUs for the test set consisting of 36 crops from 3
normal slides.
- bg rbc over mean
mean 0.96 0.96 0.65 0.86
std 0.02 0.02 0.11 0.04
min 0.90 0.89 0.21 0.72
max 0.99 0.98 0.79 0.91
For a quantitative evaluation we used three addi-
tional normal slides: From each slide we chose three
full frame images that show a reasonable degree of
RBC overlaps. We then randomly selected four crops
from each image resulting in 12 crops per slide, 36
in total. The masks were created as described ear-
lier. Table 3 shows the IOUs for each class across
all image crops. The IOUs for background (bg) and
RBCs are very high which is not surprising, given that
we can segment freestanding RBCs easily with sim-
ple image processing. There are multiple reasons for
the lower IOU for the overlap (over) class:
• Images with very few overlaps: If the model
misses a small overlap in such an image the IOU
will be very low. From the standard deviation
(std), min and max rows it can be seen that the
overlap IOU varies a lot between different images.
• Manual masks: It is very hard to correctly seg-
ment the overlaps down to individual pixels. By
looking at a magnified image it is often not clear
where exactly the overlap starts and ends.
• As described above the model still fails to cor-
rectly segment some overlaps, mitigating this as-
pect will require more data.
Summarizing the results in just a single metric
only gives a very high level picture of how well the
model actually performs. We encourage the interested
reader to examine the provided dataset and code to
investigate in detail how the model performs in each
case we provide.
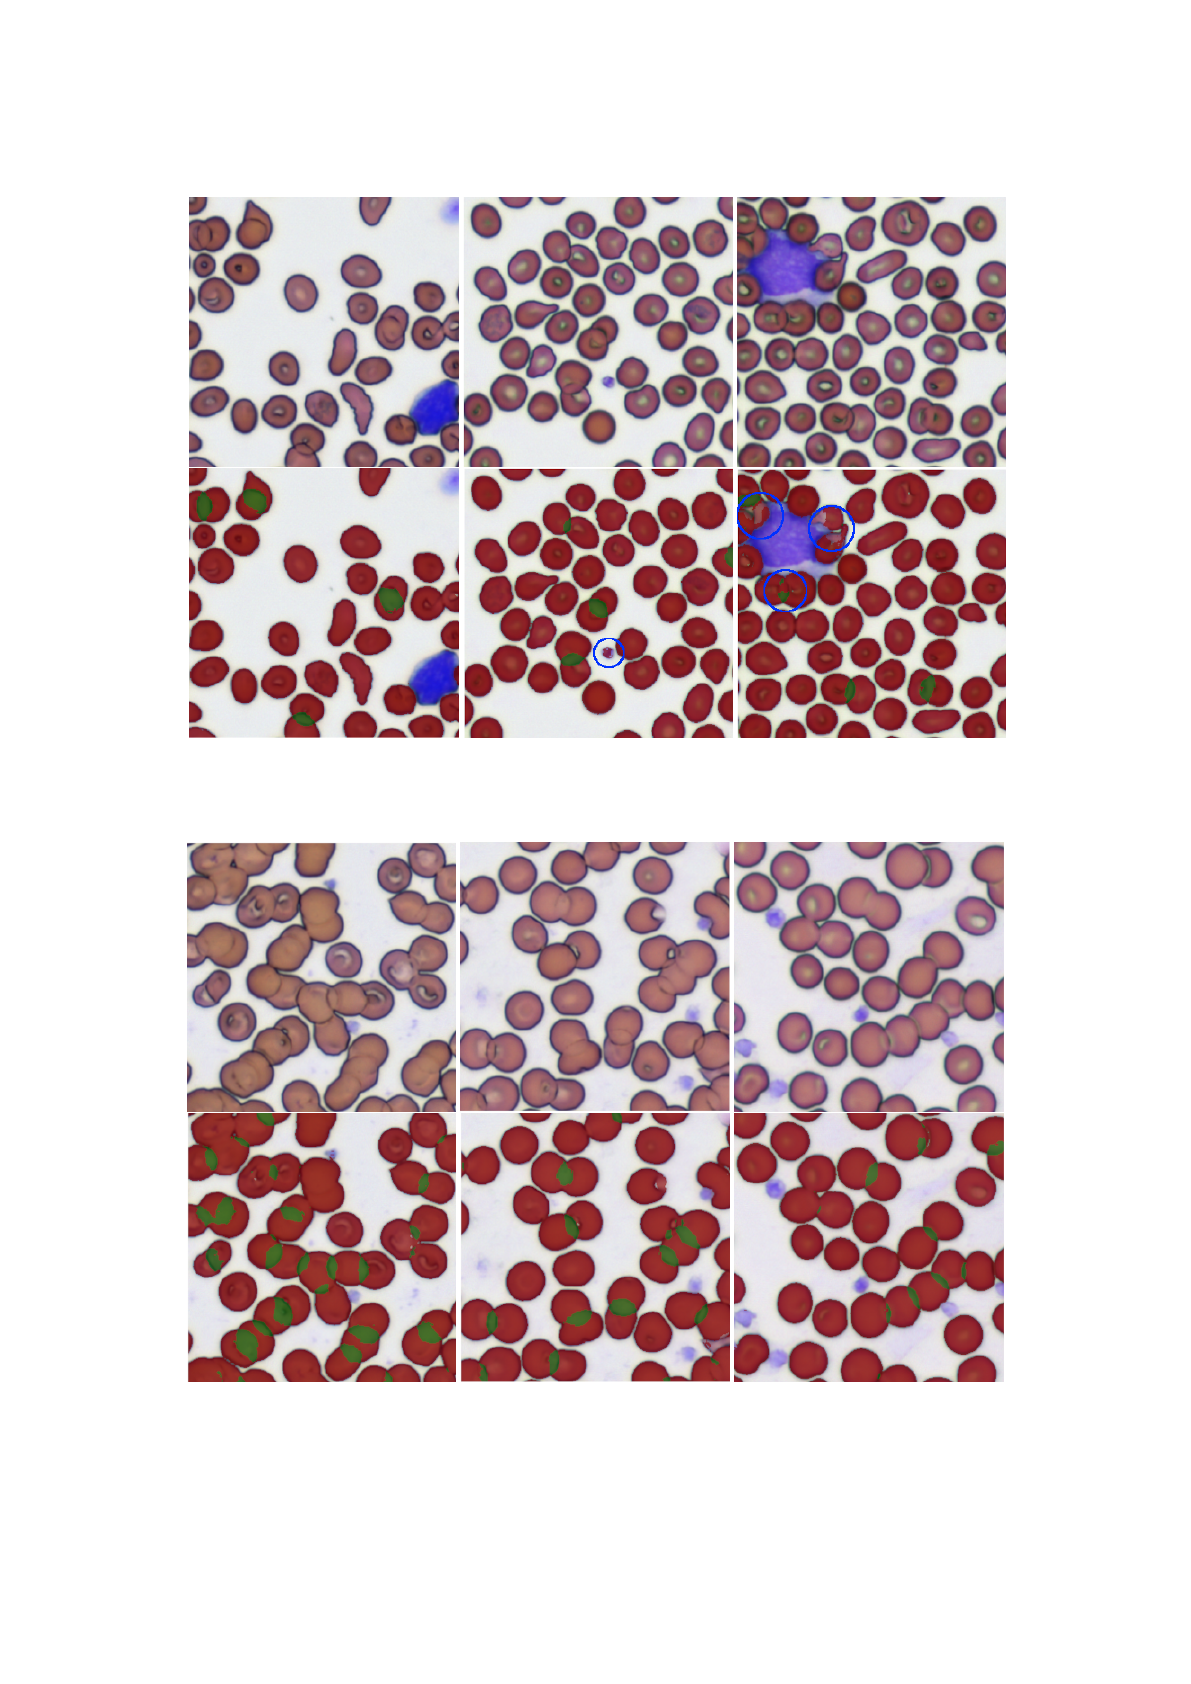
(a) (b) (c)
Figure 5: Segmentation results for a normal slide. The original image is shown above, below the same image is shown with
the predicted mask overlaid. Segmentation mistakes are highlighted in blue.
(a) (b) (c)
Figure 6: Segmentation results for a slide with rouleaux.

5 CONCLUSION
In this paper we show that the learning process can
be bootstrapped with the automatic creation of masks.
The path to improve the results is straightforward:
The initial masks need to be reviewed and improved
further (see section 2.1). More data needs to be added
where the model fails. For example to teach the model
to correctly segment RBCs that stick to white blood
cells, more such images and segmentation masks are
needed. The masks can be created by letting the al-
ready existing model predict most of the mask, mak-
ing manual adjustments only necessary where the
model fails to segment the cells correctly. To further
improve model training one could also adopt more re-
cent approaches to data augmentation such as Ran-
dAugment (Cubuk et al., 2019).
In the age of deep learning it is often forgotten
that image processing tasks, such as biomedical im-
age segmentation, can be solved to a large degree with
a simple algorithm that does not require a parameter-
ized model and a large training set. In our case we
could solve the biggest part of the problem (segment-
ing free-standing RBCs) with just a few lines of code
and use the resulting masks to generate enough train-
ing data to train a modern segmentation model.
ACKNOWLEDGEMENTS
We thank Anton Hasenkampf for carefully reviewing
our draft.
REFERENCES
Aitken, A., Ledig, C., Theis, L., Caballero, J., Wang, Z., and
Shi, W. (2017). Checkerboard artifact free sub-pixel
convolution. page 16.
Bain, J., B. (2014). Blood Cells: A Practical Guide. 5
edition.
Bruegel, M., George, T. I., Feng, B., Allen, T. R., Bracco,
D., Zahniser, D. J., and Russcher, H. (2018). Multi-
center evaluation of the cobas m 511 integrated hema-
tology analyzer. Int J Lab Hem, 40(6):672–682.
Cubuk, E. D., Zoph, B., Shlens, J., and Le, Q. V. (2019).
RandAugment: Practical automated data augmenta-
tion with a reduced search space. arXiv:1909.13719
[cs]. arXiv: 1909.13719.
Dai, J., Qi, H., Xiong, Y., Li, Y., Zhang, G., Hu, H., and
Wei, Y. (2017). Deformable Convolutional Networks.
Number: arXiv:1703.06211 arXiv:1703.06211 [cs].
Fastai Team (2020a). aug transforms. https://docs.fast.
ai/vision.augment.html#aug transforms. Last checked
on June 6, 2022.
Fastai Team (2020b). unet learner. https://docs.fast.
ai/vision.learner.html#unet learner. Last checked on
June 6, 2022.
Howard, J. and Gugger, S. (2020). fastai: A Layered API
for Deep Learning. Information, 11(2):108. arXiv:
2002.04688.
Kassim, Y. M., Palaniappan, K., Yang, F., Poostchi, M.,
Palaniappan, N., Maude, R. J., Antani, S., and Jaeger,
S. (2021). Clustering-Based Dual Deep Learning Ar-
chitecture for Detecting Red Blood Cells in Malaria
Diagnostic Smears. IEEE J. Biomed. Health Inform.,
25(5):1735–1746.
Kimball, S. and Mattis, P. (2018). Gimp (GNU Image Ma-
nipulation Program).
Moallem, G., Sari-Sarraf, H., Poostchi, M., Maude, R. J.,
Silamut, K., Antani, S., Thoma, G., Jaeger, S., and
Amir Hossain, M. (2018). Detecting and segment-
ing overlapping red blood cells in microscopic im-
ages of thin blood smears. In Gurcan, M. N. and
Tomaszewski, J. E., editors, Medical Imaging 2018:
Digital Pathology, page 50, Houston, United States.
SPIE.
Naruenatthanaset, K., Chalidabhongse, T. H., Palasuwan,
D., Anantrasirichai, N., and Palasuwan, A. (2021).
Red Blood Cell Segmentation with Overlapping Cell
Separation and Classification on Imbalanced Dataset.
arXiv:2012.01321 [cs, eess].
OpenCV Team (2020). cv::Laplacian. https://docs.
opencv.org/4.6.0/d4/d86/group imgproc filter.
html#gad78703e4c8fe703d479c1860d76429e6. Last
checked on June 14, 2022.
Paszke, A., Gross, S., Massa, F., Lerer, A., Bradbury, J.,
Chanan, G., Killeen, T., Lin, Z., Gimelshein, N.,
Antiga, L., Desmaison, A., K
¨
opf, A., Yang, E., De-
Vito, Z., Raison, M., Tejani, A., Chilamkurthy, S.,
Steiner, B., Fang, L., Bai, J., and Chintala, S. (2019).
PyTorch: An Imperative Style, High-Performance
Deep Learning Library. arXiv:1912.01703 [cs, stat].
arXiv: 1912.01703.
PyTorch Team (2020). torch.nn.CrossEntropyLoss.
https://pytorch.org/docs/stable/generated/torch.nn.
CrossEntropyLoss.html. Last checked on June 6,
2022.
Ronneberger, O., Fischer, P., and Brox, T. (2015). U-Net:
Convolutional Networks for Biomedical Image Seg-
mentation. arXiv:1505.04597 [cs].
Zhang, M., Li, X., Xu, M., and Li, Q. (2020). Auto-
mated Semantic Segmentation of Red Blood Cells for
Sickle Cell Disease. IEEE J. Biomed. Health Inform.,
24(11):3095–3102.
