
How Much Data is Enough? Benchmarking Transfer Learning for Few
Shot ECG Image Classification
Sathvik Bhaskarpandit
a
Department of Computer Science and Information Systems, BITS Pilani Hyderabad Campus, Hyderabad, India
Keywords:
ECG, Image Classification, Few Shot Learning, Transfer learning.
Abstract:
Over the past couple of decades, numerous research works have been conducted to study and detect abnor-
malities from ECG signals. In this direction, several deep learning models have been proposed to detect these
abnormalities and aid healthcare experts in their diagnoses. Although many of these deep learning approaches
utilize ECG signals as input, only a handful use images of patients’ ECGs themselves, that are often stored in
hospitals and diagnostic centres. This work aims to study ECG images under the few-shot learning scenario.
More specifically, it aims to study the effectiveness of transfer learning for few-shot ECG image classification,
and how classification performance varies with the amount of training data available. Results show that mod-
els such as ResNet and EfficientNet are able to classify images with great success with around 20 images per
class, with accuracy even crossing 99.5%. Yet under extreme data unavailability cases, such as 5-shot learning
and lower, transfer learning proves to be unreliable to be put to use in healthcare for automated classification
of ECG images.
1 INTRODUCTION
An electrocardiogram (ECG) is an electrical record-
ing of the heart representing the cardiac cycle, on a
graph representing the electrical activity of the heart
obtained by connecting electrodes adapted to the body
surface. It is a widely used noninvasive medical test
used for measuring the heart condition by tracking
the heart’s electrical activity. It plays a huge role in
the field of medicine and healthcare, ranging from
detection of cardiac diseases to vascular diseases to
COVID-19. ECG contains plenty of information that
directly reflects cardiac physiology since its morpho-
logical and temporal features are produced from car-
diac electrical and structural variations. The waves
produced by ECG signals are characterized by their
shapes and durations. When certain changes affect
certain characteristics of these waves, a heart defect
is considered to be present.
While an experienced cardiologist can distinguish
different types of cardiology abnormalities by visu-
ally referencing the ECG waveform pattern, a ma-
chine learning (ML) approach can improve the diag-
nostic efficiency. Therefore, detection and treatment
of anomalies have become the main research topics
a
https://orcid.org/0000-0001-6201-4975
in the field of cardiac care and the information pro-
cessing domain. Numerous methods have been pro-
posed to classify, as well as automatically detect var-
ious types of abnormalities from ECG signals. Early
methods include use of recursive filters (Zeraatkar
et al., 2011) and wavelet transforms (Addison, 2005)
to detect arrhythmia. Then, various feature extraction
techniques such as peak detection (Khazaee, 2013),
QRS complex detection (Li et al., 2016), RR interval
analysis (Tsipouras et al., 2005), Empirical Mode De-
composition (Izci et al., 2018), etc. were employed to
aid in classification. Machine learning models such
as support vector machine (Asl et al., 2008), logistic
regression (Behadada et al., 2016), etc. were used to
classify these signals from the hand-crafted features.
However, with the advent of deep learning (DL), DL
models began to predominate as they could automat-
ically extract complex features. Popular DL mod-
els include the use of multi layer perceptrons (MLP)
(Savalia and Emamian, 2018), convolutional neural
networks (CNN) (Wu et al., 2021), long-short term
memory (LSTM) (Gao et al., 2019) and deep belief
networks (DBN) (Gourisaria et al., 2021) .
While ECG signals themselves are an invaluable
source of data, a considerable amount of ECG data is
stored in hospitals in the form of images. Extracting
patterns and classifying these images proves to be a
Bhaskarpandit, S.
How Much Data is Enough? Benchmarking Transfer Learning for Few Shot ECG Image Classification.
DOI: 10.5220/0011531700003523
In Proceedings of the 1st Workshop on Scarce Data in Artificial Intelligence for Healthcare (SDAIH 2022), pages 35-40
ISBN: 978-989-758-629-3
Copyright
c
2023 by SCITEPRESS – Science and Technology Publications, Lda. Under CC license (CC BY-NC-ND 4.0)
35

difficult task. Several studies have been carried out
on classification from signals, whereas far, far fewer
studies have been carried out for classification from
images. These methods that classify ECG images uti-
lize DL approaches to extract complex features from
the images and subsequently perform classification
(Mohamed et al., 2015; Jun et al., 2018).
However, DL models suffer from a fundamental
drawback: They require a large number of training
examples to achieve satisfactory performance. While
humans are able to identify objects by simply looking
at a couple of such instances, DL models are unable
to do the same. Further, such a large number of im-
ages in places such as hospitals may not be labelled
initially. A doctor or subject matter expert (SME) is
required to label the data (Gupta et al., 2021). Man-
ual labelling may lead to inexact and noisy labels.
The cost and time required for labelling such a large
number of training examples is high and not scalable.
Therefore, there is a need for models that can perform
classification with high accuracy, but with a limited
number of labelled training images. This is where
few-shot learning (FSL) comes into the picture.
FSL aims to classify a set of testing examples,
known as the query set, given a limited number of
training examples, known as the support set. Trans-
fer learning (TL) is a popular approach for FSL. It
involves pre-training a model on a large dataset, fine-
tuning the model on the support set, then finally test-
ing its performance on the query set (Weimann and
Conrad, 2021; Venton et al., 2020; Salem et al., 2018).
This work aims to conduct experiments to study
the effectiveness of transfer learning in few-shot ECG
image classification (FSEIC). In particular, several
popular pretrained image classification architectures
are used and fine-tuned on the ECG images. The ef-
fect of amount of data available during training on the
classification performance is observed. An estimate
of the minimum number of labelled images required
to achieve a high accuracy is calculated.
2 EXPERIMENTAL SETUP
2.1 Dataset and Data Preprocessing
The data used for fine-tuning is taken from the ECG
Images dataset of Cardiac and COVID-19 Patients
(Khan et al., 2021). It consists of ECG images col-
lected from different health care institutes across Pak-
istan. The ECG signals in the images themselves are
sampled at 500 Hz. All the collected data was manu-
ally reviewed and labelled by Senior Medical Profes-
sionals. Each of the images belongs to one of three
classes: normal patient, patient with abnormal heart-
beat, or patient with myocardial infarction, with each
class having approximately 250 images.
Each image contains metadata such as patient
name, ID, height, weight, time of recording, etc. Such
details are cropped out of the images to retain only a
grid with the snapshots of the ECG signal recordings.
The images are then resized to a size of (128, 128,
3) using image anti-aliasing. Finally, depending on
the pretrained model used, additional preprocessing
is done to make the images ready to be inputted into
the model.
2.2 Sampling of Tasks
After the images have been preprocessed, FSL tasks
are sampled from the images. Each task consists of
randomly sampling k images per class as the support
set, fine-tuning the model on this support set, then
testing the model on another set of randomly sampled
images, i.e. q images per class, known as the query
set. The support set and query set are mutually dis-
joint.
2.3 Model Fine-tuning
Each base model is initialized with the weights of
a popular image-classification model pretrained on
the ImageNet dataset (Deng et al., 2009). In partic-
ular, the base models used are convolutional neural
networks that include VGG16 (Simonyan and Zis-
serman, 2014), DenseNet121 (Huang et al., 2017),
InceptionV3 (Szegedy et al., 2015), ResNet101 (He
et al., 2015), and EfficientNet models B0 to B7 (Tan
and Le, 2019). Any fully connected layers connected
to the top of the base model are removed. The weights
of the layers of the base model are frozen. Therefore,
the base model acts as a feature extractor for the im-
ages.
On top of this base model, a global average pool-
ing (GAP) layer is added, followed by batch normal-
ization and dropout. The output of the GAP layer is
subsequently fed into a softmax layer to output the
class probabilities. The trainable parameters there-
fore include those of the batch normalization layer
and weights of the final softmax layer. Categorical
crossentropy is taken as the loss function to be mini-
mized while fine-tuning the model on the support set.
The Adam optimizer (Kingma and Ba, 2014) with an
initial learning rate of 10
−2
and batch size of 16 is
used to arrive at the optimal weights. Early stopping
is used as the criterion for stopping training. The fine-
tuned model is finally used to obtain class predictions
for the query set. Metrics such as accuracy and F1
SDAIH 2022 - Scarce Data in Artificial Intelligence for Healthcare
36

Table 1: Accuracy and F1 Scores of the various transfer learning models with different pretrained base models. Values are
in percentage. Underlined values represent the model with the best accuracy or F1 score for the given value of k. The table
headings B0 to B7 represent EfficientNet model variants.
k Metric VGG16 DenseNet InceptionV3 ResNet B0 B1 B2 B3 B4 B5 B6 B7
1
Accuracy 39.67 41.33 47.33 50.07 64.80 58.60 59.10 52.13 40.07 51.87 41.73 45.73
F1 29.01 35.53 32.95 46.92 61.01 53.39 53.74 42.92 30.48 47.07 32.78 41.69
2
Accuracy 65.03 61.33 47.09 60.33 79.93 79.47 80.63 57.33 57.87 65.21 44.53 41.40
F1 63.96 61.24 36.52 58.89 79.40 79.11 79.97 49.85 51.59 64.29 34.38 40.24
3
Accuracy 55.67 61.03 53.67 72.93 92.82 87.43 86.21 73.07 73.47 68.80 51.33 60.73
F1 51.67 56.08 51.41 72.71 92.79 87.4 86.04 70.66 72.17 67.82 45.21 62.88
4
Accuracy 53.01 77.33 56.50 83.4 93.98 92.80 93.10 83.07 82.85 78.67 75.73 78.25
F1 46.27 75.86 51.16 83.2 93.97 92.78 93.05 82.83 82.21 78.45 75.55 80.32
5
Accuracy 71.33 86.33 64.33 86.00 96.07 92.67 94.73 84.67 84.80 83.00 78.40 82.40
F1 70.65 86.33 57.09 85.94 96.06 92.65 94.71 84.53 84.88 82.99 78.14 84.30
10
Accuracy 67.33 87.83 81.00 90.73 97.15 97.00 95.60 92.07 90.80 91.53 88.80 90.13
F1 63.82 87.75 80.88 90.74 97.16 96.98 95.58 92.03 90.78 91.59 88.81 90.36
20
Accuracy 85.33 92.67 88.33 95.53 98.40 98.63 99.20 96.93 96.00 96.27 94.87 95.41
F1 85.38 92.68 88.11 95.54 98.39 98.63 99.22 96.91 95.98 96.24 94.85 95.45
30
Accuracy 86.33 94.33 89.67 97.67 99.03 99.01 99.37 98.93 96.87 97.87 95.62 96.86
F1 86.29 94.33 89.65 97.65 99.01 99.02 99.35 98.93 96.85 97.86 95.59 96.90
40
Accuracy 86.67 96.07 93.17 98.93 99.08 99.43 99.57 98.80 98.33 98.13 96.73 97.66
F1 86.55 95.99 93.16 98.91 99.10 99.37 99.57 98.74 98.33 98.19 96.72 97.69
50
Accuracy 88.67 97.33 93.33 99.61 99.28 99.57 99.67 99.61 98.13 98.73 96.87 98.53
F1 88.53 97.32 93.26 99.60 99.28 99.53 99.66 99.60 98.12 98.71 96.86 98.59
score are recorded for each task. Since we use an
equal number of samples per class for the query set,
the results are primarily discussed in terms of accu-
racy in section 3.
For each TL model, k is varied from 1 to 50 to
observe the effect of amount of training data on the
classification performance. The value of q is fixed
at 100. For each value of k, 20 tasks are sampled,
each time with a different random seed, and the final
metrics reported are taken as the average of these 20
tasks. For fairness of comparison, the sampled tasks
for a given value of k are the same across all the TL
models.
3 RESULTS AND DISCUSSION
In this section, the results and plausible explanations
for the recorded observations are presented. Table 1
shows the results of the various TL models for differ-
ent values of k.
From the table we notice a couple of interesting
observations. On first glance the models seem to work
quite well on the dataset. For k = 1, the accuracies
and F1 scores of the models are quite low, with all be-
ing less than 65%. There is a relatively large increase
in accuracy from k = 1 to k = 2, with a smaller in-
crease from k = 2 to k = 3. From k = 1 till k = 5,
with the exception of k = 2, EfficientNetB0 is the
best performing model. For larger values of k, Effi-
cientNetB2 seems to be the best performing model.
If we take into the consideration the largest value of
k = 50, only ResNet and EfficientNet models B0 to
B3 cross 99%. VGG16 and InceptionV3 models per-
form poorly, while DenseNet and EfficientNet models
B4 to B7 show promising performance, at around 97-
99%.
To have a deeper look at the effect of the amount
of data during training, the accuracies of each model
are plotted versus k. Figures 1 and 2 show the plots for
k = 1 till k = 19, and k = 20 till k = 50, respectively.
We observe that there is a sharper increase in accu-
racy in the beginning for smaller values of k, which
becomes more gradual for later values of k. The in-
crease in accuracy is not monotonic but irregular, pri-
marily due to the scarcity of data and minorly due
to the stochastic nature of optimization of neural net-
works. For almost all values of k, EfficientNet models
B0-B2 show the best performance. We conclude that
these models have the best ability to extract useful
features from the images and classify them into one
of the class labels. Until k = 8, the B0 model seems
to perform better while the B2 model seems to be
the best performing model for most values of k later.
This is possibly due to the fact that more complex and
deeper models initially overfit for smaller values of
k as there is lesser amount of training data and they
tend to result in high-dimensional features from the
GAP layer. As the amount of training data grows,
more complex models learn better features than sim-
pler ones and these high-dimensional features are use-
ful in differentiating between the classes. However,
EfficientNet models B5-B7 are still too complex for
the amount of data being experimented with. In this
regard, it is observed that ResNet performs poorly for
How Much Data is Enough? Benchmarking Transfer Learning for Few Shot ECG Image Classification
37
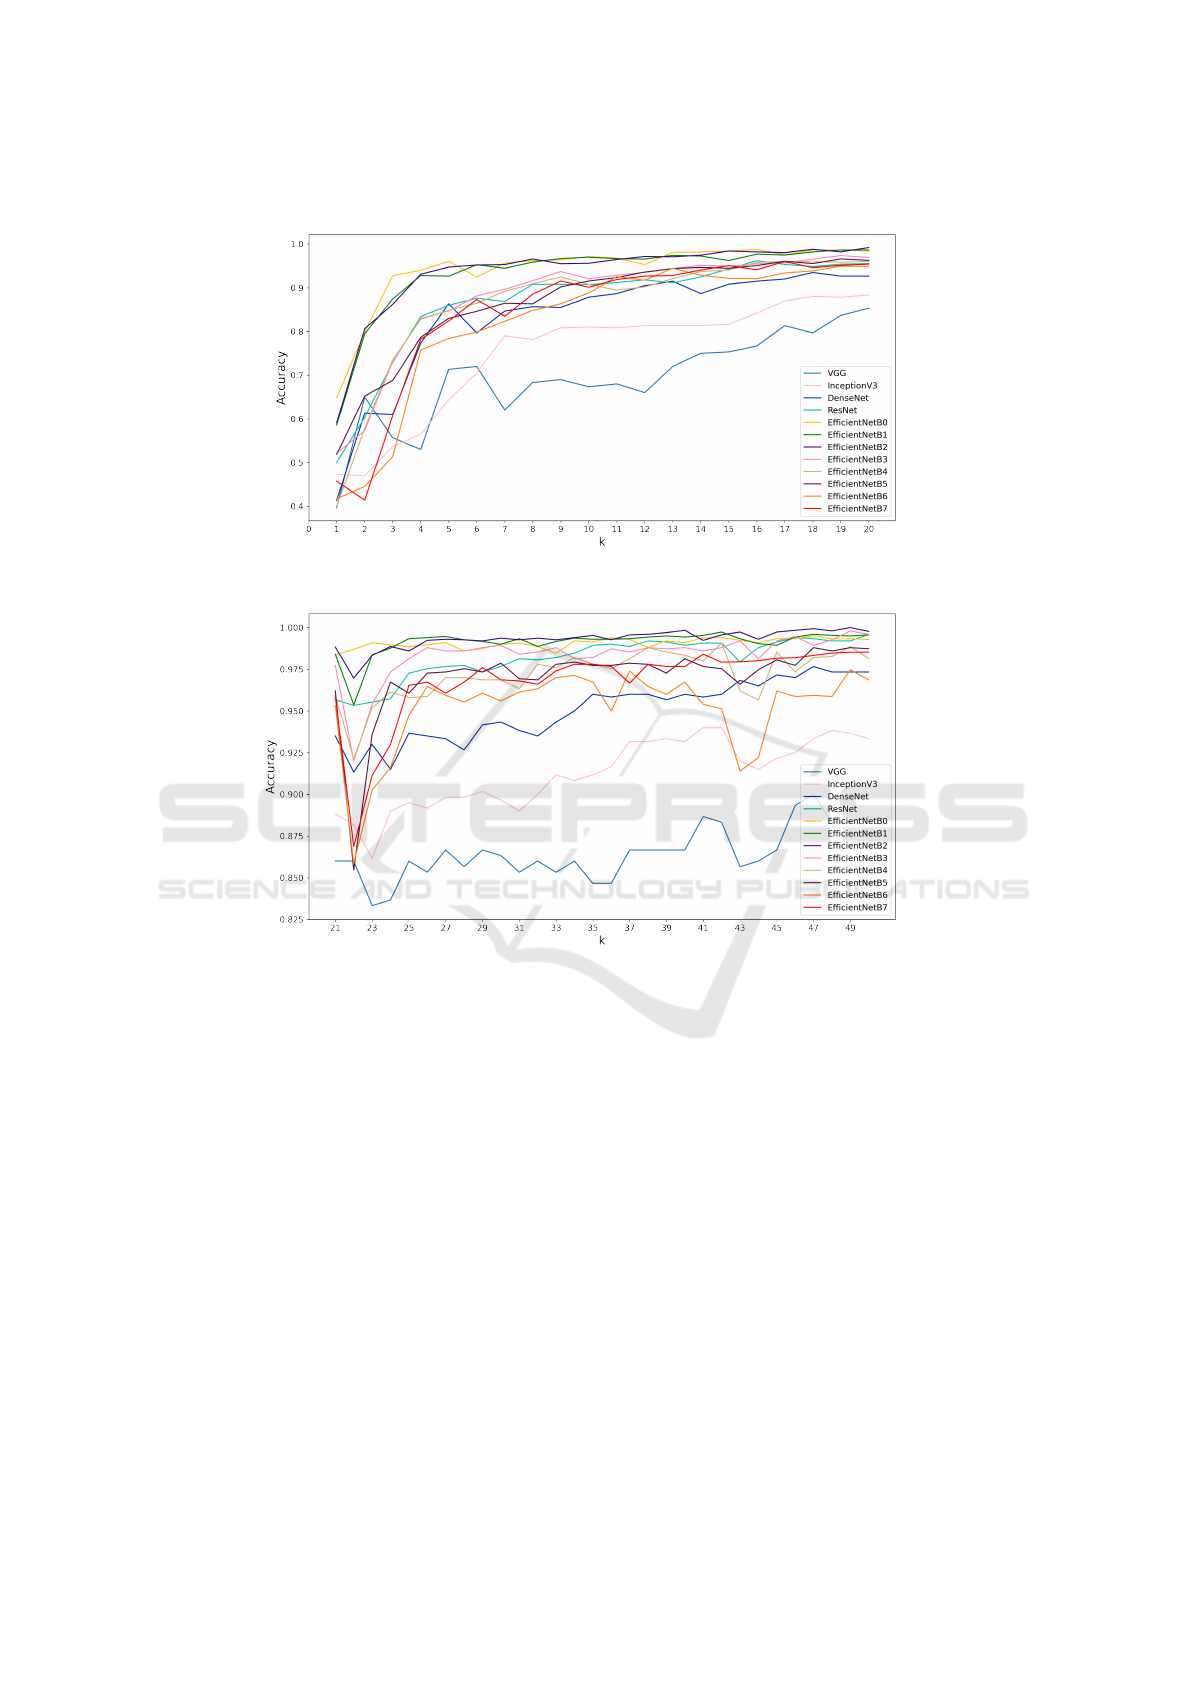
Figure 1: Plot of accuracy as a function of k for k=1 to k=20.
Figure 2: Plot of accuracy as a function of k for k=21 to k=50.
smaller values of k but extremely well for larger val-
ues.
We also seek to answer the question: How much
data is required to obtain a certain threshold accuracy
δ that we consider is useful in a real world scenario,
such as medical diagnoses in hospitals, and is it a rea-
sonable value? Medical diagnoses carry a high degree
of responsibility and medical research strives to make
such diagnoses impeccable. Thus a high value of δ
is obviously preferred. Several research works that
have been conducted to classify ECG signals achieve
classification accuracies of around 99.5% (Ji et al.,
2019; Shoughi and Dowlatshahi, 2021) on the MIT-
BIH database (Moody and Mark, 1992). We observe
that for δ = 99%, k
min
= 24 using EfficientNetB2,
Similarly, for δ = 99.5%, k
min
= 40 using Efficient-
NetB2. Obtaining approximately 40 images per class
for training a model is certainly possible, but would
take a reasonable amount of time. Additionally, it
is relatively easier to obtain ECG images of normal
patients than patients with myocardial infarction. In
case the disease being observed is rarer, it may be
even more difficult to collect such images. Consider-
ing that almost all models perform poorly given only
a couple of training samples per class, it may not be
a wise idea to rely on deep learning to automatically
classify a patient’s condition in such a scenario.
4 CONCLUSION AND FUTURE
WORK
This work has shown that transfer learning using pop-
ular image classification architectures is a promis-
ing direction for few-shot ECG image classification.
With around 20 images per class available for train-
ing, models such as ResNet and EfficientNet are able
SDAIH 2022 - Scarce Data in Artificial Intelligence for Healthcare
38

to achieve accuracies of at least 99%.
However, when the training set comprises 5 im-
ages per class or fewer, simple transfer learning fails
to classify ECG images with high accuracy. In this
direction, other algorithms that work well in low-
shot and class imbalance scenarios, can be explored.
Other few-shot learning methods can be compared
with transfer learning and observed to see how well
they perform with the amount of labelled data avail-
able. It is also worth experimenting with data from
different ethnicities and regions as the current work
deals with data taken from one region only.
REFERENCES
Addison, P. S. (2005). Wavelet transforms and the ecg: a
review. Physiological measurement, 26(5):R155.
Asl, B. M., Setarehdan, S. K., and Mohebbi, M. (2008).
Support vector machine-based arrhythmia classifica-
tion using reduced features of heart rate variability sig-
nal. Artificial intelligence in medicine, 44(1):51–64.
Behadada, O., Trovati, M., Chikh, M. A., Bessis, N., and
Korkontzelos, Y. (2016). Logistic regression multino-
mial for arrhythmia detection. In 2016 IEEE 1st Inter-
national Workshops on Foundations and Applications
of Self* Systems (FAS* W), pages 133–137. IEEE.
Deng, J., Dong, W., Socher, R., Li, L.-J., Li, K., and Fei-
Fei, L. (2009). Imagenet: A large-scale hierarchical
image database. In 2009 IEEE conference on com-
puter vision and pattern recognition, pages 248–255.
Ieee.
Gao, J., Zhang, H., Lu, P., and Wang, Z. (2019). An ef-
fective lstm recurrent network to detect arrhythmia on
imbalanced ecg dataset. Journal of healthcare engi-
neering, 2019.
Gourisaria, M. K., Harshvardhan, G., Agrawal, R., Patra,
S. S., Rautaray, S. S., and Pandey, M. (2021). Arrhyth-
mia detection using deep belief network extracted
features from ecg signals. International Journal of
E-Health and Medical Communications (IJEHMC),
12(6):1–24.
Gupta, P., Bhaskarpandit, S., and Gupta, M. (2021). Sim-
ilarity learning based few shot learning for ecg time
series classification. In 2021 Digital Image Comput-
ing: Techniques and Applications (DICTA), pages 1–
8. IEEE.
He, K., Zhang, X., Ren, S., and Sun, J. (2015). Deep resid-
ual learning for image recognition. arxiv 2015. arXiv
preprint arXiv:1512.03385.
Huang, G., Liu, Z., Van Der Maaten, L., and Weinberger,
K. Q. (2017). Densely connected convolutional net-
works. In Proceedings of the IEEE conference on
computer vision and pattern recognition, pages 4700–
4708.
Izci, E., Ozdemir, M. A., Sadighzadeh, R., and Akan, A.
(2018). Arrhythmia detection on ecg signals by us-
ing empirical mode decomposition. In 2018 Medical
Technologies National Congress (TIPTEKNO), pages
1–4. IEEE.
Ji, Y., Zhang, S., and Xiao, W. (2019). Electrocardiogram
classification based on faster regions with convolu-
tional neural network. Sensors, 19(11):2558.
Jun, T. J., Nguyen, H. M., Kang, D., Kim, D., Kim, D., and
Kim, Y.-H. (2018). Ecg arrhythmia classification us-
ing a 2-d convolutional neural network. arXiv preprint
arXiv:1804.06812.
Khan, A. H., Hussain, M., and Malik, M. K. (2021). Ecg
images dataset of cardiac and covid-19 patients. Data
in Brief, 34:106762.
Khazaee, A. (2013). Heart beat classification using particle
swarm optimization. International Journal of Intelli-
gent Systems and Applications, 5(6):25.
Kingma, D. P. and Ba, J. (2014). Adam: A
method for stochastic optimization. arXiv preprint
arXiv:1412.6980.
Li, P., Wang, Y., He, J., Wang, L., Tian, Y., Zhou, T.-s., Li,
T., and Li, J.-s. (2016). High-performance personal-
ized heartbeat classification model for long-term ecg
signal. IEEE Transactions on Biomedical Engineer-
ing, 64(1):78–86.
Mohamed, B., Issam, A., Mohamed, A., and Abdellatif, B.
(2015). Ecg image classification in real time based on
the haar-like features and artificial neural networks.
Procedia Computer Science, 73:32–39.
Moody, G. B. and Mark, R. G. (1992). Mit-bih arrhythmia
database.
Salem, M., Taheri, S., and Yuan, J.-S. (2018). Ecg ar-
rhythmia classification using transfer learning from 2-
dimensional deep cnn features. In 2018 IEEE biomed-
ical circuits and systems conference (BioCAS), pages
1–4. IEEE.
Savalia, S. and Emamian, V. (2018). Cardiac arrhythmia
classification by multi-layer perceptron and convolu-
tion neural networks. Bioengineering, 5(2):35.
Shoughi, A. and Dowlatshahi, M. B. (2021). A practi-
cal system based on cnn-blstm network for accurate
classification of ecg heartbeats of mit-bih imbalanced
dataset. In 2021 26th International Computer Confer-
ence, Computer Society of Iran (CSICC), pages 1–6.
IEEE.
Simonyan, K. and Zisserman, A. (2014). Very deep con-
volutional networks for large-scale image recognition.
arXiv preprint arXiv:1409.1556.
Szegedy, C., Vanhoucke, V., Ioffe, S., Shlens, J., and
Wojna, Z. (2015). Rethinking the inception archi-
tecture for computer vision. 2015. arXiv preprint
arXiv:1512.00567.
Tan, M. and Le, Q. (2019). Efficientnet: Rethinking model
scaling for convolutional neural networks. In Interna-
tional conference on machine learning, pages 6105–
6114. PMLR.
Tsipouras, M. G., Fotiadis, D. I., and Sideris, D. (2005).
An arrhythmia classification system based on the rr-
interval signal. Artificial intelligence in medicine,
33(3):237–250.
Venton, J., Aston, P. J., Smith, N. A., and Harris, P. M.
(2020). Signal to image to classification: Transfer
How Much Data is Enough? Benchmarking Transfer Learning for Few Shot ECG Image Classification
39

learning for ecg. In 2020 11th Conference of the Eu-
ropean Study Group on Cardiovascular Oscillations
(ESGCO), pages 1–2. IEEE.
Weimann, K. and Conrad, T. O. (2021). Transfer learning
for ecg classification. Scientific reports, 11(1):1–12.
Wu, M., Lu, Y., Yang, W., and Wong, S. Y. (2021). A study
on arrhythmia via ecg signal classification using the
convolutional neural network. Frontiers in computa-
tional neuroscience, page 106.
Zeraatkar, E., Kermani, S., Mehridehnavi, A., Aminzadeh,
A., Zeraatkar, E., and Sanei, H. (2011). Arrhythmia
detection based on morphological and time-frequency
features of t-wave in electrocardiogram. Journal of
Medical Signals and Sensors, 1(2):99.
SDAIH 2022 - Scarce Data in Artificial Intelligence for Healthcare
40
