
Evaluation of the Synthetic Electronic Health Records
Emily Muller
1
, Xu Zheng
2
and Jer Hayes
2
1
Department of Epidemiology and Biostatistics, Imperial College London, U.K.
2
Accenture Labs, Dublin, Ireland
Keywords:
Generative Model, Medical Data Synthesis, Synthetic Data Evaluation.
Abstract:
Generative models have been found effective for data synthesis due to their ability to capture complex under-
lying data distributions. The quality of generated data from these models is commonly evaluated by visual
inspection for image datasets or downstream analytical tasks for tabular datasets. These evaluation methods
neither measure the implicit data distribution nor consider the data privacy issues, and it remains an open ques-
tion of how to compare and rank different generative models. Medical data can be sensitive, so it is of great
importance to draw privacy concerns of patients while maintaining the data utility of the synthetic dataset. Be-
yond the utility evaluation, this work outlines two metrics called Similarity and Uniqueness for sample-wise
assessment of synthetic datasets. We demonstrate the proposed notions with several state-of-the-art generative
models to synthesise Cystic Fibrosis (CF) patients’ electronic health records (EHRs), observing that the pro-
posed metrics are suitable for synthetic data evaluation and generative model comparison.
1 INTRODUCTION
Data is constantly generated in the field of medicine
from sources such as biosensors, physiological mea-
surements, genome sequencing and electronic health
records (EHRs). Despite this, the data on specific sub-
populations may be pretty scarce when aggregating
data is expensive if the data is proprietary; or ren-
dered inaccessible due to interoperability standards in
the sharing of health data; or illegal to share it has
the potential to violate privacy. To overcome these
issues, synthetic data are increasingly being used in
the healthcare setting [Chen et al., 2021]. A de-
sirable data synthesis algorithm in the medical do-
main should be able to generate new samples that pre-
serve the original data distribution while adhering to
properties of privacy. Preserving the data distribution
maintains good utility of the synthetic data in down-
stream analytical tasks while maintaining the privacy
level ensures that the synthetic data do not leak infor-
mation of any single individual.
Deep generative models, such as generative ad-
versarial networks (GANs) and variational autoen-
coders (VAEs) [Xu and Veeramachaneni, 2018, Choi
et al., 2017, Xu et al., 2019, Xie et al., 2018, Yoon
et al., 2020], have been found effective for synthe-
sising medical datasets. These models implicitly pa-
rameterise the multivariate distribution of the origi-
nal data using deep neural networks. In [Fiore et al.,
2019] a GAN is used to synthesise the underrepre-
sented class of fraudulent credit card cases, observing
a maximum increase in classification sensitivity of 3.4
percentage points when augmenting the small class 3
times its size (0.55% of the training set). While a con-
ditional GAN can achieve optimal performance on a
set of 22 tabular datasets [Douzas and Bacao, 2018].
In an application of augmenting classes of thermal
comfort, the authors find two experiments where syn-
thetic data alone has a higher F1 score than the orig-
inal training data. Similar to [Fiore et al., 2019], the
author synthesises the under-represented class. Other
work has shown the efficacy of generative networks
above traditional methods, such as the Synthetic Mi-
nority Over-sampling Technique (SMOTE) and its
variants [Liu et al., 2019, Ngwenduna and Mbuvha,
2021, Engelmann and Lessmann, 2020].
Although the high capacity of generative models
makes them good candidates for capturing complex
non-linear distributions in the data, their intractable
likelihood functions make evaluation difficult. In
this work, we propose to use Similarity and Unique-
ness for sample-wise evaluation of Cystic Fibrosis
EHRs synthesising. We found increased predictive
performance during the experiments when augment-
ing given datasets with synthetic data, which is further
faithfully evaluated by the proposed metrics.
Muller, E., Zheng, X. and Hayes, J.
Evaluation of the Synthetic Electronic Health Records.
DOI: 10.5220/0011531300003523
In Proceedings of the 1st Workshop on Scarce Data in Artificial Intelligence for Healthcare (SDAIH 2022), pages 17-22
ISBN: 978-989-758-629-3
Copyright
c
2023 by SCITEPRESS – Science and Technology Publications, Lda. Under CC license (CC BY-NC-ND 4.0)
17

2 METHOD
We propose to compare generative models from mul-
tiple perspectives, including Uniqueness, Similarity
and Utility. In this section, we detail the feature ex-
traction procedure of the data, definitions of these
evaluation metrics and generative model selection.
2.1 Feature Extraction
Cystic Fibrosis (CF) is a rare disease that gives rise to
different forms of lung dysfunction, eventually lead-
ing to progressive respiratory failure. It is a complex
disease, and the types and severity of symptoms can
differ widely from person to person. In our work, we
extract CF patients from the IBM Explorys database
with a total of 10074 patients extracted, represent-
ing about 1/3 (31199) of all CF patients in the US
[USCFF, 2020]. Patients belong to two subgroups:
having died or having received a lung transplant, la-
beled by value 0; or having survived, labeled by value
1. We remove all samples with no diagnosis codes
and duplicates to enhance synthetic diversity. Our
final dataset has 3184 patients, with ∼ 80% belong-
ing to the survived subgroup. The EHRs of these pa-
tients are then aggregated over time. For each patient,
we assign value 1 to the features that have appeared
in the medical history, and value 0 to these features
that have never appeared. The medical data is finally
represented as a binary matrix where each row cor-
responds to a patient and each column to a medical
feature. The predictive survival outcome is based on
these medical features including comorbidity, lung in-
fection, and therapy variables.
2.2 Uniqueness
Privacy assurances are essential to prevent the leakage
of personal information. However, a synthetic data
generator can achieve perfect evaluation scores by
simply copying the original training data, thus break-
ing the privacy guarantee. Differential privacy (DP)
is one well-known and commonly researched assur-
ance [Dwork et al., 2014]. DP algorithms limit how
much; the output can differ based on whether the in-
put is included; one can learn about a person because
their data was included; and confidence about whether
someone’s data was included. In practice, there are
various distance-based metrics to guarantee such as-
surance. In [Alaa et al., 2021], the authors quantify a
generated sample as authentic if its closest real sam-
ple is at least closer to any other real sample than the
generated sample. Extending this to the case of bi-
nary variables, we could consider hamming distance.
However, since our data is de-personalised and non-
identifiable, we assess our generators based on how
many exact copies are made. We consider the require-
ment of privacy as Uniqueness: to not simply copy
the input data. We calculate the Uniqueness of each
model by generating a large finite number of samples
and reporting the percentage of overlap with the orig-
inal training data.
2.3 Similarity
It is hard to measure the Similarity between the syn-
thetic and original datasets with one score because of
the multiple features and data types within the data.
In our work, the Similarity is measured with four sub-
metrics, precision, recall, density and coverage.
In [Sajjadi et al., 2018] the use of precision and
recall metrics to measure the output from generative
models is proposed. Precision measures the fidelity -
the degree to which generated samples resemble the
original data. Furthermore, recall measures diversity
- whether generated samples cover the full variability
of the original data. The latter is particularly useful
for evaluating generative models prone to mode col-
lapse. Precision is defined as the proportion of the
synthetic probability distribution that can be gener-
ated from the original probability distribution, thus
measuring fidelity, and recall symmetrically defines
diversity. Precision and recall are effectively calcu-
lated as the proportion of samples that lie in support
of the comparative distribution, which assumes uni-
form density across the data. Therefore, alternative
metrics have been proposed, such as density and cov-
erage, to ameliorate this issue [Kynk
¨
a
¨
anniemi et al.,
2019, Naeem et al., 2020, Alaa et al., 2021]. We em-
ploy the definition and implementation of density and
coverage metrics from [Naeem et al., 2020] for a more
accurate Similarity evaluation. Density and coverage
address the lack of robustness to outliers, failure to de-
tect matching distributions and inability to diagnose
different types of distribution failure.
2.4 Utility
To empirically validate the Utility of the generated
dataset, we introduce two different training testing
settings. Setting A: train the predictive models on
the synthetic training set and test the performance of
the models on the testing set. Setting B: train on
the synthetically augmented balanced-class training
set as the original dataset is imbalanced, then test on
the testing set. We perform a 5-fold cross-validation,
sampling each fold with a proportional representation
of each class. After training the synthesisers (de-
SDAIH 2022 - Scarce Data in Artificial Intelligence for Healthcare
18

(a) Authenticity proportion (b) Similarity metrics (c) Synthetic data AUC-ROC
Figure 1: (A) Authenticity of 100k samples from each generator. Grey is the proportion of samples that appear in the original
training data. Light purple is samples that do not appear in the original training data, and darker purple represents those that
are unique. (B) Similarity metrics for each model. For each fold, a dataset matching the size of the original fold with the
equivalent proportion of classes is sampled from the unique synthetic dataset (dark blue only). This is repeated 10 times, and
similarity metrics show mean and standard deviation over folds and repetitions.
scribed below), we obtain unique synthetic datasets
for each fold and model. Setting A was implemented
as follows: for each fold, we sampled a synthetic
dataset the size of the original dataset with equiv-
alent class proportions to calculate Utility. We re-
peated this ten times resulting in 50 measurements for
each model for which we report the mean and stan-
dard deviation. For each synthetic dataset, we trained
the following classification models: Support Vector
Machine, Linear Regression, Naive Bayes, K-Nearest
Neighbours and a Random Forest. We chose the clas-
sifier which maximised the area under the receiver op-
erating curve (AUC-ROC) for the survived subgroup
with label 1 for the holdout test set and compared
this to the training with original data. As well as a
testing utility on the synthetic dataset alone, we also
augmented the original dataset to obtain class balance
(Setting B). We performed the same utility experi-
ment outlined above, reporting both areas under the
receiver operating curve (AUC-ROC) and accuracy
with a balanced class augmented training set.
2.5 Synthetic Data Generators
We implemented several SOTA generative models, in-
cluding variational autoencoders (VAE), Conditional
GAN (CTGAN) [Xu et al., 2019] and Differentially
Private GAN (DPGAN) [Xie et al., 2018] with two
privacy levels. DPGAN001 has sigma 0.01 and gra-
dient clip 0.1, while DPGAN050 has sigma 0.5 and
gradient clip 0.05. We mainly pick these two ex-
treme privacy settings for the DPGAN model to ex-
plore how noise levels impact synthetic datasets. For
these models, we attempted to preserve their original
architecture as published and adjusted the hyperpa-
rameters using grid search, with the optimisation ob-
jective to maximise the sum of Similarity metrics, in-
cluding precision, recall, density and coverage. VAE
is trained with two hidden layers in the encoder and
decoder and ELBO loss minimisation. DPGAN is
trained as a typical minimax game between the dis-
criminator and generator with noise injected into the
gradient during training with the cross-entropy de-
rived loss. CTGAN addresses sparsity and imbal-
anced categorical columns by sampling vectors dur-
ing training and introducing a condition for which the
generator learns the conditional distribution.
3 RESULTS
After hyperparameters tuning and model optimisation
for each of the 5 separate training folds, we gener-
ated 100K synthetic samples from each model. We
post-processed each synthetic dataset to obtain only
unique samples. For each fold, we sampled a syn-
thetic dataset the size of the original dataset with
equivalent class proportions to calculate Similarity.
We repeated this 10 times resulting in 50 measure-
ments for each metric and model for which we report
the mean and standard deviation in the plots.
3.1 Uniqueness
Figure 1a shows the average per fold proportion of du-
plicated data from the generation of 100, 000 samples.
Of 100, 000 generated samples, VAE has the highest
duplication rate of the original training data (67%),
followed by the CTGAN (34%), DPGAN001 (32%)
and DPGAN050 (18%), as shown in grey. Although
DPGAN050 has the lowest duplication rate of the
original training data, its novel synthesised samples
are largely duplicated (approx 71k duplicates shown
in light purple), compared to 26k, 55k and 31k for
VAE, DPGAN001 and CTGAN, respectively. CT-
GAN generates the largest number of unique samples
at an average of 33, 689, and VAE has the fewest with
6, 647 (dark purple). Both DPGAN models generate
Evaluation of the Synthetic Electronic Health Records
19
(a) AUC-ROC (b) Accuracy
(c) Precision (d) Recall
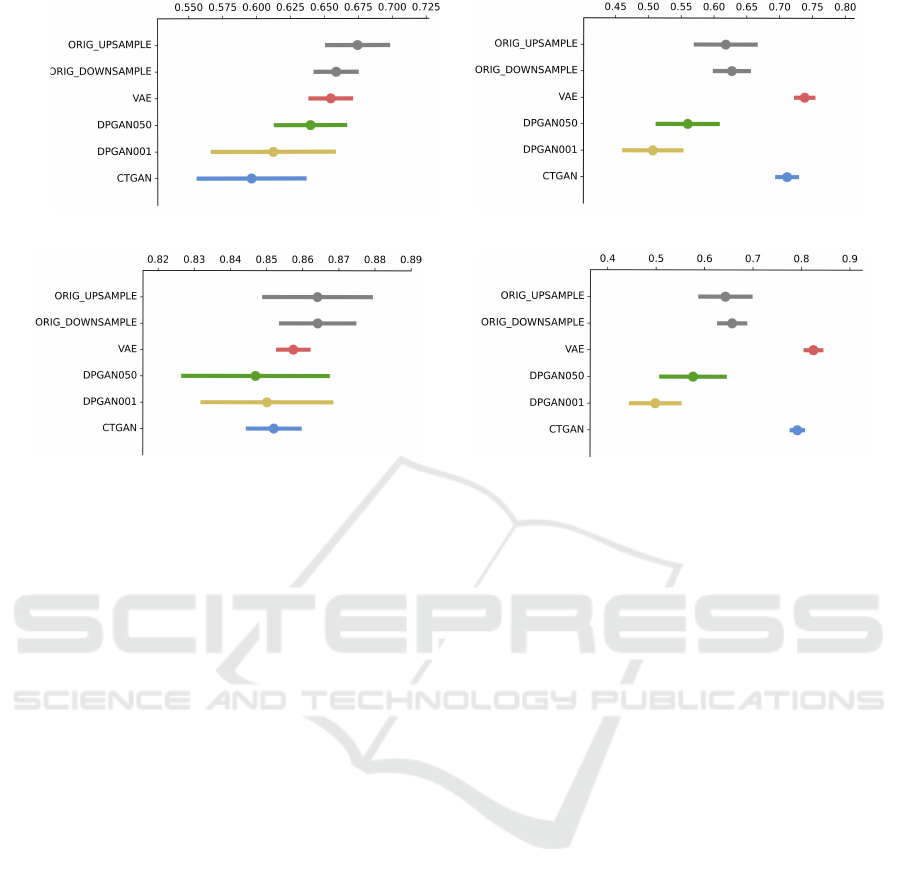
Figure 2: Performance of original data augmented with synthetic samples. For each fold, synthetic samples are randomly
drawn to augment the small class. Where there are not enough of the minor class, the large class is randomly downsampled
achieving class balance. Gaussian Naive Bayes, Random Forest, Neural Network, SVM and Logistic Regression classifiers are
each trained to predict the hold out test set outcome and results which maximise performance metrics are reported, averaged
over each fold and repeated 10 times. The average number of samples for each model and class is 2128, 419, 1029, 1908,
1974 and 2128 for Upsampling, Downsampling, VAE, DPGAN050, DPGAN001, CTGAN respectively.
a similar number of unique samples (12, 481 for DP-
GAN001 and 11, 288 for DPGAN050).
3.2 Similarity
Random subsets from each unique synthetic dataset
are sampled, and Similarity with the original data is
computed (1b). Batches are sampled to match the
size of the training data while preserving the outcome
class ratio. Synthesiser VAE has the highest precision
(0.95 ± 0.01) and density (0.63 ± 0.03). Given that
this model has the largest copying rate of the original
data, its unique data also lies closest to the original
data, preserving fidelity. Synthesiser CTGAN has the
lowest fidelity (both precision 0.37±0.04 and density
0.13 ± 0.02) with the original training data; however,
it attains the highest recall (0.67 ± 0.02). CTGAN
displays the largest degradation (0.31 ± 0.02) when
measuring diversity using coverage, placing last with
DPGAN050 (0.31 ± 0.02), which suggests that many
of the diverse samples generated by CTGAN are con-
sidered outliers (they do not match the density of the
original distribution). VAE also displays a marked re-
duction in diversity compared to both DPGAN mod-
els when measured with recall (0.58 ± 0.03) versus
coverage (0.43 ± 0.01). DPGAN001 scores consis-
tently higher than DPGAN050 across all Similarity
metrics (0.64 ± 0.09 vs 0.54 ± 0.05 for precision,
0.46 ± 0.12 vs 0.31 ± 0.02 for recall, 0.28 ± 0.05 vs
0.22± 0.02 for density and 0.44±0.10 vs 0.31± 0.12
for coverage).
3.3 Utility
None of the synthetic datasets reaches an AUC-ROC
that is higher than the original training data in the ex-
periments with Setting A. VAE has the highest AUC
of all synthetic datasets, which is in line with its rank-
ing as the highest across similarity metrics. Model
rank across the sum of Similarity metrics is VAE, DP-
GAN001, CTGAN and DPGAN050, which do not
follow AUC-ROC scores. Besides, we also compared
performance measures of a balanced dataset by both
upsampling and downsampling to a balanced dataset
augmented with synthetic samples (Setting B). The
ordering of AUC-ROC scores is preserved from the
synthetic data only classification task (Figure 2a ver-
sus Figure 1c) with a smaller difference from the orig-
inal baseline performance. In contrast, synthetically
augmented data from VAE and CTGAN outperform
the baseline models when measured using accuracy
(Figure 2b). This increased performance is largely
driven by recall (true positive rate) for the survived
subgroup (Figure 2d).
SDAIH 2022 - Scarce Data in Artificial Intelligence for Healthcare
20

(a) Oversampled (b) VAE (c) DPGAN050 (d) DPGAN001 (e) CTGAN
(f) Oversampled (g) VAE (h) DPGAN050 (i) DPGAN001 (j) CTGAN
Figure 3: The top row shows the heatmaps of binary matrices of sampled examples, where the columns represent different
features and rows represent different samples. Class 0 at the top half of the matrix represents examples sampled from the
dataset augmented with synthetic data, and Class 1 at the bottom half represents examples sampled from the original dataset.
The balanced datasets serve as input for the classification algorithms as per RESULTS section. The bottom row shows 2D
PCA embeddings of the same data.
4 DISCUSSION
The increased predictive performance with synthet-
ically augmented data from VAE and CTGAN is
driven by the recall, indicating that these models can
better identify the positive class with little degrada-
tion to the precision. CTGAN has the most signifi-
cant number of unique samples and has the most re-
markable diversity when measured using recall. This
diversity of CTGAN lends itself to extracting gen-
eralisable features which predict each class. While
VAE produces far fewer unique samples, it retains di-
versity in its samples. To better understand the na-
ture of the signal identified by these models, we have
plotted the heatmap of the binary feature matrix for
one fold (see Figure 3). In the top row of figures,
the lower half of the heatmap comes from the origi-
nal distribution (marked as class 1). In contrast, the
upper half is original data augmented with synthetic
data for class balance (marked as class 0). Here we
observe that synthesiser VAE has largely exaggerated
the signal for features in augmented data (class 0),
which has resulted in greater separability in the in-
put space, as shown by the two-dimension PCA re-
duction. Both DPGAN models display reduced sepa-
rability, with DPGAN001 reporting a lower accuracy.
The heatmaps go some way in explaining this since
there does not appear to be a marked difference in the
upper and lower halves of the DPGAN001 heatmap.
DPGAN050, however, does show some exaggerated
features for class 0. Visually, CTGAN appears to have
the most similar heatmap as the original data upsam-
pled while obtaining greater separability. This visual
heuristic of similarity appears to contrast the Similar-
ity metrics reported in the previous section. Since the
Similarity metrics measure both the positive and neg-
ative outcome class in proportions with which they
appear in the original training set, the similarity of the
larger positive class could have far outweighed that of
the smaller negative class.
5 CONCLUSIONS
This work has examined the Utility, Uniqueness and
Similarity of the synthetic Cystic Fibrosis patients’
EHRs with four SOTA generative models. We ob-
served increased accuracy in predictive performance
with both VAE and CTGAN when we augmented the
EHRs with synthetic data. Similarity metrics appear
to explain the Utility performance of synthetic data
generators. While the amplification of a signal in
the synthetic dataset may do poorly to preserve the
faithfulness of the original data, it can provide greater
separability hence predictive performance. Consider-
ing the Uniqueness of each synthetic data generator,
CTGAN offers both high predictive performance and
Uniqueness of samples, which is beneficial for con-
sidering stricter conditions on privacy. These trade-
offs are problem-specific, and conclusions are to be
arrived at based on clinical relevance. For example,
do exaggerated signals corroborate clinical evidence
for co-occurrence of diseases? Given the caveats of
our dataset, we have not shown the clinical relevance
of individual features, which remains as future work.
Evaluation of the Synthetic Electronic Health Records
21

REFERENCES
Alaa, A. M., van Breugel, B., Saveliev, E., and van der
Schaar, M. (2021). How faithful is your synthetic
data? sample-level metrics for evaluating and auditing
generative models. arXiv preprint arXiv:2102.08921.
Chen, R. J., Lu, M. Y., Chen, T. Y., Williamson, D. F., and
Mahmood, F. (2021). Synthetic data in machine learn-
ing for medicine and healthcare. Nature Biomedical
Engineering, pages 1–5.
Choi, E., Biswal, S., Malin, B., Duke, J., Stewart, W. F., and
Sun, J. (2017). In Machine learning for healthcare
conference, pages 286–305. PMLR.
Douzas, G. and Bacao, F. (2018). Effective data generation
for imbalanced learning using conditional generative
adversarial networks. Expert Systems with applica-
tions, 91:464–471.
Dwork, C., Roth, A., et al. (2014). The algorithmic foun-
dations of differential privacy. Found. Trends Theor.
Comput. Sci., 9(3-4):211–407.
Engelmann, J. and Lessmann, S. (2020). Condi-
tional wasserstein gan-based oversampling of tabu-
lar data for imbalanced learning. arXiv preprint
arXiv:2008.09202.
Fiore, U., De Santis, A., Perla, F., Zanetti, P., and Palmieri,
F. (2019). Using generative adversarial networks for
improving classification effectiveness in credit card
fraud detection. Information Sciences, 479:448–455.
Kynk
¨
a
¨
anniemi, T., Karras, T., Laine, S., Lehtinen, J.,
and Aila, T.(2019). Improved precision/recall met-
ric for assessing generative models. arXiv preprint
arXiv:1904.06991.
Liu, Y., Zhou, Y., Liu, X., Dong, F., Wang, C., and Wang, Z.
(2019). Wasserstein gan-based small-sample augmen-
tation for new-generation artificial intelligence: a case
study of cancer-staging data in biology. Engineering,
5(1):156–163.
Naeem, M. F., Oh, S. J., Uh, Y., Choi, Y., and Yoo, J.
(2020). Reliable fidelity and diversity metrics for gen-
erative models. In International Conference on Ma-
chine Learning, pages 7176–7185. PMLR.
Ngwenduna, K. S. and Mbuvha, R. (2021). Alleviating class
imbalance in actuarial applications using generative
adversarial networks. Risks, 9(3):49.
Sajjadi, M. S., Bachem, O., Lucic, M., Bousquet, O., and
Gelly, S. (2018). Assessing generative models via pre-
cision and recall. arXiv preprint arXiv:1806.00035.
USCFF (2020). Patient registry annual data report. https:
//www.cff.org/media/23476/download. Accessed: 07-
12-2021.
Xie, L., Lin, K., Wang, S., Wang, F., and Zhou, J. (2018).
Differentially private generative adversarial network.
arXiv preprint arXiv:1802.06739.
Xu, L., Skoularidou, M., Cuesta-Infante, A., and Veera-
machaneni, K. (2019). Modeling tabular data using
conditional gan. arXiv preprint arXiv:1907.00503.
Xu, L. and Veeramachaneni, K. (2018). Synthesizing tabu-
lar data using generative adversarial networks. arXiv
preprint arXiv:1811.11264.
Yoon, J., Drumright, L. N., and Van Der Schaar, M. (2020).
Anonymization through data synthesis using genera-
tive adversarial networks (ads-gan). IEEE journal of
biomedical and health informatics, 24(8):2378–2388.
SDAIH 2022 - Scarce Data in Artificial Intelligence for Healthcare
22
