
Determing the Decentrality of Production Processes Due to Analysis of
Their Communication Structure
Hanna Theuer
a
Chair of Business Information Systems, Processes and Systems, University of Potsdam,
August-Bebel-Str. 89, 14482 Potsdam, Germany
Keywords:
Decentralized Production Control, Social Network Analysis, Autonomy, Communication Structure, Decision
Structure, Industry 4.0, Production Planning and Control.
Abstract:
This paper motivates the benefits of the analysis of the communication structure for process improvement.
Therefore first, the paper presents a three-stage model for determining the decentralization of production pro-
cesses. This is based on the analysis of the communication and decision structure of the process’ actors. In
addition, it presents a way of visualizing communication relationships. To conclude, this paper presents a
practical example and the results of a simulation study. It depicts the advantages of analyzing the communi-
cation structure.
1 INTRODUCTION
Decentralized production helps companies to meet
today’s market requirements (Petschow et al., 2014;
Kluth and Storr, 1997; Sundermeier et al., 2020). Pos-
itive benefits are an increased speed of response and
adaptability (Hichert et al., 1996; Ten Hompel and
Henke, 2014) as well as cost advantages by a task
integration over centralized production control (Mil-
berg, 1991; Westk
¨
amper et al., 1998). They allow a
short-term reaction to unforeseen events and thus con-
tribute to an increase in the reaction speed (Mussbach-
Winter, 1997). Further advantages include the in-
crease of transparency, a reduction of the forecast
shares, the improvement of the planning quality, and
a reduction and control of the complexity (K
¨
ohler
et al., 1997). Characteristics of decentralized produc-
tion control are few hierarchical levels with homo-
geneously distributed decision-making authority [10],
which independently decide on optimal manufactur-
ing methods, product quality, and the timing of orders
(Mussbach-Winter, 1997).
Scientists have been discussing the advantages of
decentralized control for over 20 years (see for ex-
ample (K
¨
ohler et al., 1997; Ramsauer, 1997)). How-
ever, developments in recent years have created ex-
tensive opportunities for technical implementation
(Faber, 2019; Huber, 2018; Wang et al., 2017). The
transfer of decision-making, execution, and commu-
a
https://orcid.org/0000-0002-2238-5699
nication capabilities to actors involved enables decen-
tralized production control. These technologies are
summed up under the term autonomous technologies.
Autonomous technologies are a basis for decentral-
ized production planning (Zeidler et al., 2019).
Although the benefits of decentralized control
structures are well known (Windt, 2006; Ramsauer,
1997), it is not possible to make general statements
about the best decentralization of a production pro-
cess. Instead, it is necessary to examine on a process-
specific basis which implementation is best suited
to achieving the desired goals (Gronau and Theuer,
2016). Therefore, it is important to operationalize the
decentrality of a production process.
Though the importance of the communication
structure increases, there is no method that uses the
communication structure as the basis for operational-
izing decentralization. Therefore, the author of this
paper suggests a three-stage model. It allows deter-
mining decentralization based on the communication
and decision structure of the process actors.
Therefore first, the paper presents a three-stage
model for determining the decentralization of produc-
tion processes. This is based on the analysis of the
communication and decision structure of the process’
actors. In addition, it presents a way of visualizing
communication relationships. To conclude, this paper
presents a practical example and the results of a sim-
ulation study. It depicts the advantages of analyzing
the communication structure.
66
Theuer, H.
Determing the Decentrality of Production Processes Due to Analysis of Their Communication Structure.
DOI: 10.5220/0011526700003329
In Proceedings of the 3rd Inter national Conference on Innovative Intelligent Industrial Production and Logistics (IN4PL 2022), pages 66-74
ISBN: 978-989-758-612-5; ISSN: 2184-9285
Copyright
c
2022 by SCITEPRESS – Science and Technology Publications, Lda. All rights reserved
2 DETERMING DECENTRALITY
IN PRODUCTION PROCESSES
The communication and control structure of the ac-
tors involved in the process takes an important role
in decentralized production control. For determing
actor-based decentrality in production processes, it is
necessary to define when an actor reaches the maxi-
mum or minimum structural centrality and what the
mathematical relationship is between the factors and
the target value (decentrality) in terms of increase and
decrease of distances and number of reachable actors.
The focus is on one element at a time. Relevant fac-
tors are, according to the social network analysis, the
number of elements the considered element reaches,
and the steps required for this.
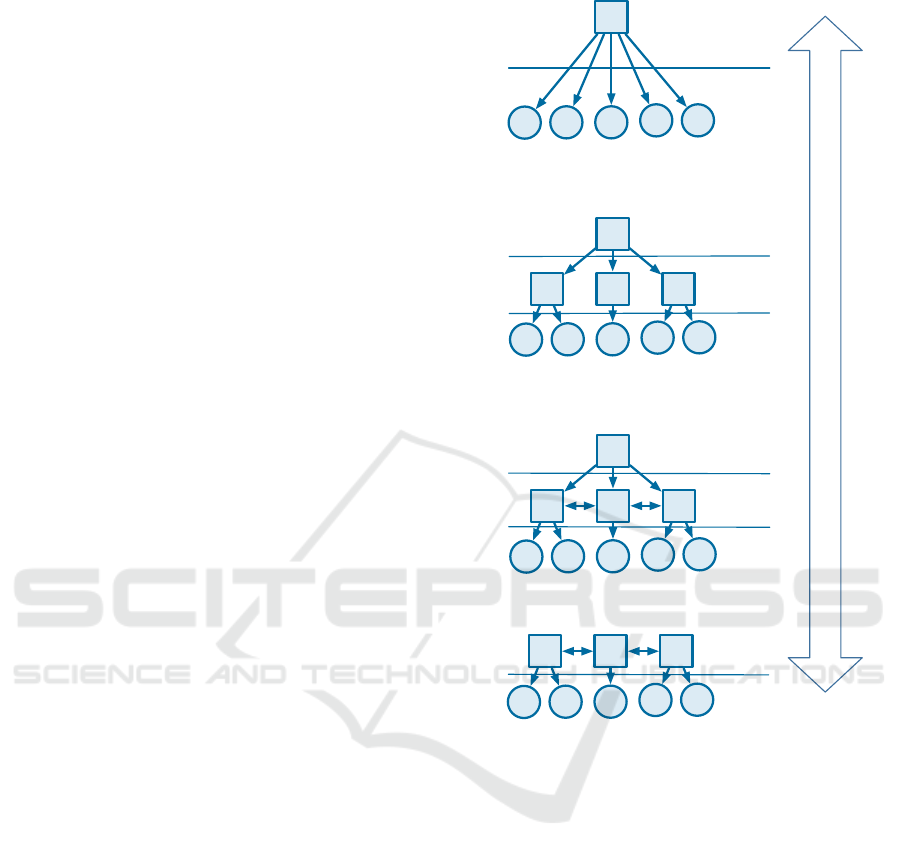
Based on the four forms of control structures (see
figure 1), four definitions are necessary (for detailed
argumentation and mathematical examination of the
definitions, please see (Theuer, 2022)): Dilts et al.
distinguish between controlling and executing units.
Controlling actors are actively involved in decision-
making and can pass on the decisions made to their
subordinate units. However, they cannot execute de-
cisions. Executing actors implement the instructions
they have received from their upstream entities. They
are not involved in decision-making (Boccella et al.,
2020). The model presented in this paper removes this
separation, as modern technologies enable the unifi-
cation of controlling and executing activities by one
actor.
1. The structural autonomy of an actor is maximal
if and only if it reaches all actors in the network
directly.
2. The structural autonomy of an actor is minimal if
and only if it cannot reach any other actor in the
network.
3. The structural autonomy of an actor decreases
with an increasing distance to the other actors
(given a constant number of reachable actors).
4. The structural autonomy of an actor increases
with an increasing number of reached actors
(given a constant sum of distances).
3 THREE-STAGE MODEL
This paper presents a three-stage model for the analy-
sis of actor-based decentrality in production processes
(see figure 1). Stage 1 analyzes the communication
and decision structure of autonomous actors. Social
network diagrams visualize the communication struc-
ture (nodes and directed edges). Afterward, stage 2
e
A
d
cb
a
level 1
level 2
Central
e
A
DCB
d
cb
a
level 1
level 2
level 3
Proper Hierarchy
e
CBA
d
cb
a
level 1
level 2
Heterachy
e
A
DCB
d
cb
a
level 1
level 2
level 3
Modied Hierarchy
Central
Decentral
Figure 1: Four Forms of Control Structures (following
(Dilts et al., 1991)).
aggregates the results into a key figure that describes
the decentralization of the process step. Finally, stage
3 evaluates the decentralization of the process
3.1 First Stage: Actors’ Autonomy
The starting point of the model is the three ac-
tor classes: human, factory software (software in-
tegrated into machines), and operational application
system. Their instances fulfill the requirements of au-
tonomous actors (Theuer, 2018): independent infor-
mation processing, decision making, and decision ex-
ecution (Windt, 2008).
It is necessary to create an understanding of de-
centralization of production processes firstly. Four
requirements quantify the communication structure.
A systematic analysis confirms the suitability of the
social network analysis (SNA) key figure, harmonic
Determing the Decentrality of Production Processes Due to Analysis of Their Communication Structure
67
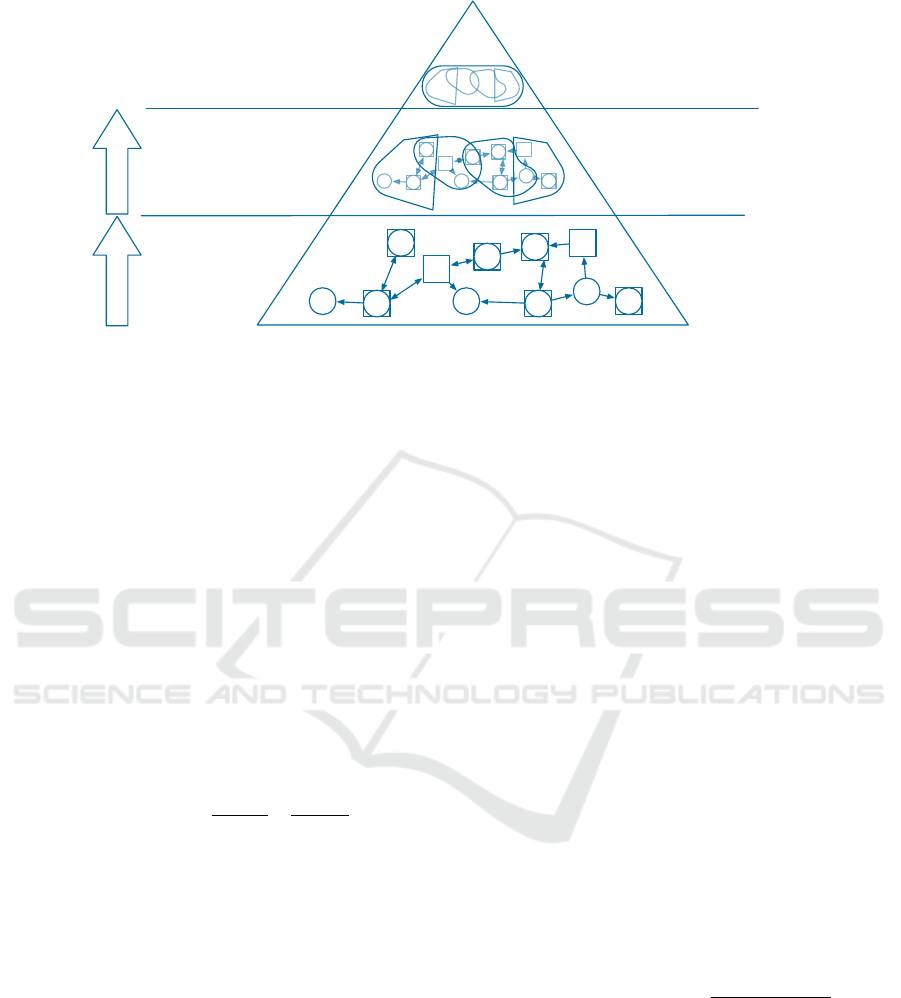
actors’ autonomy
decentrality of
process step
actor
production step
production process
aggregation
aggregation
Autonomy Index AI
Figure 2: Three-stage model for determination of decentralization of production processes.
closeness, for operationalizing the structural auton-
omy of individual autonomous actors. A correction
factor considers self-executing actors in the calcula-
tion. Those combine decision-making and decision-
execution and have no directed connection to another
actor.
However, because of the possibility of integrating
control and execution capabilities in one actor, it is in-
sufficient to only focus on structural relations to deter-
mine decentralization. Therefore, the model consid-
ers a second value describing the decision structure. It
is determined by the ratio of the decision alternatives
of the actor to the sum of the decision alternatives in
the process step.
Actors’ autonomy R
a,ps
is calculated by multiply-
ing the two factors.
R
a,ps
= C
′
a,ps
· d
a,ps
= (C
a,ps
+
1
n
ps
− 1
) ·
e
a,ps
n
ps
∑
a
e
a,ps
(1)
with
R
a,ps
: Actors’ autonomy of actor a
in process step ps
C
′
a,ps
: Structural Autonomy of self executing
actor a in process step ps
c
a,ps
: Harmonic Closeness of actor a
in process step ps
d
a,ps
: Decision autonomy of actor a
in process step ps
e
a,ps
: Quantity of decisions of actor a
in process step ps
n
ps
: Number of actors in process step ps
3.2 Second Stage: Decentrality of
Process Steps
The calculation of the decentrality of the process step
is performed using the graph centrality of social net-
work analysis. The SNA distinguished two differ-
ent approaches to centrality determination. While
other explanations for the analysis of social structures
focused on the centrality of individual actors (“lo-
cal point centrality”) (Bavelas, 1950; Flament, 1963;
Beauchamp, 1965; Sabidussi, 1966), Freeman (Free-
man, 1978) succeeded in his work to consider the
whole network (“graph centrality”). He defines such
graphs as central, where one point dominates the other
points.
For this purpose, the sum of the differences be-
tween maximum and all other nodal centralities is first
calculated. Subsequently, the ratio of this value to the
theoretical maximum value is determined.
Freeman’s approach classifies the control struc-
ture (homogeneous/heterogeneous) of a graph. Thus,
it is suitable for determining the decentrality of pro-
duction processes. A square root increases the disper-
sion and allows better discrimination of the results.
D
ps
= 1 − C
ps
= 1 −
Σ
R
′
ps
− R
a,ps
n
ps
− 1
(2)
with
D
ps
: Decentrality of process step ps
C
ps
: Centrality of process step ps
R
′
ps
: max Actors’ autonomy in process step ps
R
a,ps
: Actors’ autonomy of actor a in process step
n
ps
: Number of actors in process step
IN4PL 2022 - 3rd International Conference on Innovative Intelligent Industrial Production and Logistics
68

3.3 Third Stage: Decentrality of Process
The third step (second aggregation) combines the pre-
viously determined characteristic values for the de-
centralization of process steps to a characteristic value
describing the decentralization of the process: the Au-
tonomy Index AI.
It was developed in accordance with the Lean
Index-a key metric of lean production. It compares
the value-added time of a process to the total cy-
cle time of a product through the process (Drees and
Sack, 2011; Erlach, 2020). During initial research ac-
tivities, the calculation was based on a binary value
(0 or 1) (Theuer, 2011; Gronau, 2016). However, re-
search work has shown that a continuous value (be-
tween 0 and 1) is more suitable. The Autonomy Index
increases as the process steps become more decentral-
ized. An AI of 1 indicates a total decentralized, an AI
of 0 a total central production.
AI =
∑
D
ps
n
ps
(3)
with
AI: Autonomie Index
D
ps
: Decentrality of process step ps
n
ps
: Number of actors in process step
4 INDUSTRIAL EXAMPLE
The analysis uses a process from the variant-rich
small batch production of an industrial company. The
process comprises 13 process steps, with 24 actors of
the three actor classes involved; material transported
is via trolleys, with a one-to-one relation. Some parts
of the process use FIFO (first in first out) lines. The
process includes branching. Sometimes there is a
need for jumps back and external manufacturer. In-
formation sharing is via paper-based information ob-
jects.
The following paragraphs present the analysis of
one process step and interpret the results. After, pro-
cess improvement, based on the analysis of its com-
munication structure, follows.
4.1 Analysis of Process
The analysis of the practice process is based on doc-
umentation of the process as extended event-driven
process chains (eEPC). Besides the temporal and log-
ical sequence, the diagrams contain the human actors
responsible for the work steps, the used information
objects, and other technical, non-autonomous actors
(e. g. machines).
employee warehouse
SAP
disponent
employee sales
employee
warehouse office
worker
manufacturing
controller
Figure 3: Visualization of the communication relationship
of the considered process step 6.
First, the communication relationships are deter-
mined and next visualized in figure 2. Rules for the
consideration of non-autonomous actors and informa-
tion objects are applied.
The figure depicts that SAP occupies a very cen-
tral structural position. Every other actor is a direct
neighbor. From and to the worker, there are commu-
nication relations to the actor employee warehouse of-
fice, employee warehouse, and production controller.
Table 1 presents the results of the first stage of the
presented evaluation model.
Table 1: Characteristics of process step 6 (central scenario).
actor d
a,6
c
a,6
R
a,6
disponent 0,091 0,583 0,053
manufacturing controller 0,045 0,667 0,030
employee warehouse 0,045 0,667 0,030
employee warehouse office 0,045 0,667 0,030
employee distribution 0,045 0,583 0,027
SAP 0,682 1,000 0,682
worker 0,045 0,833 0,038
D
6
0,196
Analogously, the further twelve process steps of
the practice process are examined. Table 2 shows the
number of autonomous actors involved #a, the num-
ber of actors #c
ca,ps
> 0 and decision-making auton-
omy d
a,ps
> 0, and the decentralization of the process
step D
ps
. It also includes the Autonomy Index AI as a
characteristic value, describing the decentrality of the
process.
It shows varying decentralization of the process
steps. While process step 4 (warehouse preparation)
has the lowest decentralization of 0.065, process step
2 (creation of production order) has the highest value
of 0.470. The resulting Autonomy Index is 0.224.
Overall, decentralization is rather low, e.g. a central
authority largely controls the process.
Determing the Decentrality of Production Processes Due to Analysis of Their Communication Structure
69

Table 2: Characteristics of the industrial process (central scenario).
process step #a #c
a,ps
#d
a,ps
D
ps
1 creation planned order 3 3 3 0,084
2 creation of production order 5 5 5 0,470
3 purchasing 3 3 3 0,138
4 storage preparation 2 2 2 0,065
5 storage preparation 4 4 3 0,353
6 manufacturing component A 7 7 7 0,196
7 manufacturing component B 7 7 4 0,161
8 manufacturing component C 7 7 6 0,196
9 manufacturing component D 7 7 7 0,173
10 assembly 3 3 3 0,214
11 testing 5 5 5 0,213
12 varnishing 5 5 4 0,277
13 shipping 4 4 4 0,373
4.2 Process Improvement
The visual representation of the communication rela-
tionships can provide clues for improving the process
in terms of decentralization. It allows the identifica-
tion of very central and very distant actors that can
only be reached via a long communication path. The
possibilities of cyber-physical elements offer a ba-
sis for the development of alternative scenarios. Be-
sides the flow of information and the decision-making
structure, it is also important to consider the imple-
mentation of the material flow. Therefore, the mo-
bility of processing actors, workpieces, and tools as
well as the design of the material flow (for exam-
ple, rigid transport routes, flexible transport routes
(human-controlled/unmanned)) have to be analyzed.
The previously described process was analyzed
based on the visualizations of the communication re-
lationships and process alternatives were developed.
Figure 3 shows the resulting communication diagram.
disponent
manufacturing
controller
employee sales
SAP
employee
warehouse
office
employee
warehouse
drilling machine
worker
saw
lathe
AGV
Figure 4: Visualization of the communication relationship
of the decentralized process step 6.
The following general considerations underlie the
process improvement:
• transport carriage, drilling machine, lathe and saw
are designed as autonomous actors (actor class
factory software) by integrating smart technolo-
gies. This empowers them to take part actively in
decision- making and promotes the benefits of de-
centralized production control. That reduces the
strong centrality of the SAP system.
• transport carriage is a driverless transport sys-
tem that independently determines the route to the
next processing step. Manual operation becomes
obsolete so that the human actors involved in the
process can pursue value-adding activities.
• an operable display at transport carriage enables
its operation by human operators. The human op-
erator can directly assign processing results or an-
notations to the workpiece on-site (1:1 relation-
ship of transport carriage and workpiece). This
avoids the need to enter data via production data
acquisition (PDA) terminals connected to the cen-
tral SAP.
Besides these general considerations, there are
two changes to the process considered:
• the SAP operational application system notifies
the transport cart of the order data at the begin-
ning of the process step. After competition of all
process steps, the transport cart reports back to the
system. This parallelizes the material and infor-
mation. Also, it significantly reduces the num-
ber of communication relationships from or to the
SAP system.
• the transport carriage independently schedules the
processing sequence and times by communicat-
ing with the autonomous actors drilling machine,
lathe, and saw. Thus, the decentralized decision-
making process can always consider the current
situation, which increases flexibility in the face of
IN4PL 2022 - 3rd International Conference on Innovative Intelligent Industrial Production and Logistics
70

deviations compared to planning by a central con-
troller.
Table 3 lists the characteristic values of the decen-
tralized scenario. It highlights an increased centrality
of the transport trolley and a decreased centrality of
the SAP system. The ERP solution now only has bidi-
rectional communication relationships with employee
sales, production controller, and scheduler. These
three human actors perform tasks upstream and down-
stream of the actual value-added manufacturing pro-
cess. SAP and shop floor communicate exclusively
via a communication relationship between SAP and
AGV.
Table 3: Characteristics of process step 6 (decentral sce-
nario).
actor d
a,6i
c
a,6i
R
a,6i
AGV 0,296 0,800 0,237
disponent 0,074 0,442 0,033
drilling machine 0,074 0,220 0,041
employee distribution 0,037 0,442 0,016
employee warehouse 0,037 ,0533 0,020
employee warehouse office 0,037 0,533 0,020
lathe 0,037 0,550 0,020
manufacturing controller 0,037 0,442 0,016
saw 0,074 0,550 0,041
SAP 0,259 0,683 0,177
worker 0,037 0,525 0,019
D
6
0,556
The actor characteristics are more homogeneous
in the improved process than in the original process.
It shows that the decentralization of the process step
has increased in comparison. Additionally, the struc-
tural and decision-making autonomy and the resulting
autonomy of the actors are more balanced.
In conclusion, more actors are involved in
decision-making in the improved process than in the
original process. This is due in particular to the en-
dowment of previously non-autonomous actors with
the criteria decision making, information processing,
and decision execution.
Table 4 presents the results of process adaptation
for all 13 process steps. The number of actors in-
volved has increased in most process steps. The de-
centralization of the process steps has risen signifi-
cantly because of shifting away from a few central ac-
tors and a more even distribution of decision-making
authority. In summary, the Autonomy Index increases
to 0,511.
The comparison of alternative scenarios and
theirs’ effects is very time-consuming and cost-
intensive. Therefore, presented industrial example
could not highlight the effects of decentralization on
the production process (model’s stage 3). To perform
the complete model with all three stages and to so
show the impacts of the process changes, the author
carried out a simulation study with two scenario (cen-
tral and decentral control) at the Center Industry 4.0
Potsdam. The next section presents the results.
5 SIMULATION STUDY
The simulation process is the production of optical
lenses. It was conducted at Center Industry 4.0 Pots-
dam (LSWI, 2022). It comprises the four process
steps of grinding, marking, dyeing, and quality con-
trol. There are two parallel machines for grinding.
Figure 5 visualizes the value stream diagramm of
the process. The communication relationships are
recorded, stored in a database, processed, classified,
filtered, and aggregated with SQL. Subsequently, an
R script evaluates them. Additionally, an assignment
of the decision alternatives to the actors takes place.
This Evaluation also includes the decision structure.
The process under consideration starts with the
regular operation of lens production. A workpiece
carrier transports a batch of lenses. After a short time,
a rush job is set up. The goal is to produce the rush
order in the required time of two minutes and fifteen
seconds. At the same time, the regular operation is to
be produced with the shortest possible lead time.
Two scenarios are simulated: a central and a de-
central one. In the central scenario, the Control Cen-
ter performs production planning, the control com-
mands are passed on to the other actors. Ten actors
are involved. The decentralized scenario distributes
decision-making among 14 autonomous actors. For
this purpose, the decentralized actors have local intel-
ligence. The example process is suitable for the val-
idation of the developed evaluation model, since the
differentiation of centralized and decentralized con-
trol is possible. The communication relationships and
the distribution of the share in the decision-making
process per actor can be varied. Thus, the parameters
relevant for the model can be changed, so that the ef-
fects can be analyzed. Each simulation run considers
a normal and a rush order. Twenty simulation runs
were executed from both scenarios. The communica-
tion structure and the decision structure are recorded.
Additionally, lead time is collected as a metric to eval-
uate the benefits. Table 5 presents the results.
The analysis highlights that the decentralization of
the process step is much more homogeneous in the
decentralized scenario. The autonomy index AI in-
creases significantly from 0.175 to 0.680. Decentral-
ization lowers lead time both in normal order and in
rush order. The robustness (standard deviation of the
Determing the Decentrality of Production Processes Due to Analysis of Their Communication Structure
71
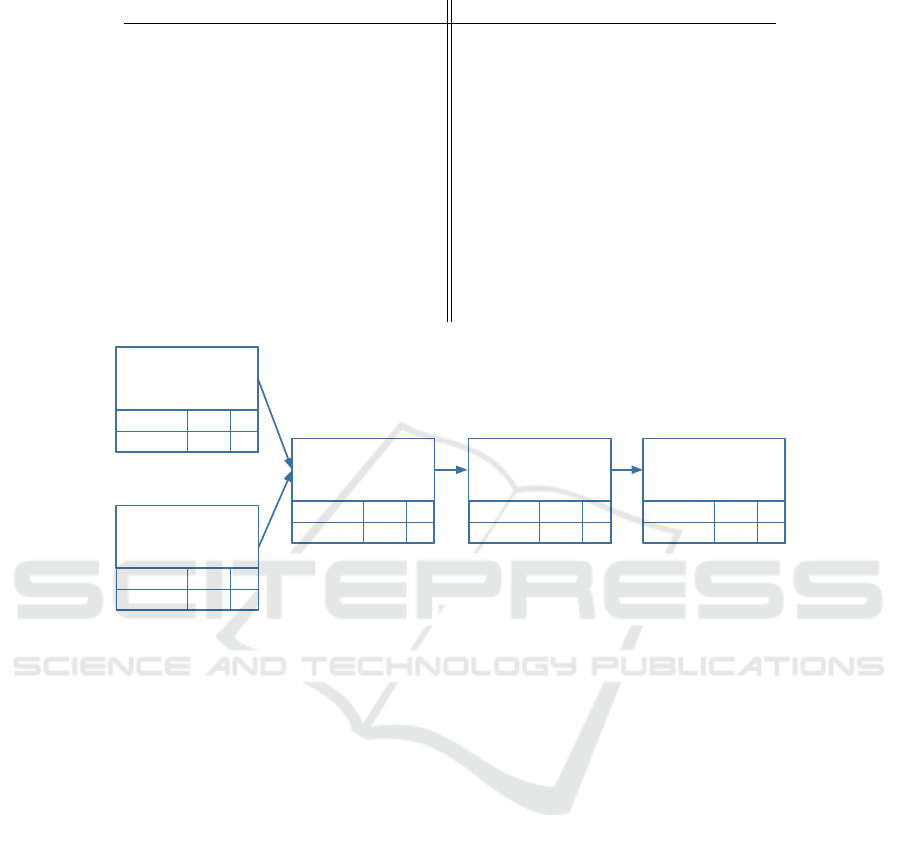
Table 4: Characteristics of the industrial process (decentral scenario).
process # a #c
a,ps
> 0 #d
a,ps
> 0 D
ps
1 creation planned order 3 3 3 0,084
2 creation of production order 5 5 5 0,437
3 purchasing 4 4 4 0,353
4 storage preparation 3 3 3 0,684
5 picking 5 5 5 0,476
6 manufacturing component A 11 11 11 0,556
7 manufacturing component B 11 11 11 0,556
8 manufacturing component C 10 10 10 0,559
9 manufacturing component D 10 10 10 0,548
10 assembly 4 4 4 0,608
11 testing 6 6 6 0,652
12 varnishing 6 5 5 0,552
13 shipping 5 5 5 0,571
Dyeing
Duration sec25
Decision pc.5
Duration sec30
Decisions pc.7
Grinding 1
Grinding 2
Duration sec35
Decisions pc.7
Marking
Duration sec25
Decision pc.5
Quality Control
Duration Sec30
Decision pc.6
Figure 5: Value Stream Diagram of Process Used in Simulation Study
collected lead times) rises. Thus, decentralization im-
proves process planning and the adherence to delivery
of this process.
6 CONCLUSIONS AND
LIMITATIONS
This papers presents a model that, for the first time,
focuses on the autonomy of the actors for technically
dominated systems. Therefor it considers both the
structural and the decision-making autonomy of each
actor. The model enables an evaluation of the overall
system through 2-level aggregation.
An industrial process was used to show how vi-
sualization of the communication structure can serve
as a basis for process improvement. The presented
model was run under laboratory conditions in a sim-
ulation environment. Transfer and application of the
model in a real production environment bear the risk
that the data acquisition is incomplete. Experience
shows that the interaction of human actors with each
other and with the technical components of the pro-
duction process is characterized by actions re-
acting to the individual situation. These can be short
agreements and shouts or even smaller manual inter-
ventions in the process flow, such as the alignment of
a workpiece. Complete monitoring requires a great
deal of effort, especially with spatially distributed
processes - either by human observers or by technical
instruments such as cameras and microphones,
although legal restrictions must be expected here
regarding the monitoring of individual persons and
their work performance.
Another challenge of practical application con-
cerns the operationalization of decision autonomy.
Both the complete identification of decision alterna-
tives and their allocation to the actors involved is dif-
ficult to realize in reality. Reasons are especially deci-
sions with continuous values, such as processing du-
rations, which theoretically contain an infinite num-
ber of decision alternatives. It is necessary to make
a reasonable discretization - a wrong choice distorts
the model’s results. Further challenges may be the as-
signment of actors to decision alternatives, especially
because it is not always possible to assign decisions
unambiguously.
IN4PL 2022 - 3rd International Conference on Innovative Intelligent Industrial Production and Logistics
72

Table 5: Results of the simulation study.
process step
central decentral
#c
a,ps
> 0 #d
a,ps
> 0 #D
ps
> 0 #c
a,ps
> 0 #d
a,ps
> 0 #D
ps
> 0
1 7 1 0,437 12 5 0,768
2 5 1 0,051 9 4 0,529
3 7 1 0,127 9 6 0,721
4 4 1 0,087 5 5 0,703
AI 0,175 0,680
lead time 3’07” (normal order ) — 3’05” (rush order) 3’02” (normal order) — 2’14” (rush order)
σ 15” (normal order) — 12” (rush order) 5” (normal order) — 2” (rush order)
Table 6: Results of the simulation study.
process step
central decentral
#c
a,ps
> 0 #d
a,ps
> 0 #D
ps
> 0 #c
a,ps
> 0 #d
a,ps
> 0 #D
ps
> 0
1 7 1 0,437 12 5 0,768
2 5 1 0,051 9 4 0,529
3 7 1 0,127 9 6 0,721
4 4 1 0,087 5 5 0,703
AI 0,175 0,680
lead time 3’07” (normal order ) — 3’05” (rush order) 3’02” (normal order) — 2’14” (rush order)
σ 15” (normal order) — 12” (rush order) 5” (normal order) — 2” (rush order)
Another restriction of the practical feasibility is
the realization of different scenarios of a real pro-
cess in the factory because high time and financial ef-
fort are expected for the restructuring in each case.
The scenarios allow the effects of different control
strategies to be compared. In addition, production
downtimes occur, resulting in further financial losses.
Particularly in the case of existing processes (brown-
field), the benefit of the evaluation model, therefore,
lies in the retrospective evaluation of implemented re-
structuring measures. In the case of newly planned
processes (greenfield), the model can help in design-
ing process control.
The limits of the developed model are therefore
the determination of the real input data and the high
effort for implementing different scenarios of a pro-
duction process. Examining the processes in suitable
simulation environments such as Center Industry 4.0
Potsdam can reduce the risks. However, a prerequisite
here is also a suitable abstraction of the real process
and the modeling based on it.
Based on the results of the work on which this pa-
per is based, there is a need for further research, which
relates in particular to the practical application of the
model in a real production process with the challenges
described in the previous section. Another research
approach is to apply the model to different types of
production processes - for example, classified by dif-
ferent types of manufacturing and organization or in-
dustries.
Comparing the results makes it possible to answer
the questions of whether it is possible to classify the
benefits of decentralized control structures according
to certain criteria and if there are best practices.
In this context, a comparative study with other
evaluation models is possible as well.
REFERENCES
Bavelas, A. (1950). Communication patterns in task-
oriented groups. In The Journal of the Acoustical So-
ciety of America, volume 6, pages 725–730.
Beauchamp, M. A. (1965). An improved index of central-
ity. In Behavioral Science – Journal of the Society
for General Systems Research, volume 10, pages 161–
163.
Boccella, Centobelli, P., Cerchione, R., Murino, and Riedel
(2020). Evaluating centralized and heterarchical con-
trol of smart manufacturing systems in the era of in-
dustry 4.0. Applied Sciences, 10:755.
Dilts, D., Boyd, N. P., and Whorms, H. H. (1991). The eval-
uation of control architectures for automated manu-
facturing systems. Journal of Manufacturing Systems,
10:79–93.
Drees, J. and Sack, C. (2011). Produktionsoptimierung
durch kennzahlen der wertstrom-modellierung.
Zeitschrift f
¨
ur wirtschaftlichen Fabrikbetrieb,
106(6):466–470.
Erlach, K. (2020). Wertstromdesign - Der Weg zur
schlanken Fabrik, volume 3. Springer Vieweg.
Faber, O. (2019). Digitalisierung–ein megatrend: Treiber
& technologische grundlagen. In Management 4.0–
Unternehmensf
¨
uhrung im digitalen Zeitalter, pages 3–
42. Springer.
Determing the Decentrality of Production Processes Due to Analysis of Their Communication Structure
73

Flament, C. (1963). Applications of Graph Theory to Group
Structure. Prentice-Hall Series in Mathematical Anal-
ysis of Social Behavior.
Freeman, L. C. (1978). Centrality in social networks con-
ceptual clarification. Social Networks, 1(3):215 – 239.
Gronau, N. (2016). Handbuch der ERP-Auswahl, volume 2.
GITO mbH.
Gronau, N. and Theuer, H. (2016). Determination of the op-
timal degree of autonomy in a cyber-physical produc-
tion system. In Proceedings of 49th CIRP Conference
on Manufacturing Systems (CIRP-CMS 2016).
Hichert, R., Roos, A., Ziegler, J., Reichwald, R., M
¨
oslein,
K., Meitner, H., Schweiggert, F., and Ebersp
¨
acher, J.
(1996). Information und kommunikation in dezen-
tralen strukturen. In Bullinger, H.-J. and Warnecke,
H.-J., editors, Neue Organisationsformen im Un-
ternehmen, pages 657–752. Springer-Verlag.
Huber, W. (2018). Industrie 4.0 kompakt–Wie Tech-
nologien unsere Wirtschaft und unsere Unternehmen
ver
¨
andern. Springer.
Kluth, R. and Storr, A. (1997). Hohe produktivit
¨
at durch
werkergerechtes, situationsorientiertes informations-
management. In f
¨
ur Fertigungstechnik, G., editor,
FTK’97: Fertigungstechnisches Kolloquium, pages
325–349.
K
¨
ohler, A., L
¨
ammle, C., and Wiendahl, H.-H. (1997).
Dezentralisierung und vernetzung der produktionspla-
nung und -steuerung. In f
¨
ur Fertigungstechnik, G.,
editor, FTK’97: Fertigungstechnisches Kolloquium,
pages 199–217.
LSWI (2022). Center industry 4.0 potdam – a worldwide
unique opportunity for an encounter with the future.
Webseite.
Milberg, J. (1991). Wettbewerbsfaktor zeit in produktion-
sunternehmen. In Wettbewerbsfaktor Zeit in Produk-
tionsunternehmen, pages 11–31. Springer.
Mussbach-Winter, U. (1997). Dezentrale produktionspla-
nung und -steuerung. In f
¨
ur Fertigungstechnik, G.,
editor, FTK’97: Fertigungstechnisches Kolloquium,
pages 420–431.
Petschow, U., Ferdinand, J.-P., Diekel, S., and Fl
¨
amig, H.
(2014). Dezentrale produktion, 3d-druck und nach-
haltigkeit. Schriftenreihe des I
¨
OW, 206:14.
Ramsauer, C. (1997). Dezentrale PPS-Systeme Neue Struk-
turen bei hoher Innovationsdynamik. Gabler Verlag.
Sabidussi, G. (1966). The centrality index of a graph. Psy-
chometrika, 31(4):581–603.
Sundermeier, J., Gehlhoff, F., and Fay, A. (2020). Devel-
opment of a simulation model to analyze the perfor-
mance of decentral rescheduling algorithms in pro-
duction systems. Simul. Notes Eur., 30(1):15–22.
Ten Hompel, M. and Henke, M. (2014). Logistik 4.0. In
Industrie 4.0 in Produktion, Automatisierung und Lo-
gistik, pages 615–624. Springer.
Theuer, H. (2011). Extension of value stream design for
the simulation of autonomous production systems. In
ElMaraghy, H., editor, Proceedings of the 4th Inter-
national Conference on Changeable, Agile, Reconfig-
urable and Virtual production (CARV 2011), pages
586–591. Springer Verlag.
Theuer, H. (2018). Autonome akteure in der dezentralen
produktionssteuerung. Industrie 4.0 Management,
34(6):41–44.
Theuer, H. (2022). Communication in decentralized pro-
duction system (accepted). In Proceedings of 31rd
International Conference on Flexible Automation and
Intelligent Manufacturing.
Wang, Y., Anokhin, O., and Anderl, R. (2017). Concept
and use case driven approach for mapping it security
requirements on system assets and processes in indus-
trie 4.0. Procedia CIRP, 63:207–212.
Westk
¨
amper, E., Wiendahl, H.-H., and Balve, P. (1998).
Dezentralisierung und autonomie in der produktion.
ZWF – Zeitschrift f
¨
ur wirtschaftlichen Fabrikbetrieb,
9(93):407–410.
Windt, K. (2006). Selbststeuerung intelligenter objekte in
der logistik. In Vec, M., H
¨
utt, M., and Freund, A., ed-
itors, Selbstorganisation – Ein Denksystem f
¨
ur Natur
und Gesellschaft. B
¨
ohlau Verlag, K
¨
oln.
Windt, K. (2008). Ermittlung des angemessenen selbsts-
teuerungsgrades in der logistik – grenzen der selbst-
steuerung. In Nyhuis, P., editor, Beitr
¨
age zur Theo-
rie einer Logistik, pages 349 – 372. Springer-Verlag
Berlin Heidelberg.
Zeidler, F., M
¨
uller, D., Ten Hompel, M., and Henke, M.
(2019). Wip-balancing by autonomous control using
flexibility oriented decision-making. In Proceedings
of 48th International Conference on Computers and
Industrial Engineering, CIE.
IN4PL 2022 - 3rd International Conference on Innovative Intelligent Industrial Production and Logistics
74
